Catalytic Steam Gasification of Biomass Surrogates: Thermodynamics and Effect of Operating Conditions
Bạn đang xem bản rút gọn của tài liệu. Xem và tải ngay bản đầy đủ của tài liệu tại đây (782.11 KB, 41 trang )
Accepted Manuscript
Catalytic Steam Gasification of Biomass Surrogates: Thermodynamics and Effect of Operating Conditions
Jahirul Mazumder, Hugo I. de Lasa
PII:
DOI:
Reference:
S1385-8947(16)30135-8
/>CEJ 14767
To appear in:
Chemical Engineering Journal
Received Date:
Revised Date:
Accepted Date:
21 November 2015
8 February 2016
10 February 2016
Please cite this article as: J. Mazumder, H.I. de Lasa, Catalytic Steam Gasification of Biomass Surrogates:
Thermodynamics and Effect of Operating Conditions, Chemical Engineering Journal (2016), doi: />10.1016/j.cej.2016.02.034
This is a PDF file of an unedited manuscript that has been accepted for publication. As a service to our customers
we are providing this early version of the manuscript. The manuscript will undergo copyediting, typesetting, and
review of the resulting proof before it is published in its final form. Please note that during the production process
errors may be discovered which could affect the content, and all legal disclaimers that apply to the journal pertain.
Catalytic Steam Gasification of Biomass Surrogates: Thermodynamics
and Effect of Operating Conditions
Jahirul Mazumder and Hugo I. de Lasa*
Chemical Reactor Engineering Centre, Department of Chemical and Biochemical
Engineering, The University of Western Ontario, London, Ontario N6A 5B9
ABSTRACT
Thermodynamic chemical equilibrium of biomass steam gasification is considered using
both stoichiometric and non-stoichiometric analyses. These thermodynamic analyses
include gaseous products, tars and coke, as well as consider a wide range of operating
conditions. It is shown that both stoichiometric and non-stoichiometric approaches
provide close results. Catalytic steam gasification of biomass surrogate species (glucose
and 2-methoxy-4-methylphenol) is developed in a CREC Riser Simulator under the
expected conditions of a circulating fluidized bed gasifier. A highly active and stable
fluidizable Ni/La2O3-γ-Al2O3 catalyst is employed in this study, to investigate the effects
of gasifier operating conditions. This catalyst yields 98% carbon conversion of glucose to
permanent gases with no tar formation and negligible coke deposition at 700 °C.
Catalytic gasification results with the variation of temperature and steam/biomass ratio
show limited deviation from equilibrium predictions. The deviation between
1
experimental results and equilibrium predictions can be attributed to the relatively shorter
reaction time (20s). As the reaction time is increased, experimental results approach
chemical equilibrium. For 2-methoxy-4-methylphenol gasification, 90% carbon
conversion is obtained with only 5.7 wt% tar formation and 3.3 wt% coke deposition.
Again chemical equilibrium predictions are close. The only exceptions are: a) Coke and
methane being overestimated and b) Tars being underestimated. Regarding synthesis gas
from glucose and 2-methoxy-4-methylphenol gasification, the Ni/La2O3-γ-Al2O3 catalyst
yields a H2/CO ratio greater than 2.0.
Keywords: steam gasification of biomass, La2O3 promoted Ni/γ-Al2O3 catalyst,
thermodynamic equilibrium, gasifier operating conditions.
* Corresponding author at: Chemical Reactor Engineering Center, Faculty of
Engineering, Department of Chemical and Biochemical Engineering, The University
of Western Ontario, London, ON, Canada N6A 5B9. Tel.: +1 519 661 2144;fax: +1 519
850 2931; e-mail:
2
1.0
Introduction
Biomass refers to organic materials derived from all living matter. Biomass from plants
was the first fuel used by humans to meet their energy demands. In the 19th century, the
discovery of fossil fuels helped to industrialize the world and improve the standard of
living. Nowadays, the gradual depletion of accessible fossil fuels and the increased
concerns about climate change are stimulating a renewed interest in the efficient
utilization of biomass as an energy source [1–4]. Biomass is considered as the primary
renewable resource given its abundance, its CO2 neutral emissions and its lower sulfur
content, in order to gradually replace depleting fossil fuels. Using biomass as an energy
source, zero net emissions of carbon dioxide can be achieved with the released carbon
dioxide being recycled back into plants via photosynthesis [4–9].
Different biomass conversion processes are utilized to produce heat and electricity, as
well as chemical feedstocks. In particular, biomass steam gasification has great potential
to produce synthesis gas with a high heating value and a high hydrogen content [1,2,4–
6,9–14]. Steam gasification of biomass can be implemented in fluidized beds. This is a
promising technology given the favorable effect of either inert sand or solid catalysts
particles to: (i) Enhance biomass heating, (ii) Favor very effective heat and mass transfer
between reacting species, (iii) Provide a close to uniform temperature established
throughout the gasifier [5,6,15,16].
3
One can view biomass gasification as a combination of primary and secondary reactions
[2,15,17,18]. Primary reactions transform vaporized biomass chemical species forming
permanent gases, higher hydrocarbons, coke and tars:
heat
Cx H y Oz + H2O →
H2 + CO+ CO2 + H2O + Cn H2m + C(s) + tars
(1)
Secondary reactions crack the higher hydrocarbons formed into gases. These gases can
either be combust or be reduced:
C n H 2 m + nH 2 O
→ nCO + ( n + m ) H 2
(2)
Furthermore, permanent gases react to alter the gas composition depending on gasifier
conditions as indicated below:
Chemical equation
Water-Gas Shift
∆ܪଶଽ଼
(݇ܬ/݉ )݈1
CO + H 2 O ←→ H 2 + CO 2
-41.16
(3)
CH 4 + H 2 O ←
→ CO + 3H 2
205.81
(4)
Dry Reforming of Methane
CH 4 + CO2 ←
→ 2CO + 2 H 2
246.98
(5)
Char Gasification
C + H 2 O ←→ H 2 + CO
131.29
(6)
Boudouard Reaction
C + CO 2 ←→ 2CO
172.46
(7)
Hydrogenating Gasification
C + 2 H 2 ←→ CH 4
-74.52
(8)
Steam Reforming of
Methane
1
standard heat of reaction at 298K were calculated from the standard heat of formation
4
The development of an efficient steam gasification process requires insights into biomass
gasification mechanisms in order to predict the end-reaction products. To date, different
types of models have been developed for biomass gasification. Thermodynamic
equilibrium models [4,19–25] provide valuable tools to predict the maximum achievable
yield of hydrogen or syngas. Most of the reported thermodynamic studies are on air
gasification of biomass. There is scarcity in comprehensive equilibrium models for
biomass steam gasification. Salaices et al [17] developed a thermodynamic model for
biomass steam gasification at atmospheric pressure without accounting for coke and tar
formation.
On the other hand, the use of an active and stable catalyst enables biomass gasification at
a low temperature operating close to thermodynamic equilibrium. Catalytic steam
gasification of biomass facilitates tar reforming eliminating costly downstream
processing [9,26,27]. Furthermore, the conversion of tar adds value to the syngas by
increasing the yields of H2 and/or CO [26,28,29]. As a result, catalytic biomass steam
gasification yields a higher energy efficiency process producing high quality and tar-free
synthesis gas [1,9,18,26].
Ni catalysts are a promising choice for biomass gasification due to their high reforming
activity and affordability [30–34]. Fluidizable γ-Al2O3 is one of the most promising
supports for a Ni-based catalyst due to its surface area and mechanical strength.
Moreover, La2O3 has been used as a promoter of Ni/Al2O3 catalysts [33–39]. Preparation
5
conditions and formulations of Ni/La2O3-γ-Al2O3 catalysts for biomass steam gasification
have been extensively investigated in our previous studies [40–42].
In the present study, a thermodynamic analysis of biomass steam gasification is
developed considering all gasification species, including both coke and tars. The
thermodynamic equilibrium predictions are compared with the catalytic gasification of
two biomass surrogate species (glucose and 2-methoxy-4-methylphenol) using a
Ni/La2O3-γ-Al2O3 catalyst [41]. It is proven that chemical thermodynamic equilibrium
displays close trends to the ones observed experimentally. These results highlight the
potential value of thermodynamics for performance evaluations of catalytic biomass
gasifiers.
2.0
Experimental Methods
2.1
Catalyst Preparation and Characterization
γ-Al2O3 (Sasol Catalox® SSCa5/200) was used as a catalyst support. La2O3 promoted
Ni/γ-Al2O3 catalyst was prepared using a specially designed multi-step incipient wetness
technique with the direct reduction of metal precursors after each impregnation in a
fluidized bed [41]. Three main steps were involved in the catalyst preparation: a) support
impregnation, b) drying, and c) metal precursor reduction. After the impregnation of the
precursor solution, the resulting paste was dried overnight at 140 °C. The dried powder
6
was then reduced in a specially designed fluidized bed chamber at 700 °C (3 °C/min) for
8 h under the flow of 10% H2-He.
It has been found in our earlier study [41] that a local bed temperature rise inside the
catalyst reduction chamber can occur due to the exothermicity of the metal nitrate
reduction process. This increase in bed temperature can cause severe catalyst sintering
via γ-Al2O3 dehydroxylation. Therefore, the catalyst precursor reduction step has to be
carefully considered to prevent temperature runaway. Gas flow during catalyst reduction
can control the rise of catalyst bed temperature and hence, it plays a major role in the
resulting catalyst properties such as surface structure, acidity-basicity, metal dispersion
and crystal size. The effect of reducing gas flow rate on the catalyst properties and their
performance for steam gasification of biomass surrogate species were discussed in details
in our previous work [41]. On this basis, a 20 wt% Ni/5wt% La2O3-γ-Al2O3 catalyst was
prepared under bubbling fluidization in the reduction chamber by flowing 12 L/min of
10% H2-He gas for every mole of impregnated metal nitrate. This catalyst, designated as
HF, is considered in the present study. Characterization results of the HF catalyst are
summarized in Table 1. Details of catalyst characterization techniques and results can be
found in our previous publication [41].
Table 1: Characterization results of HF catalyst
SBET
Pore volume
166 m2/g
0.32 cm3/g
Avg. proe diameter
76 Å
Ni reducibility
95%
7
2.2
Ni dispersion
4.52%
Total acidity
550 µmol NH3/g γ-Al2O3
Total basicity
188 µmol CO2/g γ-Al2O3
Gasification in a Minifluidized Bed CREC Riser Simulator
Cellulose (23-50 wt %) and lignin (10-29 wt %) are the two major components of
biomass. Cellulose is a glucose polymer, consisting of linear chains of glucopyranose
units. On the other hand, the building blocks of lignin are believed to be a three carbon
chain attached to rings of six carbon atoms, called phenyl-propanes [1]. Based on these,
glucose and 2-methoxy-4-methylphenol were selected as the surrogate species presenting
the cellulose and lignin content of biomass, respectively. Steam gasification of these
biomass surrogates were performed under the expected reaction conditions of a twin
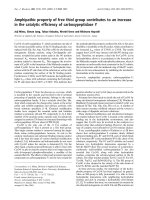
circulating fluidized bed gasifier using a CREC Riser Simulator [43]. The CREC Riser
Simulator is a bench-scale mini fluidized bed reactor with a volume of 50 cm3. A
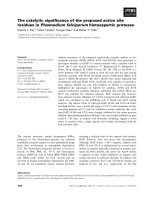
schematic diagram of the experimental setup is given in Figure 1. A detailed description
of the experimental setup and gasification procedure can be found in our previous work
[42].
In case of catalytic gasification experiments, 0.25 g of catalyst was loaded into the
catalyst basket. After the reactor reached the specified gasification temperature, the
solution of surrogate species was injected through the injection port using a syringe. Once
the reaction time was reached, gasification products were evacuated from the reactor to
8
the vacuum box. Reactor and vacuum box pressure data against time were recorded by
the Personal Daq Acquisition Card. Gasification products were analyzed using an online
GC-MS system. The permanent gases were analyzed by passing through a packed-bed
column (HaysSep® D) and a thermal conductivity detector (TCD). A capillary column
(BPX5 and a mass spectrometer (MS) were used to analyze the heavier compounds.
Figure 1: Schematic diagram of CREC Riser Simulator Gasification setup.
Gasification experiments were performed by varying the gasification temperatures (600,
650 and 700 °C), steam/biomass (S/B) ratios (0.4, 0.6, 0.8 and 1.0 g/g) and reaction times
(10, 15, 20 and 30 s). As the H/C and O/C of 2-methoxy-4-methyphenol are much lower
than those of glucose, a higher S/B ratio (1.5 g/g) was used in case of 2-methoxy-4-
9
methylpenol gasification in order to minimize tar formation. Selected operating
conditions were targeted for high carbon conversion and dry gas yield in a twin
circulating fluidized bed gasifier. Furthermore, gasification temperatures were limited to
700 °C to avoid potential operational issues such as ash agglomeration.
One should also note that catalytic gasification of biomass in a twin circulating fluidized
bed gasifier is proposed in this study. Similar to the operation of a FCC unit, it involves a
short contact time and the subsequent regeneration of catalysts. For such an operation, the
ratio of catalyst circulation rate (g/s) over the feedstock flow (g/s), is in the 5 to 30 range.
It is for this reason, and considering the possible extrapolation of results from the CREC
Riser Simulator to continuous riser units, a catalyst/biomass ratio (Cat/B) of 12.5 g/g and
20 s of contact time were selected. Moreover, this Cat/B ratio can be expressed as 4.17
gcat/g biomass/min or 0.07 gcat/g biomass/h and is also comparable with the continuous
biomass gasification processes reported in technical literature [31,33,34]. Furthermore,
with the change of S/B ratio, the Cat/B ratio was also varied to some extent as the amount
of both feed (solution of surrogate species) and catalysts were kept nearly constant. For
instance, the Cat/B ratio was reduced from 12.5 to 8.75 g/g with the decrease of S/B ratio
from 1.0 to 0.4 g/g.
Each experiment was repeated at least 4 times to secure the reproducibility of the results.
After each experiment, deposited coke was burned by air and the catalyst was reduced
later with H2. Relative standard deviations for experimental repeats were in the 3-10%
range with an average of 6 %. An important observation from these runs was that the
10
mass balance closures were all in the ±11% range, with most of the mass balances closing
in the ±5% range.
3.0
Chemical Thermodynamics
Chemical thermodynamic equilibrium calculations allow one to develop feasibility
studies before attempting experimental investigations. Chemical reaction equilibrium can
be determined by Gibbs Free Energy Minimization using either a stoichiometric or a nonstoichiometric approach. Stoichiometric models are based on equilibrium constants
established for a set of possible chemical reactions taking place in the gasifier. On the
other hand, non-stoichiometric models involve minimization of the system Gibbs free
energy for a set of specified products. Thus, this method does not require specifying the
individual chemical reactions involved. In principle, if reactions, chemical species and
Gibbs Free Energies are adequately selected, both stoichiometric and non-stoichiometric
models should lead to close results.
3.1
Stoichiometric Approach
In the specific case of biomass gasification, a reaction path independent stoichiometric
equilibrium model can be developed based on the following assumptions:
11
a) The C, H, and O elements are the only elements to be considered in the biomass
feedstock. Thus, the possible contributions of biomass nitrogen and sulfur species are
assessed as insignificant in equilibrium calculations [19,44].
b) The ash in biomass does not affect chemical equilibrium.
c) The resulting char is approximated as carbon species only, with other possible
constitutive elements being neglected.
d) The gaseous products are assumed to behave as ideal gases.
e) A perfect mixing and uniform temperature distribution inside the gasifier are
hypothesized. These are mixing conditions applicable for gasification in a fluidized
CREC Riser Simulator.
f) H2, CO, CO2, H2O, CH4, C2H4 and C2H6 are the relevant chemical species to be
considered. This assumption is justified given that these chemical species are the ones
observed experimentally during gasification.
g) Tar products are modeled using selected compounds: a) Toluene to represent all onering compounds, b) Phenol to represent phenolic and other heterocyclic compounds, c)
Naphthalene to represent two-ring aromatics and d) Pyrene to represent three-ring and
higher aromatics.
12
Based on the above assumptions and considerations, an overall chemical reaction of
biomass steam gasification can be considered as:
C x H y Oz + mH 2 O heat
→
A1 H 2 + A2 CO + A3 CO2 + A4 H 2 O + A5 CH 4 + A6 C2 H 4
+ A7 C 2 H 6 + A8 C( s ) + A9 C7 H 8 + A10 C6 H 6 O + A11C10 H 8 + A12C16 H10
(9)
It should be noted that x, y and z can be obtained from the ultimate analysis of biomass,
and m depends on the steam/biomass ratio.
C, H and O elemental balances on the both sides of Eq. (9) results in:
ܣ = ݔଶ + ܣଷ + ܣହ + 2 ܣ+ 2 ܣ+ ଼ܣ+ 7ܣଽ + 6ܣଵ + 10ܣଵଵ + 16ܣଵଶ
(10)
ݕ+ 2݉ = 2ܣଵ + 2ܣସ + 4ܣହ + 4 ܣ+ 6 ܣ+ 8ܣଽ + 6ܣଵ + 8ܣଵଵ + 10ܣଵଶ
(11)
ݖ+ ݉ = ܣଶ + 2ܣଷ + ܣସ + ܣଵ
(12)
Moreover, from the reactions involving permanent gases, as given in Eqs. ((3)-(8)), one
can consider three reactions as being independent: a) the water gas shift, b) the steam
reforming of methane, and c) the char gasification. Furthermore, to include higher
hydrocarbons and tar compounds in the analysis, the following independent reforming
reactions are considered:
13
ܥଶ ܪସ + 2ܪଶ ܱ ↔ 4ܪଶ + 2ܱܥ
∆ܪଶଽ଼
= 112݇ܬ/݈݉
( 13)
ܥଶ ܪ+ 2ܪଶ ܱ ↔ 5ܪଶ + 2ܱܥ
∆ܪଶଽ଼
= 213݇ܬ/݈݉
( 14)
଼ܪ ܥ+ 7ܪଶ ܱ ↔ 11ܪଶ + 7ܱܥ
∆ܪଶଽ଼
= 882݇ܬ/݈݉
(15)
ܱ ܪ ܥ+ 5ܪଶ ܱ ↔ 8ܪଶ + 6ܱܥ
∆ܪଶଽ଼
= 1835݇ܬ/݈݉
(16)
ܥଵ ଼ܪ+ 10ܪଶ ܱ ↔ 14ܪଶ + 10ܱܥ
∆ܪଶଽ଼
= 1178݇ܬ/݈݉
(17)
ܥଵ ܪଵ + 16ܪଶ ܱ ↔ 21ܪଶ + 16ܱܥ
∆ܪଶଽ଼
= 652݇ܬ/݈݉
(18)
The reaction equilibrium constants (Keq) can be established for a chemical reaction
(aA+bB↔cC+dD) in terms of reactant and product mole fractions considering that
chemical species behave as ideal gases such as:
ܭ
ݕ ݕௗ (ାௗିି)
= ܲ
ݕ ݕ
(19)
here, y represents the mole fraction and P is the total system pressure at equilibrium. P
can be calculated from the total moles of gaseous product species at equilibrium using the
PV=nRT relationship. On the other hand, Keq can be calculated from the thermodynamic
properties (Standard Gibbs Free Energy and heat capacity) as a function of temperature:
14
ܭ
்
∆ܥ ݀ܶ
∆ܩ − ∆ܪ ∆ܪ 1 ் ∆ܥ
= exp(−(
+
+ න
݀ܶ − න
))
ܴܶ
ܴܶ
ܶ ்బ ܴ
்బ ܴ ܶ
(20)
Thus, chemical equilibrium expressions as stated in Eqs. (19) and (20) for the 9
independent reactions (3 from Eqs. (3) to (8) and 6 from Eqs ( 13) to (18)) yield a set of 9
non-linear equations.
In summary, the stoichiometric approach yields a system of twelve equations with twelve
unknowns (A1 to A12): a) nine non-linear equilibrium reaction expressions and b) three
elemental algebraic balances (Eqs. (10)-(12)). These set of equations can be solved using
the Newton-Raphson method in MATLAB.
3.2
Non-Stoichiometric Approach
As an alternative to the stoichiometric equilibrium model, one can consider a nonstoichiometric thermodynamic model using Aspen Plus. RGibbs module in Aspen Plus is
capable of direct minimization of total Gibbs free energy of a chemical system. Biomass
surrogate species (such as glucose and 2-methoxy-4-methylphenol) are available as
conventional components in Aspen Plus. Furthermore, biomass can be defined as a
nonconventional component and its properties can be estimated by incorporating both
proximate and ultimate analysis into Aspen Plus. In addition, char can be represented as
solid carbon. In this study, biomass gasification in the CREC Riser Simulator was
simulated using RYield and RGibbs modules in Aspen Plus. The RYield Reactor was
15
employed to break down the biomass into its constituent elements/molecules. Then, these
elements/molecules were fed to the RGibbs Reactor along with the gasifying agent
(steam). All the experimentally observed compounds (permanent gases, carbon,
hydrocarbons, and tar compounds) were specified as gasification products. Following
these steps, equilibrium product compositions were calculated as a function of
temperature, steam/biomass ratio and pressure by solving the RGibbs Reaction Module.
Compositions of chemical species at chemical equilibrium depend on system total
pressure. Gasification experiments were conducted in a CREC Riser Simulator which is a
constant volume well mixed batch reactor. The total pressure in a constant volume batch
reactor depends on the total moles of gas produced. Therefore, it is necessary to
incorporate the pressure rise due to the gasification in a RGibbs reactor for a meaningful
comparison of equilibrium and experimental results. To simulate the constant volume
batch CREC Riser Simulator, an optimization function was incorporated into the
continuous flow RGibbs reactor. The optimization function established the equilibrium
pressure in the RGibbs reactor by minimizing the difference between the reactor pressure
and the pressure of the equilibrium product stream in the CREC Riser Simulator (i.e.
minimization of ܲ − ݊ ்ா ܴܶ/ܸ; where ݊ ்ா is the total moles of products at equilibrium).
16
1
1
Stoichiometric Approach
Stoichiometric Approach
a) Glucose Gasification
0.8
0.6
H2
0.4
CO
CO2
0.2
CH4
0
b) 2-methoxy-4-methylphenol
gasification
0.8
0.6
H2
CO
CO2
CH4
coke
0.4
0.2
0
0
0.2
0.4
0.6
0.8
Non -Stoichiometric Approach
1
0
0.2
0.4
0.6
0.8
1
Non -Stoichiometric Approach
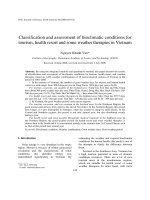
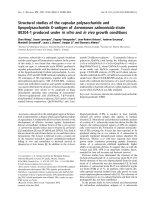
Figure 2: Comparison of equilibrium product compositions obtained using stoichiometric
and non-stoichiometric approaches: a) glucose gasification and b) 2-methoxy-4methylphenol gasification [temperature = 550 – 700 °C and Steam/Biomass = 0.4 – 1.5
g/g].
Chemical equilibrium predictions may also depend on the property method used to
calculate thermodynamic properties. In this respect, a number of equation-of-state (EOS)
and activity coefficient methods (such as IDEAL, Peng-Robinson (PR), Soave-RedlichKwong (SRK), Wilson, NRTL, UNIQUAC and there variations) were investigated in this
study. The variation in equilibrium product compositions remained in all cases below
0.5%. These result confirmed that the gas phase product species remain close to the ideal
state, under the temperatures and the pressure conditions investigated. Furthermore,
similar results were obtained by using both the stoichiometric and the non-stoichiometric
models as shown in Figure 2. The average difference between stoichiometric and non-
17
stoichiometric equilibrium predictions are 1.7% and 2.9% for glucose and 2-methoxy-4methylphenol gasification, respectively. These small variations were attributed to the
slight difference in thermodynamic properties used. One should notice as well, that the
concentrations of the other hydrocarbons and tars, as predicted by thermodynamics,
remain below 10-6 mol%, in all cases. Similar findings were also reported for biomass
gasification using air and/or steam [19,20,23,45,46].
4.0
Results and Discussions
Gasification performance was evaluated in terms of a) Carbon conversion to permanent
gases, b) Dry gas yield (moles of H2, CO, CO2, H2O, and CH4 produced/moles of glucose
fed), c) Product compositions, d) Coke deposition, and d) Tar yields. Aromatics and
oxygenates of C6+ structure in the produced gas were considered as tars. The
experimental results were also compared with thermodynamic equilibrium data.
4.1
Steam Gasification of Glucose
Thermal and catalytic steam gasification of glucose (a cellulose surrogate) was performed
by varying the gasification temperatures, steam/biomass (S/B) ratios and reaction.
Gasification results are also compared with our previous study [42]. A Ni/La2O3-γ-Al2O3
catalyst of comparable formulation was employed for steam gasification of glucose in the
previous study. The present catalyst (HF) is an improvement over the previous one in two
aspects. Firstly, the γ-Al2O3 support used in catalyst HF (Sasol Catalox® SSCa5/200)
18
exhibited much improved thermal stability and textural properties than the γ-Al2O3 used
in our previous work (Alcan AA-100 Powder) [40]. Secondly, the HF catalyst is prepared
by tuning the gas flow rate during catalyst reduction [41]. This yielded a catalyst with an
improved surface area (166 m2/g), Ni dispersion (4.52%) and acid-base properties.
4.1.1 Effect of Temperature
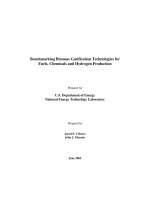
Figure 3 reports the changes in equilibrium, experimental dry gas yield and carbon
conversion obtained during glucose gasification at various temperatures. Similar to our
previous work [42], both the dry gas yield and the carbon conversion increase with
temperature as steam and dry reforming of hydrocarbons, char gasification and
Boudouard reactions are favored. However, as shown in Figure 3, glucose gasification
using the catalyst HF performs much closer to the thermodynamic equilibrium
predictions than the previous study. In fact, the use of catalyst HF increased the dry gas
yield and carbon conversion on average by 35% and 18%, respectively, over the noncatalytic glucose gasification. In case of our previous study [42], the improvements over
non-catalytic glucose gasification were only 20% and 12.5%, respectively.
19
12
Non-catalytic
Data from ref [42]
Catalyst HF
100
C-Conversion (%)
Dry gas yield (mol/mol biomass)
15
9
6
(b)
90
80
Non-catalytic
Data from ref [42]
Catalyst HF
70
(a)
60
550
600
650
ο
Temperature ( C)
700
550
600
650
700
ο
Temperature ( C)
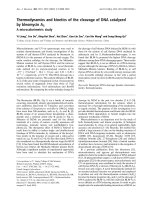
Figure 3: Profiles of (a) dry gas yield and (b) carbon conversion, with temperature during
non-catalytic and catalytic steam gasification of glucose. Lines represent the
corresponding equilibrium data. [S/B = 1.0 g/g; Cat/B = 12.5 g/g; 20 s reaction time]
Figure 4 reports the dry basis compositions of the synthesis gas produced during glucose
gasification using catalyst HF at various temperatures. As shown in Figure 4, changes in
H2, CO, CO2 and CH4 compositions with temperature are in agreement with the
thermodynamic equilibrium predictions. However, to some extent, the thermodynamic
data overpredicts H2 and CO2, and underpredict CO and CH4. This limited deviation
between experimental and predicted results is mainly due to the relatively short reaction
time (20s). In this regard, experimental results with the variation of reaction times at 650
°C are reported in Figure 5. One can notice that, when the reaction time is increased from
10 to 30 s, the composition of permanent gases approach thermodynamic equilibrium.
20
0.6
(a)
0.5
0.4
Catalyst HF
Data from ref [42]
Non-catalytic
0.3
600
650
CO Mole Fraction
H2 Mole Fraction
0.35
(b)
0.25
0.15
0.05
700
600
Temperature (οC)
700
ο
0.35
0.25
(d)
(c)
CH4 Mole Fraction
CO2 Mole Fraction
650
Temperature ( C)
0.25
0.15
0.20
0.15
0.10
0.05
0.05
0.00
600
650
700
ο
Temperature ( C)
600
650
700
ο
Temperature ( C)
Figure 4: Profiles of product gas compositions (dry basis) with Temperature: (a) H2, (b)
CO, (c) CO2 and (d) CH4; from non-catalytic and catalytic steam gasification of glucose.
Lines represent the corresponding equilibrium data. [S/B = 1.0 g/g; Cat/B = 12.5 g/g; 20 s
reaction time].
21
0.6
(a)
(b)
CO Mole Fraction
H2 Mole Fraction
0. 35
0.5
0.4
Catalyst HF
Data from ref [42]
0.3
0. 25
0. 15
0. 05
5
10
15
20
25
30
35
5
10
0. 35
20
25
30
35
30
35
0. 20
(c)
(d)
CH4 Mole Fraction
CO2 Mole Fraction
15
Reaction time (s)
Reaction time (s)
0. 25
0. 15
0. 05
0. 15
0. 10
0. 05
0. 00
5
10
15
20
25
Reaction time (s)
30
35
5
10
15
20
25
Reaction time (s)
Figure 5: Profiles of product gas compositions (dry basis) with reaction time: (a) H2, (b)
CO, (c) CO2 and (d) CH4; from steam gasification of glucose. Lines represent the
corresponding equilibrium data. [Temperature = 650 °C; S/B = 1.0 g/g; Cat/B = 12.5
g/g].
Figure 4 and Figure 5 also show that the composition of the synthesis gas obtained in the
present study using catalyst HF, is much closer to the thermodynamic equilibrium than
the ones of our previous study [42]. The present catalyst yields higher H2 especially at the
higher thermal levels studied. For instance, compared to the previous study, H2
composition is increased from 50 to 53% for glucose gasification at 700 °C. This is
equivalent to over 1 mole of additional H2 production per mole of glucose. It is
22
considered that these favorable results are the consequence of an improved water gas
shift activity with the HF catalyst.
4.1.2 Effect of Steam/Biomass Ratio
Figure 6 reports both equilibrium and experimental dry gas yields and carbon
conversions of glucose gasification with the variation of steam/biomass ratios (S/B). It is
found that an increase in the S/B ratio improves both dry gas yields and carbon
conversions as water-gas shift, char gasification and steam reforming reaction are
promoted. In fact, when the S/B ratio is increased from 0.4 to 1.0 g/g at a constant
temperature of 650 °C, a higher dry gas yield (9.35 to 11.7 mol/mol of glucose) and an
increased carbon conversion (82.5 to 97%) are obtained with the HF catalyst. However,
the rate of change in the dry gas yield is reduced at higher ranges of S/B ratios as the
system approaches the complete conversion of glucose to permanent gases. For instance,
by augmenting the S/B ratio from 0.4 to 0.6 g/g, the dry gas yield can be improved by
approximately 12%. On the other hand, when the S/B ratio is raised from 0.8 to 1.0 g/g,
the dry gas yield is increased by 4.1% only. One can notice that the reported trends are
consistent with our previous study [42], with dry gas and carbon conversion being closer
to equilibrium when using the HF catalyst.
23
Non-catalytic
Data from ref [42]
Catalyst HF
12
100
C-Conversion (%)
Dry gas yield (mol/mol biomass)
15
9
6
(b)
90
80
Non-catalytic
Data from ref [42]
Catalyst HF
70
(a)
60
0.2
0.4
0.6
0.8
S/B (g/g)
1.0
1.2
0.2
0.4
0.6
0.8
1.0
1.2
S/B (g/g)
Figure 6: Profiles of (a) dry gas yield and (b) carbon conversion, with S/B ratio during
non-catalytic and catalytic steam gasification of glucose. Lines represent the
corresponding equilibrium data. [Temperature = 650 °C; Cat/B = 8.75, 10, 11.25 and 12.5
g/g for S/B = 0.4, 0.6, 0.8 and 1.0 g/g, respectively; 20 s reaction time].
Figure 7 reports the dry basis compositions of glucose gasification products using catalyst
HF at various S/B ratios. A higher S/B ratio reasonably favors a higher extent of watergas-shift, steam reforming and char gasification reactions due to the presence of excess
steam. Therefore, an increase in S/B ratio provides higher H2 and CO2 yields and lower
CO and CH4 yields. Similar observations were also reported in [42]. However, the quality
of the synthesis gas produced is improved significantly in the present study, being much
closer to equilibrium. One can notice the HF catalyst produced on average 21% higher H2
(i.e. 0.8 mole of extra H2 per mole of glucose) while compared with the data in [42].
24