An investigation into heat recovery from the surface of a cyclone dust collector attached to a downdraft biomass gasifier
Bạn đang xem bản rút gọn của tài liệu. Xem và tải ngay bản đầy đủ của tài liệu tại đây (1.1 MB, 7 trang )
Applied Thermal Engineering 98 (2016) 1158–1164
Contents lists available at ScienceDirect
Applied Thermal Engineering
j o u r n a l h o m e p a g e : w w w. e l s e v i e r. c o m / l o c a t e / a p t h e r m e n g
Research Paper
An investigation into heat recovery from the surface of a cyclone dust
collector attached to a downdraft biomass gasifier
Nwabunwanne Nwokolo a,b,*, Sampson Mamphweli a, Golden Makaka b
a
b
Institute of Technology, University of Fort Hare, P/Bag X1314, Alice, 5700, South Africa
Physics Department, University of Fort Hare, P/Bag X1314, Alice, 5700, South Africa
H I G H L I G H T S
•
•
•
At a temperature of 450 °C–500 °C, hot syngas is regarded as a good heat carrier.
A significant quantity of energy (665893.07 kcal) is lost via the surface of the cyclone.
The surface temperature 150 °C–220 °C was within the low waste heat recovery temperature.
A R T I C L E
I N F O
Article history:
Received 12 September 2015
Accepted 5 January 2016
Available online 15 January 2016
Keywords:
Waste heat
Downdraft gasifier
Producer gas
Cyclone dust collector
Temperature
A B S T R A C T
The gas leaving the reactor of a downdraft biomass gasifier contains large quantities of heat energy; this
is due to the fact that the gas passes through a hot bed of charcoal before leaving the reactor. This heat
is normally wasted in the gas scrubber/cooler that cools it from between 400 °C–500 °C to ambient temperature (around 25 °C). The waste heat stream under consideration is the raw syngas that emanates
from a gasification process in a downdraft gasifier situated at Melani Village, Eastern Cape. This loss of
heat is undesirable as it impacts on the thermal efficiency of the system. This study investigates the feasibility of heat recovery from the surface of the cyclone dust collector prior to entering the gas scrubber.
It was shown that there was a downward decrease in temperature along the length of the cyclone. It is
found that the total quantity of heat contained in the gas was 665893.07 kcal, which could indicate the
viability of recovering heat from the cyclone.
© 2016 Elsevier Ltd. All rights reserved.
1. Introduction
Biomass gasification is a thermochemical process that involves
the production of gaseous fuel from carbonaceous feedstock. A wide
range of carbonaceous fuels have been used for the purpose of gasification, such as pine wood, eucalyptus wood, rice husk, wheat straw,
corn cob, sugarcane bagasse, corn stalk, poplar, hazelnut shell,
switchgrass, olive husk, coconut shell and many others [1,2]. Biomass
conversion process provides a more versatile application for the
gaseous fuel, thus increasing the efficiency of energy utilization of
biomass. Gasification when compared to combustion achieves a
better and more efficient energy production [3].
Gasification is made possible by the use of a controlled amount
of air, oxygen, steam or mixtures of two or more of these. The choice
of the gasifying agent used determines the heating value of the
gaseous product. For instance, air gasification results in a low to
medium heating value of gas (4–7 MJ/Nm3) while oxygen or steam
gasification result in medium heating value of 10–14 MJ/Nm3 [4].
* Corresponding author. Tel.: +27833433195.
E-mail address: (N. Nwokolo).
/>1359-4311/© 2016 Elsevier Ltd. All rights reserved.
Variation in the ratio of the gasifying agent to the carbonaceous feedstock, impacts on the quality of the final gaseous product. However,
other factors particularly reactor temperature also contribute to the
quality and quantity of gaseous fuel produced.
The quality of syngas produced via gasification is crucial as the
presence of impurities and undesirable products such as particulate char, tar, nitrogen oxides, and sulfur dioxides can interfere with
the downstream application of the syngas. These undesirable products are traceable to carbonaceous feedstock composition and
incomplete gasification, which stems from variation in operating
and design parameters. Some end user applications of the gaseous
fuel require a more intense gas cleaning and conditioning technique. Some of these uses range from heat and power application
such as integrated gasification combined cycle (IGCC) to production of synthesis fuels such as methanol and ethanol [5].
Development and commercialization of biomass gasification unit
is still hindered by inconsistency in quality of syngas produced. The
presence of impurities such as particulate matter and tar can cause
operational problems such as fouling, clogging, obstruction of pipes
and filters, reduction in heat exchange efficiency [6]. Particulate matter
mostly constitutes of inorganic compound, which include alkali metals
(potassium and sodium); alkaline earth metals (calcium); silica (SiO2).
N. Nwokolo et al./Applied Thermal Engineering 98 (2016) 1158–1164
In addition elements such as arsenic, selenium, antimony, zinc, and
lead are also present in particulate matter, but in trace amounts [7–9].
According to internal combustion engine, manufacturer’s particulate matter content in the syngas should be lower than 50 mg/Nm3
so as to guarantee long-life failure-free operation [10].
Secondly, tar is a complex mixture of condensable hydrocarbons, comprising single-ring to 5-ring aromatic compounds and other
oxygen-containing organic molecules. The application of the syngas
determines the tar tolerance limit; for instance, in compressors, the
allowable limit is 500 mg/Nm3 with 100 mg/Nm3 for internal combustion systems, and 5 mg/Nm3 for direct-fired industrial gas turbines
[11]. The severe operational problems induced by the presence of
impurities in syngas necessitate the need for syngas cleaning before
its end use application.
Synthesis gas stream produced from gasification can be cleaned
through a number of methods or techniques. Some of these methods
can only remove one contaminant while some others can remove
more than one contaminant in a single process such as wet scrubber. The cleaning techniques can be classified based on the process
temperature range: Hot gas cleanup (HGC) and cold gas cleanup
(CGC). Hot gas cleanup refers to the cleaning that occurring within
a temperature range of 400 °C to 1300 °C. On the other hand, cold
gas cleanup are cleanings that occur near ambient condition. Cold
gas cleaning makes use of water sprays such as wet scrubbers. Although cold gas cleaning technologies are effective, they still suffer
from energy inefficiencies and also generate waste water [5].
The aim of this study is to investigate and ascertain the possibility of recovering heat energy at the cyclone prior to the gas
entering the wet scrubber where it loses the inherent heat energy
through cooling. The temperature of the syngas is cooled at the wet
scrubber from about 400–500 °C to ambient temperature before
reaching the gas engine. As a result, a significant amount of energy
in the form of heat, which could be harnessed for other heating purposes, is lost. Harnessing the heat energy at the cyclone before the
wet scrubber will improve the thermal efficiency as well as the
overall efficiency of the gasification system. The overall aim is to
integrate a heat exchanger around the cyclone so as to recover the
waste heat from the gas and convert it to usable heat. But before
the heat exchanger integration, there is a need for baseline study
so as to determine the possible amount of energy that could be recovered from the surface of the cyclone.
The use of waste heat recovered from a biomass gasifier was examined by attaching a thermoelectric generator system (TEG) to the
surface of a catalytic reactor used for cleaning the syngas. In addition, the electrical properties of the thermoelectric generator along
side with the efficiency of the gasification system were studied. The
measured surface temperature (473 °C–633 °C) of the catalytic
reactor was high enough to serve as a heat source to the hot junction of the TEG. The power output and power density of the TEG
was found to be approximately 2.9 W–6.1 W and 91.5 W/m 2 –
193.1 W/m2, respectively. More also, a cold gas efficiency (CGE) of
76.26% was obtained [12].
Pavlas et al. [10] evaluated the utilization of waste heat using a
heat pump from a biomass gasification unit integrated with an existing boiler. The integration of a heat pump was so as to utilize the
low grade heat more effectively and efficiently. The study concluded that a significant energy savings can be achieved through
the use of heat pump. A combined heat and power system using
gas from gasification of biomass was analyzed to determine the effect
of using a different fuel than was originally designed on the thermodynamic characteristics of the system. The efficiency of heat and
electricity generated was found to depend on the type of system.
An overall efficiency of 67% taking into account the gas generator
efficiency was obtained [13].
Duan et al. [14] developed a comprehensive model using ASPEN
Plus for the energy assessment of an integrated coal gasification
1159
combined with a blast furnace slag waste heat recovery system. Blast
furnace is a by-product of an iron making process that is discharged at a high temperature of about 1500 °C–1600 °C. The optimal
temperature required to simulate the gasification reaction as well
as recover the blast furnace heat was found to be 800 °C. Guangul
et al. [15] compared the temperature profiles for gasification of oil
palm frond using high temperature air and unheated air. The temperature profile along the height of the gasifier as well as the
producer gas temperature was reported. The peak of the temperature was observed at the combustion and reduction zone as
expected.
Furthermore, a dedicated ASPEN Plus model was used by Francois et al. [16], to predict the mass and energy balance (including
pollutant emissions) of a combined heat and power (CHP) biomass
gasification plant from biomass dryer to gasifier, gas cleaning and
IC engine. A total of 10.3 MW of electricity and 13.3 MW of heat
were produced from the biomass CHP plant while utilizing about
34.4 MW of anhydrous wood [16]. Damartzis et al. [17] assessed a
small CHP biomass gasification system consisting of a fluidized bed
reactor, a gas cleaning system and internal combustion engine for
power generation. Most studies on CHP application are based on
model development and predictions, but limited study are available on the experimental application of CHP.
2. Gasification mechanism
The major chemical reactions that occur during gasification are
summarized as shown in Table 1. The heat that supports the reaction is either provided by partial oxidation of the gasified materials
or is externally supplied.
These reactions are made possible because of the high operating temperature of reactors used for gasification. Regardless of the
type of reactor used, gasification process involves four basic steps,
namely drying, pyrolysis, oxidation and reduction. Each of this
process corresponds to the different zones found in a reactor. Reactors also referred as gasifiers are majorly classified into three, fixed
bed, fluidized bed and entrained flow gasifiers. Fluidized bed and
entrained flow are mostly used for large scale or industrial application while fixed bed (conventional type) is used for small scale
applications [4].
This conventional type of gasifier consists of a bed of solid fuel
that moves down slowly during the gasification process. In fixed bed
gasifier, feedstocks are fed into the gasifier system through the top
and the oxidizing agent either goes in the same direction or opposite direction with the feedstock. They are characterized by long
residence time, low ash carry over, high carbon conversion and low
gas velocity [19]. Fixed bed is further classified into downdraft,
updraft and cross draft gasifier. Each differs in the flow direction
of feedstock and gasifying agent.
2.1. Description of gasifier system
The Johansson biomass gasifier under study is of a downdraft
type, it offers the advantage of producing a tar free gas, which
Table 1
Basic gasification reactions [18].
Reactions
Heat of reaction
Type of reaction
C + CO2 ↔ 2CO
C + H2O ↔ CO + H2
C + 2H2O ↔ CO2 + 2H2
C + 2H2 ↔ CH4
2CO + H2O ↔ CO2 + H2
CH4 + H2O ↔ CO + 3H2
CH4 + CO2 ↔ 2CO + 2H2
172.5 kJ/mol
131.3 kJ/mol
90.2 kJ/mol
−74.9 kJ/mol
−41.2 kJ/mol
−206.2 kJ/mol
247.4 kJ/mol
Boudouard
Water gas primary
Water gas secondary
Methanation
Water gas shift
Steam reforming
Dry reforming
1160
N. Nwokolo et al./Applied Thermal Engineering 98 (2016) 1158–1164
Table 2
Average gas composition of Johansson biomass gasifier system.
Barrel
Gases
CO
H2
CO2
CH4
N2
Composition (%)
22.3–24.3
22.3–22.5
10.7–9.8
1.90–2.10
42.9–41.5
makes it suitable for engine application. This system comprises of
many components that include the reactor where the solid fuel is
fed into and subsequently gasified. The other components are
collectively known as the purification unit where the syngas is
cleaned of impurities such as carbon particles and as well cooled
down to meet the gas engine quality requirement. Finally the gas
is then used to drive the generator, which generates the electricity. A typical composition of the gases produced in this system is
shown in Table 2.
The system component is depicted in Fig. 1. The cooling down
of the syngas occurs at the scrubber, where water is sprayed over
a scrubbing medium consisting of a low resistance, but porous large
surface area. This scrubbing media usually consist of a coarse or even
graded charcoal. The water used in the scrubber is recycled through
an ambient pond over a long period of time [20,21].
A significant amount of energy in the form of heat is lost at the
scrubber during the cooling of the syngas to room temperature.
Usually the gas is cooled down to improve the volumetric efficiency of the engine, but at the same time it impacts on the overall
thermal efficiency of the system. Therefore, this study seeks to investigate the quantity of heat that could be harnessed from the body
of the cyclone based on surface temperature measurement.
2.2. Cyclone separator
The cyclone is the first purification unit for the syngas after the
gas exits the reactor and before entering the scrubber. The main
purpose of the cyclone is to remove the fine carbon particles that
exit the reactor with the gas. Generally, cyclone is less prone to
explosion; hence, it offers a better advantage when compared to
Inlet Duct
Cone
Fig. 2. Schematic and pictorial view of the cyclone [22].
fabric filters in high temperature application. The schematic flow
diagram of a cyclone is shown in Fig. 2 [22].
As the raw gas exits the gasifier it enters the cyclone in a tangential manner. The tangential entry results in a spiral flow of gas
beginning at the cylindrical part of the cyclone to the conical part.
At the conical section, the clean gas reverses and exits in a straight
stream through the vortex finder, whereas the particulates collide
with the outer wall and fall to the bottom (collection chamber). About
80% of these particulates are removed when operating at full power
and this is equivalent to 4 g/Nm3. Table 3 shows the main dimensions of the cyclone.
The removal of particulates present in the syngas at the cyclone
is enhanced by centrifugal force. The cyclone performance is usually
rated in terms of particle cut diameter or cut size and is represented mathematically as follows:
⎡ 9μ W ⎤
dp50 = ⎢
⎥
⎣ 2π NVi ρp ⎦
1
2
Fig. 1. Schematic diagram of Johansson biomass downdraft gasifier.
(1)
N. Nwokolo et al./Applied Thermal Engineering 98 (2016) 1158–1164
Table 3
Main dimensions of the cyclone.
Item
Dimensions (cm)
Cyclone cylinder height
Cyclone cone height
Cyclone outside diameter
Cyclone inlet duct length
Vortex finder length
22
101
111
50
45
Where
μ = Gas viscosity (kg/ms)
W = Width of inlet duct (m)
N = Number of turns inside the cyclone
Vi = Gas inlet velocity (m/s)
ρp = Particle density (kg m3 )
1161
One thermocouple was also inserted into the inlet duct of the cyclone
through a drilled hole. The hot bed temperature of the gasifier was
also monitored by a thermocouple that was inserted at the lower
zone of the gasifier. This monitored the temperature of the gas
leaving the reduction zone of the gasifier before making its way to
the cyclone. All the thermocouples were connected to the channels of a CR1000 data logger. The data logger was powered with a
12 V external power supply. The initial temperature at the inlet duct
and surface of the cyclone were noted prior to igniting the gasifier.
The total quantity of heat that could be recovered from the syngas
was as well determined using equation 2
Q = V × ρ × Cp × ΔT
(2)
Where
This formula is predicted both for general cyclone and high efficiency cyclone, and it represents the particle size that can be
separated at 50% efficiency.
Q is the heat content in kcal
V is the flow rate of the substance in m3/hr
ρis density of the flue gas in kg/m3
Cp is the specific heat of the substance in kcal/kg °C
ΔT is the temperature difference in °C
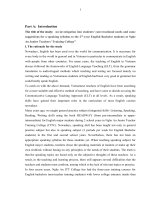
3. Temperature measurements
4. Temperature results and discussion
For the temperature measurement both contact (thermocouples) and non contact (infrared camera) temperature measuring
technique was used. The setup for the temperature measurement
is shown in Fig. 3, it comprises of thermocouples, CR1000 data logger,
external power supply and some gas sensors, but the gas sensors
were not used for the purpose of this study. Type k thermocouples were used because of its wide operating temperature range
(−270 °C to 1260 °C). It has a measuring accuracy of ±2.2°C . The two
thermocouples fitted on the body of the cyclone were 50 cm apart.
Four thermocouples were used in all; the third thermocouple
was inserted at the reduction zone of the gasifier and the fourth
to the inlet duct of the cyclone. The entire measurement was conducted outside at the location of the biomass gasification system.
Effect of ambient temperature was not considered in the surface temperature measurement. The surface temperature of the cyclone was
as well measured with FLIR thermaCAM (infrared camera) with a
temperature range of −20 °C to 250 °C and an accuracy of ±2°C . FLIR
thermaCAM (infrared camera) is a non contact instrument that can
visualize the temperature distribution of a surface.
The gasifier was loaded with chunks of pine wood sourced from
a nearby sawmill. The pine wood chips varied in sizes owing to the
fact that they were off cuts. Before the ignition of the gasifier two
thermocouples were fitted at two different heights on the surface
of the cyclone. This was done so as to determine if there are temperature variations between the bottom and top part of the cyclone.
In assessing the potential of recovering heat from any system,
one of the parameters of significance is temperature. The magnitude of the temperature difference between the heat source and
heat sink determines the quality of heat to be recovered. Recovering heat from the cyclone section of the Johansson biomass
gasification system will improve the system from a standalone power
system to a combined heat and power system. Combined heat and
power systems based on gasification are valuable to sawmills and
wood processing industry. In this study the heat source is the hot
syngas stream and the aim is to recover the heat from the surface
of the cyclone prior to the gas entering the scrubber. Fig. 4 presents the inlet gas temperature profile and cyclone surface
temperature profile.
Prior to starting of the gasifier system the temperature of the
gas entering the cyclone (Tin) and cyclone surface temperatures (TSL
and TSU) were 18.79 °C, 22.59 °C and 21.31 °C, respectively. After
the ignition of the gasifier the temperature of the gas entering the
cyclone was the first to show an increase while the two surface temperatures followed after 5 minutes. A maximum temperature of
608.8 °C was obtained from the syngas stream as it exits the
500
TSL
450
TSU
Tin
400
Thermocouple
Wires
350
Temperature (C)
Infrared
Camera
300
250
200
150
External Power
supply
100
50
Data Logger
Fig. 3. Temperature measurement setup [23].
0
0
20
40
60
Time (min)
80
100
120
Fig. 4. Gas inlet and cyclone surface temperature profile within the first 120 mins.
N. Nwokolo et al./Applied Thermal Engineering 98 (2016) 1158–1164
reduction zone of the gasifier. Guangul et al. [15] obtained a similar
temperature profile for gas outlet temperature, the temperature increased from about 50 °C to a maximum of 600 °C. In addition, the
obtained gas temperature of 608.8 °C did not differ much from the
temperature range (623 °C–700 °C) obtained by Balas et al. [3]. This
was the temperature range within which Balas et al. [3] obtained
the individual gas components: H2, CO2, CH4, N2, CO.
As the gas stream approached the cyclone inlet duct, a decrease in temperature was observed. This is as a result of the
utilization of some of the sensible heat of the syngas in heating the
air entering the gasifier through an internal heat exchanger. Hence,
there is no waste of heat in this regard. There were fluctuations in
the temperature profiles, particularly the temperature of the gas entering the cyclone within the first 120 mins of operation. Similarly
the gas outlet temperature profile obtained by Guangul et al. [15]
showed some fluctuation as it was increasing. This is also in agreement with the different zone temperature profile reported by
Mamphweli and Meyer [23]. Afterwards, some stability was recorded as shown in Fig. 5.
The percentage difference between the temperature of the gas
entering the cyclone and the surface temperature of the cyclone
showed that above 65% of heat in the gas is transferred to the wall
of the cyclone. This implies that about 65% of the energy entering
the cyclone is currently lost and this is waste heat available for conversion to useful energy. From Fig. 5, the gas temperature was
observed within a temperature range of 450 °C–500 °C while the
two surface temperatures ranged from about 150 °C–220 °C.
Comparing this result with that reported by Ma et al. [12] in
which the temperature of the gasifier outlet is about 350 °C–
500 °C and surface temperature of the catalytic reactor is
approximately 200 °C–360 °C. The two gas temperatures compared very closely. The difference is that the heat recovery in Ma
et al. [12] study occurred at the catalytic reactor while in the current
study, the heat recovery is intended to take place at the cyclone.
However, there are some similarities in terms of the position of the
heat recovery unit, in both cases heat is recovered from the gas before
entering the wet scrubber. For maximum heat recovery to occur,
the position of the heat recovery unit is important as well as the
choice of the heat recovery equipment.
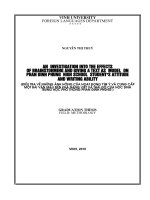
In addition, the surface temperature at the upper part of the
cyclone was found to be higher than the surface temperature at the
lower part of the cyclone. This indicates that there was a downward decrease of temperature along the surface of the cyclone as
shown in Fig. 6.
220
200
180
160
Temperature (C)
1162
140
120
100
80
60
40
0
10
20
30
40
50
60
Length (cm)
70
80
90
100
Fig. 6. Temperature gradient along the length of the cyclone.
The temperature gradient along the length of the cyclone shown
in Fig. 6 was obtained using a FLIR thermal camera. As observed from
Fig. 6, the highest obtained temperature was around 200 °C, which
compares closely to the surface temperature result (Fig. 5) obtained using thermocouple. Fig. 6 shows that a larger part of the
decrease in temperature occurred at the lowest part of the cyclone,
which is closer to the collection chamber of the particulates. This
major decrease is represented between 59 cm and 97 cm, which corresponds to the lowest part of the cyclone. The decrease in
temperature could be attributed to more deposit of particulates at
the lower part of cyclone, thus, inhibiting the ease of heat transfer. Secondly, because the gas enters from the top of the cyclone
consequently, the upper part gets heated up first. The actual thermal
image (Thermogram) is presented in Fig. 7.
235.3°C
Upper/cylindrical part
600
TSL
550
TSU
Tin
%Diff
<50.0°C
220.2°C
500
Temperature (C)
450
Lower/conical part
400
350
300
<50.0°C
250
200
Lowest part
Fig. 7. Thermal image of the cyclone.
150
Table 4
Waste heat temperature classifications and some source examples [24].
100
50
115
120
125
130
135
140
145
Time (min)
150
155
160
165
Fig. 5. Gas inlet and cyclone surface temperature profile after the first 120 mins .
Type
Temperature range
Example source
High
Medium
Low
1650 °C–649 °C
650 °C–230 °C
232 °C and lower
Hydrogen plant, fume incinerator
Gas turbine exhaust, catalytic crackers
Welding machines, annealing furnaces
N. Nwokolo et al./Applied Thermal Engineering 98 (2016) 1158–1164
1163
Table 5
Parameters for estimation of heat quantity.
Item
H2
N2
CH4
CO
CO2
Total
Molar mass (g/mol)
% Composition of gas
Mass (g)
Specific heat capacity (kJ/kg K)
2.02
22.30 ± 0.1
2.01
14.32
28.01
42.90 ± 0.7
53.65
1.04
16.04
1.90 ± 0.1
1.36
2.22
28.01
22.30 ± 1
27.89
1.02
44.01
10.70 ± 0.4
21.02
0.84
118.09
100.1
105.93
19.44
The two images shown in Fig. 7 were taken within an interval
of one minute so the time difference was assumed to be negligible. Fig. 7 represents the thermal energy that is radiated from the
surface of the cyclone. It provided the approximate surface temperature of the cyclone. The temperature of the gas entering the
cyclone falls within the medium temperature range while the surface
temperature as detected from the thermal image is within low temperature range for waste heat recovery. Hence a heat recovery unit
such as cold water jacket that can transform low level heat into valuable use has to be integrated. Basically there are three classifications
of waste heat temperature (as shown in Table 4) for various waste
heat recovery opportunities.
One basic advantage of the medium and low temperature range
is, in its compatibility with heat exchanger materials, which is a good
motivation for the present study. It was also essential to quantify
the total heat that could be recovered from the syngas stream. Hence,
the total quantity of heat contained in the syngas was determined
using equation 2 and parameters presented in Table 5. This was found
to be 665893.07 kcal.
The volumetric flow rate of the syngas was assumed to be
300 Nm3/h based on the specifications of the gasification system.
A total gas density of 0.9734 kg/m3 was determined from the molar
mass, mass percentage composition of gases presented in Table 5.
The specific heat capacity (at constant pressure) presented in Table 5
was converted to kcal/kg °C for consistency in units. The initial temperature of 18.79 °C was subtracted from the maximum temperature
attained by the gas entering the cyclone to obtain the temperature difference. The estimated quantity of heat would inform on the
best heat recovery method to adopt. Some typical heat recovery
methods include water heating, combustion air preheating, steam
generation, feed water preheating and transfer to a low temperature process [24].
5. Conclusion
The present investigation was conducted so as to determine a
practical and economic method of utilizing the heat of the syngas
that is otherwise lost through the surface of the cyclone and in the
scrubber. This paper presented the preliminary results, which include
the temperature profiles of the gas entering the cyclone and cyclone
surface temperature. The gas temperature was found to be within
a temperature range of 450 °C–500 °C while the two surface temperatures ranged from about 150 °C to 220 °C. At a temperature of
450 °C–500 °C, the hot syngas is regarded as a good heat carrier. A
greater percentage of this heat can be recovered at the cyclone and
used for water heating. This will be achieved with integration of
cold water jacket around the cyclone. The study has established that
a significant quantity of energy (665893.07 kcal) is lost through the
surface of the cyclone. Hence, there is a huge potential of waste heat
recovery for the Johansson biomass gasification system. The biomass
gasification system is located close to a saw mill industry, hence the
waste heat can also be channeled for timber drying and steaming.
Finally, to justify the need for waste heat recovery at any application, there should be some valuable use for the heat recovered and
the cost of recovering should not outweigh the heat recovered.
Acknowledgement
The authors would like to acknowledge ESKOM, South African
Clean Energy Solutions limited and Govan Mbeki Research and Development Centre at the University of Fort Hare for funding.
Nomenclature
Abbreviation
IGCC
Integrated gasification combined cycle
HGC
Hot gas cleanup
CGC
Cold gas cleanup
TEG
Thermoelectric generator system
CHP
Combined heat and power
CGE
Cold gas efficiency
Chemical formula
SiO2
Silica
C
Carbon
CO
Carbon monoxide
Carbon dioxide
CO2
CH4
Methane
hydrogen
H2
N2
Nitrogen
Steam
H2O
References
[1] A. Demirbas, Combustion characteristics of different biomass fuels, Prog. Energy
Combust. Sci. 30 (2004) 219–230.
[2] P. Mondal, G.S. Dang, M.O. Garg, Syngas production through gasification and
cleanup for downstream applications – recent developments, Fuel Process.
Technol. 92 (2011) 1395–1410.
[3] M. Balas, M. Lisy, O. Stelcl, The effect of temperature on the gasification process,
Acta Polytech. 52 (2012) 4.
[4] T. Damartzis, A. Zabaniotou, Thermochemical conversion of biomass to second
generation biofuels through integrated process design – a review, Renew.
Sustain. Energy Rev. 15 (2011) 366–378.
[5] P.J. Woolcock, P.J. Brown, A review of cleaning technologies for biomass-derived
syngas, Biomass Bioenergy 52 (2013) 54–84.
[6] B. de Caprariis, M. Scarsella, A. Petrullo, P. De Filippis, Olive oil residue
gasification and syngas integrated clean up system, Fuel 158 (2015) 705–
710.
[7] K. Szemmelveisz, I. Szucs, Á.B. Palotás, L. Winkler, E.G. Eddings, Examination
of the combustion conditions of herbaceous biomass, Fuel Process. Technol.
90 (6) (2009) 839–847.
[8] E. Gustafsson, M. Strand, M. Sanati, Physical and Chemical characterization of
aerosol particles formed during the thermochemical conversion of wood pellets
using a bubbling fluidized bed gasifier, Energy Fuel 21 (6) (2007) 3660–
3667.
[9] A.T. Atimtay, Cleaner energy production with integrated gasification combined
cycle systems and use of metal oxide sorbent for H2S cleanup from coal gas,
Clean Technol. Environ. Policy 2 (4) (2001) 197–208.
[10] M. Pavlas, P. Stehlík, J. Oral, J. Klemeš, J.-K. Kim, B. Firth, Heat integrated heat
pumping for biomass gasification processing, Appl. Therm. Eng. 30 (2010) 30–
35.
[11] P. De Filippis, M. Scarsellaa, B. de Caprariisa, R. Uccellari, Biomass gasification
plant and syngas clean-up system, Energy Procedia 75 (2015) 240–245.
[12] H.-K. Ma, C.-P. Lin, H.-P. Wu, C.-H. Peng, C.-C. Hsu, Waste heat recovery using
a thermoelectric power generation system in a biomass gasifier, Appl. Therm.
Eng. 88 (2015) 274–279.
[13] A. Skorek-Osikowska, L. Bartela, J. Kotowicz, A. Sobolewski, T. Iluk, L. Remiorz,
The influence of the size of the CHP (combined heat and power) system
1164
[14]
[15]
[16]
[17]
N. Nwokolo et al./Applied Thermal Engineering 98 (2016) 1158–1164
integrated with a biomass fueled gas generator and piston engine on the
thermodynamic and economic effectiveness of electricity and heat generation,
Energy 67 (2014) 328–340.
W. Duan, Q. Yu, K. Wang, Q. Qin, L. Hou, X. Yao, et al., ASPEN Plus simulation
of coal integrated gasification combined blast furnace slag waste heat recovery
system, Energy Convers. Manag. 100 (2015) 30–36.
F.M. Guangul, S.A. Sulaiman, A. Ramli, Temperature profile and producer gas
composition of high temperature air gasification of oil palm fronds, 4th
International Conference on Energy and Environment 2013, Earth and
Environmental Science 16, 012067, 2013.
J. Francois, L. Abdelouahed, G. Mauviel, F. Patisson, O. Mirgaux, C. Rogaume,
et al., Detailed process modeling of a wood gasification combined heat and
power plant, Biomass Bioenergy 51 (2013) 68–82.
T. Damartzis, S. Michailos, A. Zabaniotou, Energetic assessment of a combined
heat and power integrated biomass gasification–internal combustion engine
system by using Aspen Plus®, Fuel Process. Technol. 95 (2012) 37–44.
[18] L. Emami Taba, M. Faisal Irfan, W.A.M. Wan Daud, M. Harun Chakrabarti, The
effect of temperature on various parameters in coal, biomass and co-gasification:
a review, Renew. Sustain. Energy Rev. 16 (2012) 5584–5596.
[19] M. Puig-Arnavat, C.J. Bruno, A. Coronas, Review and analysis of biomass
gasification models, Renew. Sustain. Energy Rev. 14 (2010) 2841–2851.
[20] K.G. Johansson, System Johaansson gas producers: General description and
operator’s instructions, Midrand, South Africa, Unpublished Manual, 2002.
[21] N.S. Mamphweli, E.L. Meyer, Component and Operation of the Fixed Bed
Downdraft System Johansson Biomass Gasifier, Nova Science Publisher, 2012.
ISBN: 978-1-61209-681-0.
[22] L. Wang, Theoretical study of cyclone design, (Ph.D. thesis), Texas A&M
University, 2004.
[23] N.S. Mamphweli, E.L. Meyer, Performance monitoring system for a biomass
gasifier, J. Eng. Design Technol. 11 (1) (2013) 7–18.
[24] United State Department of Energy, Waste Heat Recovery: Technology and
Opportunities in U.S. Industry, BCS, Incorporated, 2008.