A 65 nm CMOS ultra low power impulse radio ultra wideband emitter for short range indoor localization pdf
Bạn đang xem bản rút gọn của tài liệu. Xem và tải ngay bản đầy đủ của tài liệu tại đây (5.15 MB, 10 trang )
Copyright © 2015 American Scientific Publishers
All rights reserved
Printed in the United States of America
Journal of
Low Power Electronics
Vol. 11, 349–358, 2015
A 65 nm CMOS Ultra-Low-Power Impulse
Radio-Ultra-Wideband Emitter for
Short-Range Indoor Localization
Mohamad Al Kadi Jazairli∗ and Denis Flandre
ICTEAM Institute, Université Catholique de Louvain, Louvain-la-Neuve, 1348, Belgium
(Received: 14 April 2015; Accepted: 15 July 2015)
This paper presents an ultra-low-power IR-UWB pulse generator based on a dedicated design of a
chain comprising of a voltage controlled ring oscillator, a buffer and a pulse shaping filter. A control
voltage can be used to set the pulse repetition frequency. The design was made using 65 nm CMOS
technology. The design was optimized in order to meet target specifications (pulse width, repetition
frequency, PSD, etc.) that are suitable for short-range indoor localization. The generator produces
a pulse having 0.5 ns width and 930 mV peak-to-peak amplitude prior to the antenna. The −10 dB
bandwidth is from 1 to 7 GHz with an amplitude less than −40 dBm/MHz which makes it compliant
with the FCC spectral mask. The energy consumption is 1.5 pJ per pulse while the energy driven
to the antenna is 60 to 65% of the total energy consumed by the circuit per pulse. According to the
state-of-the-art, this is the minimum consumption that we were able to achieve.
Delivered
Ingenta
unknownTransmitter,
Copyright:UWB.
Keywords: Impulse Radio,
Low by
Power,
Pulseto:
Generator,
American Scientific Publishers
1. INTRODUCTION
Ultra-Wideband (UWB) technology appears very promising for radio communication and localization. UWB signals have a very wide bandwidth with allocated frequency
spectrum from 3.1 GHz to 10.6 GHz and with a maximum emitted power being restricted to −41 dBm/MHz
in compliance with the Federal Communications Commission (FCC).1 Energy can be spread over a very wide
bandwidth to very low levels allowing UWB radios and
narrowband broadcasters to share the spectrum without
causing undesirable interference; this in turn generates
numerous interesting and novel application opportunities. These characteristics of UWB implementations are
of utmost interests for low-cost, short-range sensors
and smart devices with ultra low power consumption.
Another advantage of the low power transmitter is the
size reduction of the transmitted antenna which allows
a single die transmitter to be implemented in an area
of 4 mm2 .2
In this work, one of our objectives is to design an
extremely low power CMOS-integrated pulse generator
for short-range indoor localization. In order to achieve
this, we considered the common form of UWB that is
∗
Author to whom correspondence should be addressed.
Email:
J. Low Power Electron. 2015, Vol. 11, No. 3
called IR (Impulse Radio) which employs sub-nanosecond
pulses without a carrier signal. The transmitter can be used
in both pulse-amplitude modulation (PAM) and pulseposition modulation (PPM).
Several IR-UWB circuits have been proposed in the literature. To produce the UWB output pulse, some papers
used the LC topology3–5 while others used the ring oscillator topology.6 7 Those who used the LC topology managed to produce a sub-nanosecond pulse (∼0.5 ns) but
in expense of high consumption of energy per pulse
(> 4 pJ/pulse). While those who used the ring oscillator topology managed to consume less energy per pulse
(< 5 pJ/pulse) but failed to produce a sub-nanosecond
pulse. Here our target was to reach sub-nanosecond pulse
with an energy consumption of less than 1 pJ/pulse.
Other implementations details will be compared in a later
sections.
We have expanded the Voltage Control Ring Oscillator (VCRO) circuit architecture presented in Ref. [8].
In Ref. [8], 0.5 m SOS technology was used to produce
a single pulse with 800 ps width but without taking into
consideration the exact UWB requirements on the pulse
shape. Here by porting this VCRO to 65 nm CMOS and
introducing a proper design of buffer and pulse shaper,
along with the right element sizes and filter shaping circuit, we can generate a pulse shape with a Power Spectral
1546-1998/2015/11/349/010
doi:10.1166/jolpe.2015.1393
349
A 65 nm CMOS Ultra-Low-Power IR-UWB Emitter for Short-Range Indoor Localization
0
VCCB
VCCA
P2
C1
P3
2
3
M0
Ca
4
1
1
n1
n2
Normalized FCC mask
Cb
RL
RL
L
n3
V control
VCRO
Pulse
Shaping
Filter
Buffer
Antenna
S21 (dB)
P1
Jazairli and Flandre
Pulse
Shaping
Filter
–20
Normalized transfer response
of the pulse shaping filter
Antenna
–40
Fig. 1. Proposed UWB pulse generator.
0
2
4
6
8
10
Frequency (GHz)
Fig. 3. Implementation and frequency response of the pulse shaping
1.2
V1(V)
Output voltage (V)
Density (PSD) which complies with the FCC mask. One of
filter.
the most important issues addressed in the design has been
achieving ultra low power consumption while maintaining
2. REQUIRED PULSE SPECIFICATIONS
the same quality of the pulse shape and its corresponding
FOR LOCALIZATION
PSD for usual variations of process, supply voltage and
In
a
localization application, several requirements have
temperature (PVT).
to
be
set in order to achieve an optimized UWB pulse
This paper consists of several sections. Section 2
9 10
generator.
The shape of the IR-UWB pulse plays a
addresses the required UWB pulse specification as well
major
role
in
determining
the quality of the pulse generas the evaluation of the minimum transmitted energy
ator.
According
to
Ref.
[10],
the IR-UWB pulse must be
per pulse that a generator should produce in order to
a
monocycle
pulse
with
a
very
short pulse width (shorter
allow detection by the receiver for short-range localizathan 1 ns) to target a cm precision. By applying the monotion applications. Section 3 describes the proposed UWB
cycle pulse directly to an UWB transmit antenna, it is
pulse generator. Section 4 gives a detailed explanation
transformed into a Gaussian-like pulse. This Gaussian-like
of the VCRO analysis. In Section 5, the results obtained
pulse is vital for fitting the PSD inside the regulation of
from the simulations and measurements are interpreted.
theto:
FCC
mask. Another factor that should be taken into
Delivered
by Ingenta
unknown
Section 6, presents the experimental result
of transmitconsideration is the rate of the pulse repetition frequency
ting train of pulses. Section 7 investigates the effect of
Copyright: American Scientific
Publishers
(PRF), which
has to be in the range of 1 to 500 MHz,
PVT variations and subsequent calibrations on the pulse
this values of the PRF guarantees the possibility for each
generator.
TX-RX pair to unambiguously distinguish between scattered pulses and direct lign-of-sight (LOS) pulses for any
target position within the area and any nodes location.11
1.2
Finally, for the power consumption issue, according to
Refs. [12, 13], we can consider a low SNR of −10 dB
that is still sufficient for good localization design. The
dependency on the pulse shape and the SNR is extensively
0
studied in Refs. [14 and 15].
To generate a pulse with minimal power consumption,
1.2
first we have to determine the minimum Energy per pulse
that could be transmitted in an indoor area and detected
0
0
V4-V3(V)
0
470 mV
400 ps
0
1
2
3
4
Time (ns)
Fig. 2. Simulated pulse shape at the output of VCRO (upper curve), at
the output of buffer (middle curve) and at the 50
antenna resistance
(lower curve).
350
φ2
0
φ1
–1.2
0
1
2
3
4
Time (ns)
Fig. 4. Typical voltage versus time plots of the VCRO (Fig. 1) node (1)
(upper curve) and voltage difference between nodes (3) and (4) versus
time (lower curve).
J. Low Power Electron. 11, 349–358, 2015
Jazairli and Flandre
A 65 nm CMOS Ultra-Low-Power IR-UWB Emitter for Short-Range Indoor Localization
Table I. Transistor sizes and threshold voltages for each component in
the VCRO shown in Figure 1.
Inverters 1 and 2
Inverter 3
n-MOS:
W = 0.12 m
L = 0.1 m
Vt = High
W = 0.36 m
L = 0.1 m
Vt = Low
p-MOS:
W = 0.54 m
L = 0.1 m
Vt = Low
W = 0.12 m
L = 0.1 m
Vt = High
Fig. 5. The voltages at different interval nodes of the VCRO (Fig. 1)
and the current flow in both phase 1 (a) and phase 2 (b) of Figure 4.
by the receiver. This can be done calculating the transmitted energy while taking into consideration several terms
such as the path loss between the transmitter and receiver,
Signal to Noise Ratio (SNR) and the level of noise floor.
From standard telecommunication theory, the received
energy can be basically defined by the following equation:
Er =
Et
PL
(1)
where Er is the received Energy, Et is the transmitted
energy and PL is the path loss that can be determined by
the following equation for line-of-sight path:
PL =
4 · d · fc
c
2
(2)
p-MOS M0
C1
5 fF
W = 0.8 m
L = 0.1 m
Vt = Low
pulse has been calculated using Eqs. (1) and (3) while
maintaining the worst case value of path loss (i.e., for 10 m
and N0 /2 = 10−19 W/Hz.14 15 ). The minimum Et was found
to be 0.48 pJ for SNR = 0 dB and 4.8 pJ for SNR = 10 dB.
For a short-range indoor application with a 5 m distance,
the minimum Et is 0.11 pJ at SNR = 0 dB and 1.1 pJ at
SNR = 10 dB.
These values of the transmitted energy per pulse should
be taken into consideration when implementing a very low
power pulse generator, since at lower values there is a high
probability of losing the transmitted signal.
3. PROPOSED UWB PULSE GENERATOR
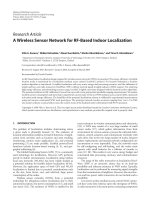
Figure 1 depicts the proposed UWB pulse generator. It
consists of a voltage controlled ring oscillator (VCRO),
cenwhere d is the transmitter receiver distance,
fc is theby
a buffer
and a pulse shaping filter.
Delivered
Ingenta
to: unknown
tral frequency and c is the speed of light.
Copyright:
American
Publishers
GHz (as shown
in Scientific
Using the central frequency fc = 4 75
3.1. Voltage
Control Ring Oscillator VCRO
Section 4), the path loss has been calculated using Eq. (2)
In order to achieve a low-power, low-complexity and
to be 45.8 dB for 1 m distance and 65.8 dB for 10 m
tunable VCRO, we considered the VCRO configuration
distance between the transmitter and the receiver.
shown in Figure 1. The basis of the VCRO is an impulse
The SNR can be determined from the following
oscillator consisting of three CMOS inverter stages.8 16
equation:
A capacitor C1 and a p-MOS transistor M0 are inserted
Er
(3)
SNR =
before the last stage as shown in Figure 1 so as to define
N0 /2
the pulse width and the delay between two consecutive
where N0 is the noise spectral density in Watts per Hertz.
pulses. The way how C1 and M0 control these paramSeveral values of SNR have been considered and for
eters is explained in Section 4. The gate voltage of M0
each of these values, the minimum transmitted energy per
(Vcontrol) is used to control the repetition frequency of
the pulse generator. To guarantee minimum pulse width,
the last inverter is designed to have a fast switching transiInverter 3
Inverter 1&2
tion from High-to-Low as compared to the first and second
1.2
450 µm
Vout (V)
1
0.8
100 µm
0.6
0.4
0.2
35 µm
0
0
0.2
0.4
0.6
0.8
1
1.2
Vin (v)
Fig. 6.
Inverter DC characteristics (switching curve) for VCCA = 1.2 V.
J. Low Power Electron. 11, 349–358, 2015
30 µm
Fig. 7.
Fabricated UWB pulse generator.
351
A 65 nm CMOS Ultra-Low-Power IR-UWB Emitter for Short-Range Indoor Localization
Amplitude [dBm/MHz]
1000 mV
930 mV
Jazairli and Flandre
–40
–60
0
2
4
6
8
10
Frequency (GHz)
400 ps
500 ps
(a)
Fig. 10. Simulated power spectral density (PSD) of the output pulse.
(b)
Fig. 8. Pulse shape at the output of the buffer. (a) Measured and
(b) Simulated.
inverters. Furthermore, the pulse width will be reduced by
scaling CMOS technology. A typical waveform at the output of the VCRO is shown in Figure 2 (upper curve).
as shown in Figure 1. The inverters here do not only isolate
the VCRO from the high load of the pulse shaping filter
but also provide current driving capability for the pulsed
oscillator. The first and second inverters in the buffer play a
major role in the determination of the pulse width. Adding
a middle p-MOS transistor in the second inverter as in
Ref. [18] provides a fast switching transition from Highto-Low as compared to the first inverter in the buffer which
reduces the minimum pulse width as shown in Figure 2
(middle curve). The supply voltage VCCB can be further
used as a pulse output enable signal.
FCC Mask
0
–20
–40
–60
800
Measured PW
600
400
Simulated PRF
Measured PRF
400
380
Simulated PW
200
0
100
420
360
150
200
250
300
Pulse Width PW (ps)
Pulse Repetition Frequency PRF
(MHz)
Amplitude [dBm/MHz]
3.2. Pulse Shaping Filter
As mentioned in Section 2, a proper filtering is required in
order to obtain a Gaussian–like pulse at the output antenna
so as to make it compliant with the FCC spectral mask.
4. VCRO ANALYSIS AND DESIGN
Figure 3 shows the normalized frequency response of the
For design optimization purposes, we need to understand
Delivered
by Ingenta to: unknown
pulse shaping filter and the normalized FCC
spectral mask
the operation scheme of the VCRO and how the capaci17
for indoor UWB devices. In our simulators, the values
tor C1 and
the transistor M0 affect the time delay of the
Copyright:
American
Scientific
Publishers
of the capacitors Ca = 0.25 pF, Cb = 0.15 pF and inducoutput signal.19 We divide the timing of one pulse into
tor L = 2.5 nH are optimized to produce the Gaussian-like
two phases 1 and 2, as shown in Figure 4. Also, since
waveforms shown in Figure 2 (lower curve). It is worth
nodes number (3) and (4) in Figure 1 are essential nodes
mentioning that a pulse shaping circuit can also be implewhere the charging and discharging of the capacitor take
mented within the UWB transmit antenna and thanks to
place, we plot the difference of these voltages along with
the low-pass filtering effect the generated pulse will be
the output voltage versus time in Figure 4. It is worthwhile
shaped by the antenna frequency response. Therefore, in
noting that phase 1 ( 1) represents the case where V3 is
the experimental part of this work, we considered using
higher than V4 and hence V3 is the source of the transisthe pulse shaping filter built-in inside the antenna instead
tor M0, and phase 2 ( 2) represents the case where V4
of adding a separate pulse shaping filter.
is higher than V3 and hence V4 becomes the source of
transistor M0 as depicted in Figure 5.
3.3. Buffer
To ensure that enough current is fed into the capacitors and
inductor of the pulse shaping filter, the buffer is designed
340
350
Vcontrol (mV)
0
5
10
Frequency (GHz)
Fig. 9. Measured power spectral density (PSD) of the output pulse.
352
Fig. 11. Simulated and measured pulse repetition frequency (solid
curves) and pulse width (dotted curves) as a function of Vcontrol for
VCCA = VCCB = 1.2 V.
J. Low Power Electron. 11, 349–358, 2015
A 65 nm CMOS Ultra-Low-Power IR-UWB Emitter for Short-Range Indoor Localization
VCRO power consumption
600
1.6
Buffer power consumption
Energy consumption
1.2
400
0.8
200
0.4
150
200
Impedance (Ω)
Total power consumption
0
100
(b)
2
800
Energy consumption per pulse
(pJ/Pulse)
Average Power consumption (µW)
Jazairli and Flandre
(a)
100
80
60
40
20
0
–20
–40
–60
–80
–100
0
5
10
Frequency (GHz)
control (mV)
0
250
Fig. 14. (a) UWB antenna, (b) Antenna impedance as a function of
frequency.
Vcontrol (mV)
Fig. 12. Simulation of the power consumption and energy consumption
per pulse as a function of Vcontrol for VCCA = VCCB = 1.2 V.
causing a decrease in VSD and VSG while maintaining
VSD > VSG− Vt . Thus, the saturation current decreases
Phase 1 starts with a high output voltage V1 that subtill it reaches a zero value when V4–V3 =0 which in turn
sequently yields a zero voltage at node (2) which in turn
makes the 3rd inverter switching from low to high and
gives a high voltage at node (3) equal to VCCA. Given
reinitiates 1.
that V4 from the previous period is still low due to the
The duration that transistor M0 stays in any of these two
delay introduced by M0 and C1, node (3) and node (4)
phases depends on the values of Vcontrol, of C1, and of
will be the source and the drain of the PMOS transistor
the switching thresholds between High-to-Low and LowM0 respectively. Moreover, since VSD > VSG– Vt , with
to High for the last inverter. To approach minimum pulse
VSG = VCCA − Vcontrol, and Vt the absolute value of
width, we designed the last inverter having a lower logic
the threshold voltage, this transistor operates in the satuthreshold as compared to the first and second inverters
ration region as long as V4 < Vcontrol+ Vt and its conas shown in Figure 6. Using this analysis, the threshold
trol current iD charges the capacitor C1 as shown in the
voltage (V T), the width W and the length L of the
Figure 5(a). As long as M0 is operatingDelivered
in the saturaby Ingenta
to: unknown
inverters
transistors and of M0 are chosen to optimize the
tion mode, the charging of the capacitor C1 at a constant
sizes of the inverters to get the minimum pulse width as
Publishers
current raises the voltage at node (4)Copyright:
at a steadyAmerican
rate as Scientific
shown in Table I.
observed in Figure 5(a) until V4 reaches a value close to
The design was made in a 65 nm CMOS technology
VCCA. This high V4 value switches the last inverter and
with low power and general purpose LP/GP transistor
gives a new zero output voltage at node 1.
In phase 2, the initial zero voltage at node (1) yields
(a)
a voltage at node (2) equal to VCCA and a zero voltage
at node (3). Since node 4 is high from previous phase,
930mV
the source and drain of transistor M0 will be at node (4)
and node (3) respectively. Given that VSD > VSG− Vt ,
this transistor operates in the saturation mode and its control current iD charges the capacitor C1 as shown in
Figure 5(b). However, on the contrary to 1, the charging
(b)
of the capacitor decreases the source voltage at node (4)
2
600
1.6
400
1.2
0.8
200
0.4
0
1000
150
200
0
250
Energy consumption per pulse
(pJ/Pulse)
Average Power consumption (µW)
350mV
(c)
16mV
Vcontrol (mV)
Fig. 13. Measured power consumption and energy consumption per
pulse as a function of Vcontrol for VCCA = VCCB = 1.2 V.
J. Low Power Electron. 11, 349–358, 2015
Fig. 15. (a) The signal transmitted from the pulse generator through the
antenna, (b) the received signal at 1 cm, (c) the received signal at 100 cm.
353
A 65 nm CMOS Ultra-Low-Power IR-UWB Emitter for Short-Range Indoor Localization
400
Jazairli and Flandre
1.2
0.8
Theoretical received amplitude
300
Voltage (V)
Amplitude (mV)
Measured received amplitude
200
0.6
0.4
100
500 ps
0
0
0
50
100
150
200
Time (s)
Distance (cm)
Fig. 18. Zoomed-in output waveform sensitivity using Monte-Carlo
simulation.
Fig. 16. The measured received amplitude (solid line) and theoretical
received amplitude (dotted line) versus distance.
a special 50
RF probe to the output buffer load to
guarantee minimum resistance and capacitor effect from
property.20 A process called LP/GP Mix is available and
the cables and pads. Using the 16 GHz analog bandemploys Low Power and General Purpose devices on the
width Agilent DSO-X91604A digital sampling oscillosame chip. The advantage of using such 65 nm CMOS
scope, we measured the pulse shape shown in Figure 8(a)
process is the high performance, low power consumption
at the output. First, we compared the simulated result
and the availability of multi threshold voltages. LP devices
using the ELDO circuit simulator with the actual device
were used for the pulse generator to minimize power conoutput.
sumption, GP devices were used for the buffer for high
In Figure 8, the peak-to-peak amplitude at the output of
speed pulse integrity. The capacitor C1 was made using
the buffer is 930 mV for the measured result while it is
n-MOS transitors that is placed inside an NWell so that
1 V for the simulated result. The pulse width is about
the bottom plate is all N type beneath the poly. Figure 7
500 ps for the measured and 400 ps for the simulated
shows the fabricated pulse generator. It is Delivered
to be notedby
that
Ingenta to: unknown
result. Moreover,
it is worth mentioning that the signal
Copyright:
Publishers
the pulse shaping filter was not fabricated
on chip American
in order Scientific
shapes corresponding to other values of Vcontrol are simto validate the CMOS emitter separetely and study whether
ilar to the ones shown in Figure 8. The measured spectra
an adequate antenna can replace the pulse shaping circuit.
of the output impulse train are shown in Figure 9, while
Therefore, all the measurement results in the next section
the simulated power spectral density (PSD) is shown in
are done without the pulse shaping circuit.
Figure 10. Given the minimal emitted pulse energy, PSD
is always lower than −40 dBm/MHz, which makes it com5. MEASUREMENT RESULTS AND
pliant with the FCC mask for all frequency band. It is
ANALYSIS
important to mention that this spectra result is obtained
5.1. Impulse Shape
without connecting the pulse shaping circuit. Here, the
The measurements were realized by connecting the 65 nm
UWB antenna parameters work as a pulse shaping circuit
and cut the spectra at low frequency making it comply
die on a probe station using DC decoupled probes for
with the FCC mask.
the power supply and Vcontrol, as well as connecting
(b)
1200
500
VDD=1.2V, T=25°c
Pulsewidth (ps)
Pulse repetition frequency (MHz)
(a)
800
400
0
100
400
300
200
100
0
150
200
250
300
350
400
450
TT
T
FF
F
SS
S
S
SF
F
FS Me
Measured
Vcontrol (mV)
Fig. 17. Simulation of (a) Pulse repetition frequency versus Vcontrol, (b) Pulse width at Vcontrol = 100 (mV) for different process corners compared
with measurements.
354
J. Low Power Electron. 11, 349–358, 2015
Jazairli and Flandre
A 65 nm CMOS Ultra-Low-Power IR-UWB Emitter for Short-Range Indoor Localization
Pulse repetition frequency
(MHz)
from 720 W for a pulse repetition frequency of 700 MHz
to 118 W for a pulse repetition frequency of 98 MHz
at 1.2 V supply voltage. In terms of energy consumed per
600
pulse, the pulse width corresponds to an increase from
250
32
1 pJ to 1.2 pJ as Vcontrol increases from 100 to 250 mV
248
246
31
400
244
30
as shown in Figure 12. The measured results shown in
242
29
3.2
28
Figure 13 confirm the trends and orders of magnitude with
3
2.8
27
200
process deviations. The power consumption including the
buffer stage is decreased from 521 W for a pulse repeti0
tion frequency of 450 MHz to 82 W for a pulse repetition
200
300
400
100
frequency of 100 MHz at 1.2 V voltage supply. In terms of
Vcontrol (mV)
energy consumed per pulse, this corresponds to an increase
Fig. 19. Sensitivity of the pulse repetition frequency versus Vcontrol.
from 1.1 pJ to 1.5 pJ as Vcontrol increases from 100 mV
to 250 mV as shown in Figure 13.
Regarding the driven energy per pulse to the 50 load,
5.2. Pulse Frequency and Pulse Width
this
corresponds to an increase from 0.75 pJ to 0.9 pJ as
Our UWB pulse generator further provides a tunable pulse
Vcontrol
increases from 100 to 250 mV, which implies that
repetition frequency. In Figure 11, for supply voltages
approximately
60–65% of the energy consumed is driven
VCCA and VCCB set to 1.2 V, and for typical proto the antenna. As explained in Section 2, these values of
cess conditions, the simulated pulse frequency decreases
energy per pulse are the minimum values that the pulse
from 700 to 50 MHz as the control voltage increases
generator must transmit in order to be detected by the
from 100 mV to 350 mV. The pulse width (red dotted
receiver.
curve in Fig. 11) varies slightly when the pulse frequency
Finally, it is important to mention that we can stop the
decreases, from 350 ps at 700 MHz to 420 ps at 10 MHz.
output pulse emission at any time by either applying a
As to the measured result (shown in Fig. 11), it validates
zero voltage on VCCB, or by applying a voltage higher
the controelability of the transmitter. The pulse frequency
than 400 mV on Vcontrol. By applying such voltage, the
decreases from 450 MHz to 3 MHz as the control volttransistor M0 will not operate in on regime anymore, so
age increases from 100 mV to 350 mV. The
pulse width
Delivered
by Ingenta to: unknown
no oscillation
can take place.
(the black dotted curve in Fig. 11) varies
slightly
when Scientific
Copyright:
American
Publishers
699
697
695
693
691
689
800
the pulse frequency decrease, from 495 ps at 450 MHz
to 410 ps at 3 MHz. The quantitative difference between
the simulated and measured result are due to the fact that
our circuit operates closer to the slow process corner than
to the simulated typical process corner as explained in
Section 7.
5.3. Power and Energy Consumption
The total power consumption of the transmitter sums up
the VCRO and buffer. In Figure 12, the simulated power
consumption dominated by the buffer stage is decreased
6. TRANSMISSION OF PULSES
We next connected the pulse generator with the UWB
antenna designed at UCL21 shown in Figure 14(a), and
we transmitted the signal from the pulse generator through
a paired emitter and received antennas so as to study
the received signal by using a Digital Sampling Oscilloscope. The variation of the UWB antenna impedance with
respect to the frequency is shown in Figure 14(b). The
upper blue curve represents the real resistance value of
the antenna. By taking a look at our operating bandwidth
(a)
(b)
–40
VDD=1.2V,Process:TT
Normalized PSD (dB)
800
700
600
–20
500
400
300
At 120°C
At 25°C
At–40°C
–40ºC 25ºC 120ºC
200
100
–40
0
5
Frequency (GHz)
Fig. 20.
–40ºC 25ºC 120ºC
10
0
Pulse width
(ps)
Pulse Repetition
Frequency-PRF
(MHz)
Normalized power spectral density (PSD), (b) Pulse width and PRF of the output pulse simulated at different temperatures.
J. Low Power Electron. 11, 349–358, 2015
355
A 65 nm CMOS Ultra-Low-Power IR-UWB Emitter for Short-Range Indoor Localization
Jazairli and Flandre
Table II. Measured results.
which is between 2.5 GHz and 7 GHz, we find that the
resistance varies between 20
and 70 . The lower red
Process technology
65 nm CMOS
curve in Figure 14(b) represents the imaginary part of the
Supply voltage
VCC = 1.2 V
Pulse frequency
450 MHz to 3 MHz
impedance, it varies between −20
and 20
in our
Power consumption
521 W to 82 W
operating frequency range. It is worth mentioning that the
Pulse width
495 to 503 ps
negative value represents a capacitive reactance (1.3 pF at
Frequency band
1–7 GHz
X = −20 ) while the positive value represents an inductive reactance (10 nH at X = 20
. It is notable that
in Section 5 we took into consideration these values as
pulse shaping circuit and the antenna as well as minimizwell as the extra capacitance and resistance values that are
ing the parasitics from the cables in order to reduce the
added to the circuit from the cables and the instruments
energy losses.
while simulating our design in order to reach an accurate comparison between the simulated and the measured
7. PVT VARIATIONS
result.
The control voltage is set to obtain a 100 MHz pulse
The pulse generator of Figure 1 is examined under Process,
repetition frequency. The pulse generator generates the
Voltage and Temperature (PVT) variations.
train of pulses shown in Figure 15(a) at the input of
In Figure 17(a), the results of corner simulations are
the UWB antenna. The received signal is shown in
shown for an input control voltage Vcontrol varying
Figures 15(b), (c). The peak to peak amplitude is around
between 100 and 500 mV. It is observed that the SF (Slow
350 mV for 1 cm distance between the transmitted and
NMOS, Fast PMOS) and FF (Fast NMOS, Fast PMOS)
received antenna, while it is 16 mV for 100 cm discorners provide a very high repetition frequency compared
tance between the antennas. The drop in voltage between
to the other cases, which mean that with fast PMOS we
Figures 15(a)–(c) is due to the cable losses between the
obtain fast repetition frequency. This is expected since the
pulse generator and the antenna as well as due to the disrepetition frequency is directly proportional to the phase
tance. In Figures 15(b) and (c), we can easily recognize
2 (as explained in Section 4) and M0 in which the PMOS
the effect of the UWB antenna, where the design of the
transistor plays the major role for the duration of phase
antenna converts the simple pulse to a monocycle
impulse
from Figure 17, we can see that the measurement
Delivered
by Ingenta2.to:Also
unknown
shape, giving the output pulse the necessary shape to make
results fall between TT (Typical NMOS, Typical PMOS)
American
Publishers
it comply with FCC mask. In FigureCopyright:
16, the solid
curve Scientific
and SS (Slow
NMOS, Slow PMOS) corners.
represents the measured received amplitude as a function
For a localization application, which is our target, the
of the distance between the antennas. The dotted line repmaximum required pulse frequency is up to 200 MHz. In
resents the simulated receiving amplitude as directly proFigure 17, we can observe that all the corners meet the
portional to 1/d, where d is the distance between the
requirements for localization within the range of 200 MHz.
antennas. This was done because ideally the amplitude
A Monte Carlo simulation of 50 runs around typical
should decrease in a ratio of 1/d as a function of distance.
process (TT) parameters is done to estimate the system
From the two curves in Figure 16 we observe that the
sensitivity to device mismatch. Figure 18 shows a zoomedmeasured curve follow a trend very close to the theoretical
in version of the output waveform sensitivity. The output
curve calculated for ideal propagation. It is important to
signal shows a reasonable timing difference but not for
note that a bigger range can be obtained by optimizing the
amplitude or pulse width as a result of device mismatch
(a)
(b)
Process:TT, T=25°c
Output voltage on 50 Ω (V)
800
1V 1.1V 1.2V1.3V 1.4V
700
600
500
400
1V 1.1V 1.2V1.3V 1.4V
300
200
100
0
VCCA,VCCB (V)
Pulse width
(ps)
Pulse Repetition
Frequency-PRF
(MHz)
Fig. 21. (a) Simulated output voltage, (b) Pulse width and PRF at different supply voltages.
356
J. Low Power Electron. 11, 349–358, 2015
Jazairli and Flandre
A 65 nm CMOS Ultra-Low-Power IR-UWB Emitter for Short-Range Indoor Localization
Table III. Comparison with previously reported pulse generators.
Technology
0.8 Si/SiGe [3]
0.18 m CMOS [4]
90 nm CMOS [5]
0.18 m CMOS [6]
0.18 m CMOS [7]
90 nm CMOS [22]
0.18 m CMOS [23]
65 nm CMOS [This work]
Energy consumption
per pulse (pJ/pulse)
Peak
amp. (mVpp)
Pulse width (ns)
Pulse type
Band (GHz)
Active die
area (mm2 )
80
26
39
1 65
5
52
20
1.1–1.5
360
533
595
300
200
414
200
350
04
04
0 38
09
2
0 96
1
05
Gaussian
5th order Gaussian
NA
Gaussian
Gaussian
NA
Monocycle
Gaussian monocycle
5–9
3–10.6
NA
0–8
3–10
3–4.8
3–5
1–7
0 32∗
NA
NA
0 026
0 16
0 0015
0 08
0 0010
variations. Figure 19 shows the repetition rate sensitivity
References
1. Revision of part 15 of the Commission’s Rules Regarding UWB
with the variation of device mismatch. It can be easily
Transmission System, ET Docket 98-153, Federal Communications
seen that the difference in pulse frequency is very small
Commission (2002).
and can be neglected.
2. www.tagent.com.
The PSD results at different temperatures are shown
3. D. Lin, B. Schleicher, A. Trasser, and H. Schumacher, Si/SiGe HBT
in Figure 20(a). The −10 dB bandwidth at −40 C is
UWB impulse generator tunable to FCC, ECC and Japanese spectral masks, IEEE Radio and Wireless Symposium (RWS), Phoenix,
4.2 GHz which is from 2.2 to 6.6 GHz, while at 120 C
Arizona, USA (2011), pp. 66–69.
the bandwidth becomes 5.2 GHz which is from 2.2 to
4. X. Wang, S. Fan, B. Qin, L. Lin, Q. Fang, H. Zhao, H. Tang,
7.4 GHz. Figure 21(a) shows different output voltage corJ. Liu, Z. Shi, A. Wang, L. Yang, and Y. Cheng, A 0.05 pJ/presponding to a variation of the supply voltage VCCA =
mV 5th-derivative pulse generator for full-band IR-UWB transceiver
VCCB. The peak-to-peak amplitude across the 50
outin 0.18 m CMOS, IEEE Radio and Wireless Symposium (RWS),
Phoenix, Arizona, USA (2011), pp. 70–73.
put load slightly decreases when the supply voltage is
5. K. K. Lee, O. Naess, and T. S. B. Lande, A 3.9 pI/pulse differdecreased to 1.1 V, and slightly increases when the supply
ential IR-UWB pulse generator in 90 nrn CMOS, IEEE Microelecvoltage is increased to 1.3 V. As shown if Figures 20(b)
tronics and Electronics (PrimeAsia 2011), Macau, China (2011),
Delivered
Ingenta to:
and 21(b) the difference caused by the variation
of by
tempp. unknown
115–118.
perature and voltage on the pulse repletion frequency and
6. L. B. Leene, S. Luan, and T. G. Constandinou, A 890fJ/bit UWB
Copyright: American Scientific
Publishers
transmitter for SOC integration in high bit-rate transcutaneous biopulse width is very small and would have a negligible
9 10
implants,
IEEE International Symposium on Circuits and Systems
effect in applications such as localization.
8. CONCLUSION
In conclusion, an ultra-low-power frequency-tunable UWB
pulse generator has been reported in this paper. The pulse
repetition frequency varies from 450 MHz to 3 MHz and
the power consumption varies from 521 W to 82 W
for VCCA = VCCB = 1.2 V when Vcontrol varies from
100 mV to 250 mV. The energy consumed per pulse
increase from 1.1 pJ to 1.5 pJ, this is the minimum energy
per pulse that a pulse generator can transmit so that to be
detected by the receiver in a short-distance indoor applications. Measured results are summarized in (Table II) and
very favorably compare to state-of-the art (Table III) in
terms of low energy consumption for achieved pulse peak
amplitude, short pulse width, large frequency band and
small active die area.
Acknowledgment: The authors would like to thank
Professor Luc Vandendorpe and Dr. Achraf Mallat for their
kind suggestions and help, Professor Christophe Craeye
and Dr. Farshad Keshmiri for the design and the fabrication of UWB antenna, Pascal Simon for the assistance with
measurements in the WELCOME lab (Wallonia Electronics and Communications Measurements).
J. Low Power Electron. 11, 349–358, 2015
(ISCAS), Beijing, China (2013).
7. M. Shen, Y.-Z. Yin, H. Jiang, T. Tian, and J. H. Mikkelsen,
A 3–10 GHz IR-UWB CMOS pulse generator with 6 mW
peak power dissipation using a slow-charge fast-discharge technique. IEEE Microwave and Wireless Components Letters 24, 634
(2014).
8. W. Tang, A. G. Andreou, and E. Culurciello, A low-power
silicon-on-sapphire tunable ultra-wideband transmitter, IEEE International Symposium on Circuits and Systems (ISCAS 2008), Seattle,
Washington, USA (2008), pp. 1974–1977.
9. A. Mallat, P. Gerard, M. Drouguet, F. Keshmiri, C. Oestges,
C. Craeye, D. Flandre, and L. Vandendorpe, Testbed for IR-UWB
based ranging and positioning: Experimental performance and comparison to CRLBs, IEEE International Symp. on Wireless Pervasive
Computing (ISWPC 10), Modena, Italy (2010), pp. 163–168.
10. A. G. Amigo, P. Closas, A. Mallat, and L. Vandendorpe, CramérRao bound analysis of UWB based localization approaches, IEEE
International Conference on Ultra-Wideband (ICUWB 2014), Paris,
France (2014), pp. 13–18.
11. E. Paolini, A. Giorgetti, M. Chiani, R. Minutolo, and M. Montanari,
Localization capability of cooperative anti-intruder radar systems.
EURASIP Journal on Advances in Signal Processing 2008, 1 (2008),
Article ID 726854.
12. A. Mallat, C. Oestges, and L. Vandendorpe, CRBs for UWB multipath channel estimation: Impact of the overlapping between the
MPCs on MPC gain and TOA estimation, IEEE International Conference on Communications (ICC 2009), Dresden, Germany (2009),
pp. 1–6.
13. B. Silva, P. Zhibo, J. Akerberg, J. Neander, and G. Hancke, Experimental study of UWB-based high precision localization for industrial
357
A 65 nm CMOS Ultra-Low-Power IR-UWB Emitter for Short-Range Indoor Localization
14.
15.
16.
17.
18.
applications, IEEE International Conference on Ultra-Wideband
(ICUWB 2014), Paris, France (2014), pp. 280–285.
A. Mallat, S. Gezici, D. Dardari, C. Craeye, and L. Vandendorpe,
Statistics of the MLE and approximate upper and lower
bounds–Part I: Application to TOA estimation. IEEE Transactions
on Signal Processing 62, 5663 (2014).
A. Mallat, S. Gezici, D. Dardari, and L. Vandendorpe, Statistics of
the MLE and approximate upper and lower bounds–Part II: Threshold computation and optimal pulse design for TOA estimation. IEEE
Transactions on Signal Processing 62, 5677 (2014).
M. A. K. Jazairli, A. Mallat, L. Vandendorpe, and D. Flandre, An
Ultra-Low-power frequency-tunable pulse generator using 65 nm
CMOS technology, IEEE International Conference on UltraWideband (ICUWB 2010), Nanjing, China (2010), pp. 1–4.
S. Sanghoon, K. Dong-Wook, and H. Songcheol, A CMOS UWB
pulse generator for 6–10 GHz applications. IEEE Microwave and
Wireless Components Letters (MWCL) 19, 83 (2009).
G. V. Fierro and G. E. Flores-Verdad, A CMOS low complexity
gaussian pulse generator for ultra wideband communications, IEEE
19.
20.
21.
22.
23.
Jazairli and Flandre
International Midwest Symposium on Circuits and Systems (MWSCAS 2009), Cancun, Mexico (2009), pp. 70–73.
M. A. K. Jazairli and D. Flandre, Low power pulse generator as a
capacitive interface for MEMS applications, IEEE Ph.D. Research
in Microelectronics and Electronics (PRIME 2009), Cork, Ireland
(2009), pp. 312–315.
F. Arnaud, Low cost 65 nm CMOS platform for low power and
general purpose applications, Symp. VLSI Tech., Los Angeles, USA
(2004), pp. 10–11.
F. Keshmiri, R. Chandra, and C. Craeye, Design of a UWB antenna
with stabilized radiation pattern, IEEE AP S/USNC/URSI International Symposium, San Diego, USA (2008), pp. 1–4.
K. K. Lee, M. Z. Dooghabadi, H. A. Hjortland, O. Ncess, and
T. S. Lande, A 5.2 pJ/pulse impulse radio pulse generator in 90
nm CMOS, IEEE International Symposium on Circuits and Systems
(2011), pp. 1299–1302.
M. J. Zhao, B. Li, and Z. H. Wu, 20-pJ/pulse 250 Mbps lowcomplexity CMOS UWB transmitter for 3–5 GHz applications. IEEE
Microw. Wireless Compon. Lett. 23, 158 (2013).
Mohamad Al Kadi Jazairli
Mohamad Al Kadi Jazairli received a B.S. degree in Electrical Engineering from Beirut Arab University (BAU), Beirut, Lebanon,
in 2005, and a M.S. degree in Molecular Electronics and System Design from Linköping University, Linköping, Sweden, in 2008.
Since then he joined the Institute of Information and Communication Technologies, Electronics and Applied Mathematics (ICTEAM),
at Université catholique de Louvain (UCL), Louvain-La-Neuve, Belgium, where he is currently pursuing his doctoral studies. His
research interests are in the field of ultra-low-power analog circuits, UWB communication, RFID and sensor design.
Denis Flandre
Delivered by Ingenta to: unknown
Denis Flandre Denis Flandre (M’85–SM’03)
received the
M.S. degree
in Electrical
Engineering, the Ph.D. degree and the Research
Copyright:
American
Scientific
Publishers
Habilitation from the Université catholique de Louvain (UCL), Louvain-la-Neuve, Belgium, in 1986, 1990 and 1999, respectively.
His doctoral research was on the modelling of Silicon-on-Insulator (SOI) MOS devices for characterization and circuit simulation,
his Post-doctoral thesis on a systematic and automated synthesis methodology for MOS analog circuits. Since 2001, he is full-time
Professor at UCL. He is currently involved in the research and development of SOI MOS devices, digital and analog circuits, as well as
sensors and MEMS, for special applications, more specifically high-speed, low-voltage low-power, microwave, biomedical, radiationhardened and high-temperature electronics and microsystems. He has authored or co-authored more than 900 technical papers or
conference contributions. He is co-inventor of 11 patents. He has organized or lectured many short courses on SOI technology, devices
and circuits in universities, industrial companies and conferences. He has received several scientific prizes and best paper awards.
He has participated or coordinated numerous research projects funded by regional and European institutions. He has been a member
of several EU Networks of Excellence on High-Temperature Electronics, SOI technology, Nanoelectronics and Micro-nano-technology.
Professor Flandre is a co-founder of CISSOID, a spin-off company of UCL focusing on SOI and high-reliability integrated circuit
design and products. He is scientific advisor of two other UCL start-ups : INCIZE (Semiconductor characterization and modeling
for design of digital, analog/RF and harsh environment applications) and e-peas (Energy harvesting and processing solutions for
longer battery life, increased robustness in all IoT applications). He is an active member of the SOI Industry Consortium and of the
EUROSOI network. He is an IEEE Senior member.
358
J. Low Power Electron. 11, 349–358, 2015