Falls in young adults- Perceived causes and environmental factors assessed with a daily online survey
Bạn đang xem bản rút gọn của tài liệu. Xem và tải ngay bản đầy đủ của tài liệu tại đây (682.67 KB, 10 trang )
Human Movement Science 46 (2016) 86–95
Contents lists available at ScienceDirect
Human Movement Science
journal homepage: www.elsevier.com/locate/humov
Falls in young adults: Perceived causes and environmental
factors assessed with a daily online survey
Michel Johannes Hubertus Heijnen a, Shirley Rietdyk a,b,⇑
a
b
Department of Health and Kinesiology, Purdue University, West Lafayette, IN, USA
Center for Aging and the Life Course, Purdue University, West Lafayette, IN, USA
a r t i c l e
i n f o
Article history:
Received 20 August 2015
Revised 17 December 2015
Accepted 17 December 2015
Available online 29 December 2015
Keywords:
Slips
Trips
Falls
Survey
Online
Young adults
a b s t r a c t
Falls are the third leading cause of unintentional injuries for ages 18–35 years (CDC), but
the causes and circumstances of falls in this age group are understudied. The purpose of
this study was to document the frequency and circumstances of falls in young adults with
a daily online survey. Ninety-four undergraduate students (19.9 ± 0.9 years) received a
daily email for 16 weeks regarding slips, trips and falls in the past 24 h (93% response rate).
More than half of the participants (52%) fell in the 16-week interval. Injuries were reported
in 16% of falls, and medical treatment was received in 4% of all falls. The majority of falls
occurred while walking (58%), and the main cause of the fall was a slip (48%) or trip
(25%). On average, participants fell once out of every 18 perceived slips and trips.
Physical activity level did not distinguish fallers from non-fallers (p = 0.45), but for those
who did fall, falls were more frequent as physical activity level increased (p = 0.007). The
high fall and injury rate in a short interval reflects the inherent instability of bipedal
locomotion and indicates that falls are not a trivial problem for young adults.
Ó 2015 Elsevier B.V. All rights reserved.
1. Introduction
Falls have been described as a major public health problem (WHO, 2012); they can lead to death, chronic pain, disability
and loss of independence (Kannus, Sievanen, Palvanen, Jarvinen, & Parkkari, 2005). Circumstances of falls are described
extensively in older adults (Berg, Alessio, Mills, & Tong, 1997; Robinovitch et al., 2013; Rubenstein & Josephson, 2002),
but fall surveys in young and middle-aged adults are less prevalent, with one study examining the age group 20–45 years
(Talbot, Musiol, Witham, & Metter, 2005), and no studies with an age range limited to adults younger than 25 years.
However, falls carry significant risk for both young and older adults, as falls are ranked as the third cause of accidental deaths
across all ages (CDC). Further, 28% of traumatic brain injury (TBI) cases were due to falls, and 70% of individuals with TBI are
children, adolescents or young adults (Rusnak, 2013). Therefore, increased knowledge is needed regarding falls in young
adults.
Control of dynamic equilibrium in humans is challenged by a number of factors, including the large inertial load of the
head, arms and trunk, a small base of support, a high center of mass, and the potential for vertical collapse due to the joints
in the lower limbs. Since falls in older adults occur most often during walking (Berg et al., 1997; Luukinen, Koski, Hiltunen, &
Kivelä, 1994; Talbot et al., 2005), falls are typically ascribed to the inherent instability of biped locomotion combined with
age-associated decrements in balance control (Chen, Ashton-Miller, Alexander, & Schultz, 1991; Lee & Chou, 2006; Muir,
⇑ Corresponding author at: Department of Health and Kinesiology, Purdue University, 800 W. Stadium Ave., West Lafayette, IN 47907-2046, USA.
E-mail address: (S. Rietdyk).
/>0167-9457/Ó 2015 Elsevier B.V. All rights reserved.
M.J.H. Heijnen, S. Rietdyk / Human Movement Science 46 (2016) 86–95
87
Haddad, Heijnen, & Rietdyk, 2015; Winter, 1991; Woollacott & Shumway-Cook, 2002). However, balance control is
presumably not compromised in young adults. Therefore, examination of falls in this group will increase understanding
of the relative contribution of bipedal instability versus compromised balance to falls. We can determine if healthy adults
younger than 25 years fall most often during walking, or if falls are more likely to result from challenging activities more
common in young adults such as athletic activities or texting while walking. Further, in older adults falls are believed to
result from the interaction of environmental hazards and individual susceptibility based on subject-specific characteristics
(Connell, Wolf, & Atlanta FICSIT Group, 1997; Rubenstein, 2006). Assessing the causes and circumstances of falls in young
adults will allow us to determine how environmental factors, such as stairs and icy sidewalks, and individual-specific
behaviors, such as physical activity level and alcohol consumption, are related to falls in young adults.
Falls are typically examined by asking participants to recall falls in the preceding month, preceding year, or preceding two
years (e.g. Talbot et al., 2005). However, fall memory is known to be problematic (Ganz, Higashi, & Rubenstein, 2005; Peel,
2000), and shorter time intervals (e.g. Berg et al., 1997; Rubenstein & Josephson, 2002) improve accuracy of fall data
(Cummings, Nevitt, & Kidd, 1988; Ganz et al., 2005; Hill, Schwarz, Flicker, & Carroll, 1999; Peel, 2000). Therefore, a quick
daily assessment of falls may be ideal to record frequency and circumstances of falls. Conventional methods for monitoring
falls include postcards, calendars, diaries or telephone calls, but online surveys have not been used even though there are
clear benefits. Participant benefit includes ease of responding and researcher benefits include ease of dissemination, reduced
costs, and digitally recorded responses. Since young adults readily adopt web-based technologies, a daily online survey
provides an ideal mechanism for fall assessment in this age group.
While falls are important to quantify, it is also important to consider perturbations that do not result in a fall, for example
slips and trips. The circumstances of these perturbations in the field are understudied, but provide important information
such as how many times people successfully recover from perturbations. The purpose of this study was to document the
frequency and circumstances of slips, trips and falls in young adults with a daily online survey.
2. Methods
Ninety-four undergraduate students (age 19.9 ± 0.9 years, range 18–22 years, 33 males; height 171.4 ± 9.5 cm; weight
71.1 ± 14.3 kg) participated in this study. All students were taking the same course: 34 students participated in the fall
semester (mid-August to mid-December), and 60 students participated in the spring semester (mid-January to mid-May).
Participating students received 1% extra credit. In order to limit coercion to participate in the survey, students who wanted
to receive the 1% credit were offered the choice of completing a short written assignment or participating in the survey. Of
the 114 students enrolled in the courses, 94 chose to participate in the survey (82%). Participants were not provided any
instruction regarding completion requirements; all students who agreed to participate received full academic credit even
if they did not respond to the daily emails. Participants who responded to less than 35% of the daily emails were excluded
from the analysis (Usdan, Schumacher, & Bernhardt, 2004). All participants completed an online consent form approved by
the Institutional Review Board.
The slip, trip, and fall survey consists of an initial survey (see Supplemental Digital Content 1, initial survey) (collected
once at the beginning of the 16 weeks) and the daily survey (see Supplemental Digital Content 2, daily online survey)
(collected daily for 16 weeks). Surveys were developed and distributed using Qualtrics Survey Software (Qualtrics Labs
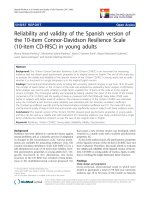
Inc. Provo, UT), and could be completed on any internet-connected device (computer, tablet, or smartphone, Fig. 1).
2.1. Initial survey
The initial survey included participant demographics (e.g. age, sex, height, weight) and physical activity level (see Supplemental Digital Content 1, initial survey). Activity level was measured using the Leisure-Time Exercise Questionnaire
(LTEQ) (Godin & Shephard, 1985).
2.2. Daily Survey
In the daily survey, participants received an email every day at 6:00 AM asking if they had slipped, tripped or fallen in the
past 24 h. A fall was defined as ‘‘An undesired contact of any body part (other than the feet) with the ground or a lower surface” (Weerdesteyn et al., 2006); this definition was provided each day with the first set of questions (Fig. 1a). Similarly, definitions for a slip and trip were provided (Fig. 1a). If a slip, trip, or fall was not reported, the survey concluded. When the
participant reported that a fall had occurred, follow-up questions regarding the circumstances of the fall were presented
(for example, see Fig. 1b; full set of questions provided in Supplemental Digital Content 2, daily online survey). Briefly,
the survey questions were developed from existing literature for causes of falls (Robinovitch et al., 2013) and injuries
(Talbot et al., 2005), and to quantify the timing and location of the falls. Alcohol and/or drug use was also assessed with
the following questions: ‘‘Were you under the influence of any substances that may have affected your balance (e.g. alcohol,
drugs)?” If ‘‘yes” was selected, a follow up question with a sliding scale was presented: ‘‘From the previous question,
probability that the fall was related to balance-altering substance (from 0 to 100).”
88
M.J.H. Heijnen, S. Rietdyk / Human Movement Science 46 (2016) 86–95
A
B
Fig. 1. Screenshot of slip, trip, and fall question (a), and circumstances (b) from the daily online survey presented on a mobile phone.
A participant may fall more than once per day, which would increase the length of time needed to complete the survey
and might reduce adherence. Therefore, on days when more than one incident occurred, participants were asked to report
the total number of incidents (slips, trips, and falls), and to only describe the circumstances of the fall that resulted in injury
or the participant perceived as interrupting their movement the most.
2.3. Statistical analyses
To quantify the change in adherence over the 16-week period, a linear regression was performed (SAS 9.3, Cary, NC, USA).
A Poisson regression was used to test for a relationship between activity level (LTEQ score) and the number of falls (Mplus,
Muthén & Muthén, Los Angeles, CA, USA). A p-value of 0.05 was selected.
3. Results
3.1. Response rate
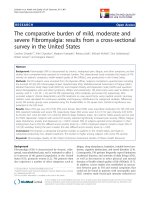
The average response rate was 93% (Fig. 2). The response rate demonstrated a linear decrease of 0.6% per week (p < 0.001;
Fig. 2). Five respondents (5%) had a response rate less than 35%; these participants were excluded from the results reported
Response Rate (%)
100
80
60
40
20
0
0
4
8
12
Week Number
16
Fig. 2. Response rate over time; the five participants who had a response rate less than 35% are included in this data.
M.J.H. Heijnen, S. Rietdyk / Human Movement Science 46 (2016) 86–95
89
Percent of Participants
60
50
40
30
20
10
0
0
1
2
3
4
5
Number of Falls
Fig. 3. Percentage of participants described as a function of the number of falls; the five participants who had a response rate less than 35% are not included.
6
Number of Falls
5
4
Fallers
(N=46)
3
Non-Fallers
(N=42)
2
1
0
0
50
100
150
200
250
LTEQ Score
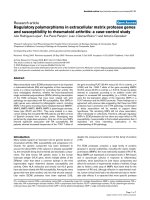
Fig. 4. Relationship between physical activity level (measured with the Leisure-Time Exercise Questionnaire) and the number of falls; the five participants
who had a response rate less than 35% are not included. Poisson regression analyses indicated that physical activity level did not distinguish fallers from
non-fallers (p = 0.45), but fallers who were more active had higher numbers of falls than fallers who were less active (p = 0.007).
below (Usdan et al., 2004), in Figs. 3 and 4, and in Table 1. The response rate ranged from 52–100% for the remaining
participants.
3.2. Slips and trips that did not result in a fall
A total of 1495 slips and trips were perceived and reported (average: 1.0 perturbation per week per participant).
3.3. Falls
Eighty-two falls were reported by 46 participants (52%). The number of falls ranged from 0 to 5, with 31% of participants
falling once and 21% falling more than once (Fig. 3). Of the participants that reported a fall, the average (median) number of
falls was 1.8 (1.0). The number of falls due to a slip or trip expressed as a percentage of total slips and trips was 5%. The
percentage of falls indoors versus outdoors was 37% versus 63%. There were nine reports of two falls in one day, and no
reports of more than two falls in one day. Since participants were only asked to report on the most disruptive fall each
day, no reports are available on the causes and circumstances of nine falls (11%). We recommend that future studies examine
all falls that occur each day, since experiencing more than one fall a day was not an uncommon occurrence in these young
adults.
90
M.J.H. Heijnen, S. Rietdyk / Human Movement Science 46 (2016) 86–95
Table 1
Circumstances of falls. Since data collection included winter, the data are presented with all falls included, and also with falls due to outdoor slips on ice/snow
removed.
All falls (total 73 falls)
Outdoor falls due to ice/snow removed (total 45 falls)
What was your fall due to?
Slip
Trip/stumble
Hit/bump
Fell asleep/legs collapsed/loss of consciousness
Weight shift
Loss of support with object
Unknown
Cannot remember
Other
48(35)
25(18)
8(6)
1(1)
5(4)
3(2)
0(0)
1(1)
8(6)
20(9)
40(18)
13(6)
2(1)
9(4)
4(2)
0(0)
2(1)
9(4)
What were you doing when it happened?
Standing
Walking
Running/jogging
Seated
Transfer from seated to standing or standing to seated
Sport/athletic activity
Other
1(1)
58(41)
10(7)
0(0)
4(3)
11(8)
15(11)
7(3)
44(19)
12(5)
0(0)
9(4)
16(7)
21(9)
Were you doing anything else at the time?
No
Talking to friend
Talking on phone
Texting
Daydreaming
Other
62(44)
32(23)
0(0)
3(2)
0(0)
3(2)
47(20)
44(19)
0(0)
5(2)
0(0)
5(2)
Was there something in the environment that caused the fall?
No
Flat surface
Irregular surface
Crack in sidewalk/broken sidewalk
Tree root/stick
Curb
Stair
Ice/slippery
Hill
Footwear
Grass
Pet/animal
Clutter
Other
10(9)
2(2)
11(10)
3(3)
1(1)
2(2)
12(11)
38(34)
8(7)
3(3)
0(0)
0(0)
2(2)
7(6)
16(8)
4(2)
16(8)
6(3)
0(0)
4(2)
14(7)
16(8)
6(3)
6(3)
0(0)
0(0)
4(2)
8(4)
Were you injured during the fall?
Yes
No
16(13)
84(58)
20(9)
80(34)
What was the level of lighting when it happened?
Well lit (bright light)
Poorly lit (dark or dim lighting)
55(39)
45(32)
58(25)
42(18)
Where were you (select all that apply)?
Indoors
Outdoors
37(25)
63(42)
64(25)
36(14)
When did it occur?
6:00 AM – Noon (12:00 PM)
Noon (12:00 PM) – 6:00 PM
6:00 PM – Midnight (12:00 AM)
Midnight (12:00 AM) – 6:00 AM
19(13)
24(17)
47(33)
10(7)
12(5)
26(11)
50(21)
12(5)
Values are percentages (frequency).
3.4. Falls related to alcohol and drugs
The fallers reported that they were under the influence of substances (alcohol/drugs) that may have affected their balance
in 9% of the falls. The average (median) perceived likelihood that the fall was related to the substance was 44% (50%), with a
range from 0% to 100%
M.J.H. Heijnen, S. Rietdyk / Human Movement Science 46 (2016) 86–95
91
3.5. Falls that did not result from winter weather
The participants had a much higher fall rate than previously reported for young adults (Talbot et al., 2005), but the fall
rate in the students who participated in the spring semester (71% of participants) may have been inflated by slippery conditions related to snowfall in central Indiana (26 cm of snow from January to May 2015 (www.wunderground.com). Therefore, the results were also reported with these falls excluded (Table 1, right column). After removing these falls, the fall rate
was 51 falls in 27 young adults (30%), and the average (median) number of falls was 1.1 (1.0).
3.6. Circumstances of falls
The main cause of a fall was a slip (48%) or a trip (25%), and the majority of falls occurred while walking (58%) (Table 1).
When winter weather was excluded, trips were the main cause (40%), followed by slips (20%), and walking remained the
most common activity (44%). Participants also fell during athletic activities (including running, jogging, sports), accounting
for 21% of the falls. Participants entered the following as examples of ‘other causes of falls’ (15% of the falls): pestering someone next to me, trying to pick up a document off the printer, pushing a car out of the snow, and jumping. Approximately half
of the falls occurred while multitasking. Talking to a friend was the most common multitasking activity (32%); few falls
occurred while texting (3%) (Table 1). Ice/slippery surface (38%) and stairs (12%) were the main environmental causes for
falls.
3.7. Injuries from falls
Injuries were reported in 13 of the 82 falls (16%); these injuries included five contusions (38%), four abrasions (31%), two
concussions (15%), one fracture (8%), and one self-report of general soreness (8%). Participants reported receiving medical
treatment in three falls (23% of all injuries, 4% of all falls). When expressed as a function of all participants, 12% of participants (11 of 89 participants) reported an injury due to a fall (two participants had two injuries in two falls), and 3% of participants (3 of 89) received medical treatment for an injury due to a fall.
3.8. Other circumstances associated with falls
Falls occurred about equally in high-light and low-light circumstances (55 and 45%, respectively; Table 1). Most falls
(63%) occurred outdoors when falls due to winter weather were included, and when falls due to winter weather were
excluded most falls (64%) occurred indoors (Table 1). About half of the falls occurred in the 6 h period from 6 pm to
12 am (Table 1).
3.9. Physical activity and falls
The LTEQ score (physical activity level) did not distinguish fallers from non-fallers (Fig. 4, white vs black circles; p = 0.45,
assessed with Poisson regression). However, the Poisson regression identified a significant relationship between the LTEQ
score and the number of falls for fallers (Fig. 4, black circles; p = 0.007). Fallers with a higher physical activity level reported
more falls than fallers with a lower activity level. The slope of the regression (0.007) indicates that for every 143 point
increase in LTEQ score, one more fall was observed in the fallers.
4. Discussion
The aim of this study was to document the frequency and circumstances of slips, trips and falls in young adults with a 16week daily online survey. In the 16-week interval, high fall rates were observed, and the findings here provide new insight
into the prevalence and circumstances of falls in young adults when a daily online survey is used. Falls were related to both
environmental and subject-specific factors, supporting the prevailing contention that the causes of falls are multi-factorial.
Before the prevalence and circumstances are discussed, it is important to demonstrate that participants will regularly complete the daily online survey, so the response rate is discussed first.
High response rates (93%) indicate that, on most days, young adults will complete a daily online survey of slips, trips, and
falls (Fig. 2). A similar response rate (82%) was observed with a different online daily survey, which investigated impaired
driving for five weeks in young adults (Usdan et al., 2004). Therefore, daily online surveys over an extended period appear
feasible for young adults. If the linear decrease in response rate of 0.6% per week was maintained (Fig. 2), the average
response rate would be 82% at the end of six months, and 67% at the end of one year. These response rates are still reasonable, but the large number of falls observed here indicates that a 16-week interval may be adequate to capture fall behavior.
Future studies should determine response rates for longer intervals, and also determine if the first 16 weeks can be used to
predict falls over longer intervals. An online survey has many benefits including ease of dissemination, ease of response,
reduced costs, and digitally recorded responses. Given that multiple email surveys are regularly sent out from various
sources (e.g. for marketing purposes), it may be difficult to get people to respond to this survey without some form of com-
92
M.J.H. Heijnen, S. Rietdyk / Human Movement Science 46 (2016) 86–95
pensation. However, in a pilot study, we assessed 25 volunteers (age range 20–90 years) who did not receive compensation
(Heijnen & Rietdyk, 2014). The daily survey in the pilot study was longer than the daily survey used here; the response rates
were 80%, 86%, and 89% for age groups 20–35 years, 36–65 years and greater than 65 years, respectively. Therefore, it
appears that daily online surveys are feasible to assess falls in multiple age groups if the participants have daily access to
email.
Over half of the young adults observed in this study fell in 16 weeks (52%), and this rate remained high (30%) when falls
that resulted from the winter weather were excluded (Table 1). It is reasonable to expect that high fall rates in healthy young
adults would result from participation in activities with higher fall-risk, such as sports. However, the fact that the majority of
falls occurred while walking supports the prevailing argument that bipeds are mechanically unstable and also demonstrates
that walking is a challenging task (Winter, 1991). The findings reported here – that young healthy adults regularly experience falls during walking – highlight the challenge of preventing falls in people with compromised balance. However, the
survey findings may help identify interventions that are most likely to reduce falling in young adults. Slips and trips were
reported as the most common causes of falls in young adults, similar to that reported for older adults (73% reported here
for young adults versus 53–59% for older adults (Berg et al., 1997; Blake et al., 1988). Therefore, fall interventions should
continue to focus on novel slip- and trip-training interventions (Bieryla, Madigan, & Nussbaum, 2007; Mansfield, Peters,
Liu, & Maki, 2010; Pai & Bhatt, 2007; Rosenblatt & Grabiner, 2012). In fact, the high fall rates observed here indicate that
young subjects may provide an ideal population to establish training parameters that are most effective at reducing falls.
This may streamline training in populations with compromised balance. The observation that 12% of falls resulted from tripping on stairs supports the continued examination of visual attention and motor behavior during stair walking (Den Otter,
Hoogwerf, & Van Der Woude, 2011; Telonio et al., 2014; Zietz & Hollands, 2009) and environmental modifications to improve
stair safety (Foster, Hotchkiss, Buckley, & Elliott, 2014).
In older adults, falls are believed to result from the interaction of environmental hazards and individual susceptibility
based on subject-specific gait characteristics (Connell et al., 1997; Rubenstein, 2006). The daily on-line survey can be used
to more fully understand this relationship across all ages. For example, while environmental causes were identified in most
falls, 10% of falls in young adults were not perceived to be related to an environmental hazard (Table 1). Therefore, a subjectspecific factor such as gait characteristics was the likely cause. We have preliminary evidence that foot clearance when stepping over obstacles in the laboratory setting is related to falls documented with the survey (Heijnen & Rietdyk, 2015). Future
studies can further quantify the relationship between environmental demand, gait characteristics and falls by combining the
slip, trip, and fall survey with gait assessments.
The fall rates observed here in 16 weeks (52%) are substantially higher than the rate reported for young adults in two
years (18%) (Talbot et al., 2005). Note that the participants in Talbot et al. (2005) were from Baltimore and would also have
experienced winter weather in the two year interval. The most likely reason for the substantially higher fall rates is a greater
ability to recall falls with the daily assessment observed here versus the biennial assessment used in Talbot et al. (2005). This
argument is supported by the much lower injury rates observed here (16%) versus the previous research (71%) with a 2-year
survey (Talbot et al., 2005). In the latter study, it is likely that most falls that did not result in injury were forgotten. Noninjurious falls that were recalled were likely memorable in some other way, such as they happened more recently or someone observed the fall. However, other factors may also contribute to the large differences in fall rates across the two studies.
For example, the participants in Talbot et al. (2005) ranged in age from 20–45 years and would have been more heterogeneous than our sample of undergraduate students that ranged in age from 18 to 22 years. Factors more common to young
undergraduate students, such as risk-taking behaviors, may have resulted in higher fall rates (although note that 91% of falls
were described as not related to alcohol/drug consumption, as described below). Future research should examine more
heterogeneous groups over multiple ages and in multiple geographical locations to fully quantify falls in young adults.
The injuries reported by the participants indicate that falls are not a trivial issue in young adults. Injuries including contusions, abrasions, concussions, and fracture were observed in 16% of falls. The injuries were severe enough to require medical treatment in 4% of falls. Expressed another way, 3% of participants required medical treatment for a fall in a four month
period. Larger data bases should be developed to more fully understand the relationship between falls in young adults and
serious injuries, such as TBI (Rusnak, 2013).
In the majority of the falls (91%), the participants reported that they were not under the influence of any substances that
may have affected their balance. While it appears reasonable to expect that alcohol consumption is related to falls, the association between usual alcohol use and fall risk was inconclusive in young and middle-aged adults (Kool, Ameratunga, &
Jackson, 2009), and has been described as inconsistent in older adults (Mukamal et al., 2004). Increased knowledge of this
relationship could be obtained in future research by adding daily alcohol consumption to the daily fall survey, providing a
longitudinal assessment. However, the observation that most falls occurred when the participant was not under the influence of substances further supports the argument that biped locomotion is inherently unstable even in healthy young adults.
While it seems likely that more active participants will be more likely to fall, physical activity level did not differ between
participants who reported a fall (fallers) and participants who did not fall (non-fallers) (Fig. 4). Therefore, something other
than activity level puts the young, healthy individual at risk for falling, such as an individual’s general balance or adaptive
gait characteristics (Heijnen, Muir, & Rietdyk, 2012). Another possibility is that physically active non-fallers tend to be active
in environments where fall-risk is lower (e.g. in a gym or in a swimming pool), while the fallers may act in environments
where fall-risk is higher (e.g. running or hiking outdoors). Future studies could explore this by including questions regarding
the type of physical activity. Although activity level did not differentiate fallers from non-fallers, there was a relationship
M.J.H. Heijnen, S. Rietdyk / Human Movement Science 46 (2016) 86–95
93
between activity level and number of falls within the faller group: fallers who were more active reported more falls (Fig. 4). It
will be informative to determine if the same relationships are observed in older groups in order to increase knowledge of fall
risk in older adults.
The role of multitasking in falling was assessed by asking if participants were doing anything else in addition to the main
activity. There has been recent concern about injuries associated with texting while walking (Nasar & Troyer, 2013). However, few falls occurred while texting (Table 1), so this study did not support this concern. Most participants were either not
doing anything else at the time of the fall (62%) or were talking to a friend (32%). Walking while talking is commonly performed and appears simple. However, it requires multi-task management of language formulation, speech generation, locomotion, and terrain navigation. The high cognitive demands associated with walking while talking are consistent with the
following observations: (1) older adults who stop walking in order to talk are more likely to fall (Lundin-Olsson, Nyberg,
& Gustafson, 1997), and (2) young adults modify both speech and gait in order to walk and talk simultaneously
(Raffegeau, Rietdyk, Haddad, & Huber, 2013). However, the observation that talking was the most common other activity
during a fall may simply reflect that young adults regularly engage in walking while talking, and this just happened to be
what they were doing when they fell. Further research is needed to determine if walking while talking increases fall-risk.
The number of slips and trips, without an associated fall, were variable, ranging from 0 to 15 per day (data not
shown). These between-subject differences could be due to different activities, environments, levels of attention, etc.
Although definitions of slips, trips, and falls were provided in the daily survey, differences could also be due to the
ability to perceive and recall slips and trips, as they may be so common that they are routinely ignored. Thus, the average number of slips and trips (1.0 per week per participant) is likely higher. However, it is clear that young healthy
adults regularly experience perturbations. Further, the ratio of falls to perturbation provides a unique assessment.
Young adults, on average, fell once every 18 slips and trips. A higher ratio (i.e. 1 fall for every 5 slips and trips) would
reflect a decreased ability to recover adequately from perturbations, and the person may benefit from specific slip and/
or trip training (e.g. (Bieryla et al., 2007; Mansfield et al., 2010; Pai & Bhatt, 2007; Rosenblatt & Grabiner, 2012). Comparison of falls to the number of slips and trips is a unique parameter that can only be assessed with a daily online
survey, due to the frequency of slips and trips.
The frequency and circumstances of falls in younger adults assessed here has been highly informative, but the web survey
would be also be beneficial in middle-aged and older adults, as they are also at risk of falls and injury (CDC). As noted above,
in the pilot study older adults with email access responded regularly to the daily online survey without compensation
(Heijnen & Rietdyk, 2014). This will be especially useful in the future as internet use among adults 55 years and older
increased from 34% to 62% from 2001 to 2011; this percentage will continue to grow. Further, the survey can also be used
to test fall behavior hypotheses, such as, is a change in the frequency of slips and trips predictive of a future fall? Therefore,
online fall surveys may be a viable tool as internet use continues to increase in all age groups.
There are several limitations to assessing falls with an online survey. The main limitation of an online survey is undercoverage (Bethlehem, 2010), with participation limited to people who have internet access. This will lead to biased results
if there are fall-related differences between internet users and non-internet users. Age (File, 2013), level of education
(Bethlehem, 2010), gender (Seybert, 2013), race (File, 2013; Seybert, 2013) and country (File, 2013; Seybert, 2013) play a role
in the likelihood of internet access. Households with internet access in European countries ranged from 49% to 96% in 2012
(Seybert, 2013) and was 72% in the United States in 2011 (File, 2013). However, the percentage of household with internet in
the United States increased from 50% in 2001 to 72% in 2011 (File, 2013). Under-coverage will decrease as the populations
with internet continue to grow. Other limitations of an online daily survey include survey fatigue, self-selection bias, and
self-report. While our response rate was strong over 16-weeks, survey fatigue may become an issue for longer surveys,
and it is not yet known if longer surveys are necessary. Self-selection bias may occur if people who perceive that they have
very good or very poor balance may be more willing to participate in a daily online survey on slips, trips, and falls. Finally,
self-reporting frequency and circumstances of falls can be problematic. It is important to provide standard definitions of a
slip, trip, and fall to the subject to reduce between-subject differences in frequency of slips, trips, and falls (e.g. (Verma
et al., 2011), which is why the definitions were provided to participants each day (Fig. 1a). Self-report is also limited by
the ability to accurately recall the circumstances of a fall, as this is known to be problematic in young adults (Feldman &
Robinovitch, 2006) and older adults (Ganz et al., 2005).
5. Summary
Overall, high fall rates coupled with serious injuries indicate that falls are a critical issue in young adults. The majority of
falls were due to slips and trips, and, on average, one fall occurred for every 18 slips and trips. Activity level did not differ
between fallers and non-fallers, however, fallers that were more physically active fell more frequently than less active fallers.
These results address an understudied yet important question, and highlight the mechanically unstable nature of bipedal
locomotion.
Conflict of interest
The authors declare that no conflicts of interest exist.
94
M.J.H. Heijnen, S. Rietdyk / Human Movement Science 46 (2016) 86–95
Appendix A. Supplementary data
Supplementary data associated with this article can be found, in the online version, at />2015.12.007.
References
Berg, W. P., Alessio, H. M., Mills, E. M., & Tong, C. (1997). Circumstances and consequences of falls in independent community-dwelling older adults. Age and
ageing, 26(4), 261–268.
Bethlehem, J. (2010). Selection bias in web surveys. International Statistical Review, 78(2), 161–188.
Bieryla, K. A., Madigan, M. L., & Nussbaum, M. A. (2007). Practicing recovery from a simulated trip improves recovery kinematics after an actual trip. Gait &
posture, 26(2), 208–213.
Blake, A., Morgan, K., Bendall, M., Dallosso, H., Ebrahim, S., Arie, T., et al (1988). Falls by elderly people at home: Prevalence and associated factors. Age and
Ageing, 17(6), 365–372.
CDC. Web-based Injury Statistics Query and Reporting System (WISQARS): nonfatal injury reports.
Chen, H. C., Ashton-Miller, J. A., Alexander, N. B., & Schultz, A. B. (1991). Stepping over obstacles: Gait patterns of healthy young and old adults. Journal of
Gerontology, 46(6). M196-203.
Connell, B. R., Wolf, S. L., & Atlanta FICSIT Group (1997). Environmental and behavioral circumstances associated with falls at home among healthy elderly
individuals. Archives of Physical Medicine and Rehabilitation, 78(2), 179–186.
Cummings, S. R., Nevitt, M. C., & Kidd, S. (1988). Forgetting falls. Journal of the American Geriatrics Society, 36(7), 613–616.
Den Otter, A., Hoogwerf, M., & Van Der Woude, L. (2011). The role of tread fixations in the visual control of stair walking. Gait & posture, 34(2), 169–173.
Feldman, F., & Robinovitch, S. (2006). Recalling the mechanics of falls: Young adults cannot accurately describe the sites of impact immediately after a fall
occurs. Osteoporosis International.
File, T. (2013). Computer and internet use in the United States. Current population survey reports. Washington, DC: U.S. Census Bureau, pp. 20–569.
Foster, R. J., Hotchkiss, J., Buckley, J. G., & Elliott, D. B. (2014). Safety on stairs: Influence of a tread edge highlighter and its position. Experimental Gerontology,
55, 152–158.
Ganz, D. A., Higashi, T., & Rubenstein, L. Z. (2005). Monitoring falls in cohort studies of community-dwelling older people: Effect of the recall interval. Journal
of the American Geriatrics Society, 53(12), 2190–2194.
Godin, G., & Shephard, R. J. (1985). A simple method to assess exercise behavior in the community. Canadian Journal of Applied Sport Sciences, 10(3), 141–146.
Heijnen, M. J. H., Muir, B. C., & Rietdyk, S. (2012). Factors leading to obstacle contact during adaptive locomotion. Experimental Brain Research, 223(2),
219–231.
Heijnen, M. J. H., & Rietdyk, S. (2014). Daily online assessment of slips, trips, and falls across the lifespan. In Paper presented at the 7th World Congress of
Biomechanics. Boston, MA.
Heijnen, M. J. H., & Rietdyk, S. (2015). Falls in the real world are related to obstacle crossing behaviors in a lab setting for young adults. In Paper presented at
the international society of posture & gait research world congress. Seville, Spain.
Hill, K., Schwarz, J., Flicker, L., & Carroll, S. (1999). Falls among healthy, community-dwelling, older women: A prospective study of frequency,
circumstances, consequences and prediction accuracy. Australian and New Zealand Journal of Public Health, 23(1), 41.
Kannus, P., Sievanen, H., Palvanen, M., Jarvinen, T., & Parkkari, J. (2005). Prevention of falls and consequent injuries in elderly people. The Lancet, 366,
1885–1893.
Kool, B., Ameratunga, S., & Jackson, R. (2009). The role of alcohol in unintentional falls among young and middle-aged adults: a systematic review of
epidemiological studies. Injury Prevention, 15(5), 341–347.
Lee, H.-J., & Chou, L.-S. (2006). Detection of gait instability using the center of mass and center of pressure inclination angles. Archives of Physical Medicine
and Rehabilitation, 87(4), 569–575.
Lundin-Olsson, L., Nyberg, L., & Gustafson, Y. (1997). ‘‘Stops walking when talking” as a predictor of falls in elderly people. The Lancet, 349(9052), 617.
Luukinen, H., Koski, K., Hiltunen, L., & Kivelä, S.-L. (1994). Incidence rate of falls in an aged population in northern Finland. Journal of Clinical Epidemiology, 47
(8), 843–850.
Mansfield, A., Peters, A. L., Liu, B. A., & Maki, B. E. (2010). Effect of a perturbation-based balance training program on compensatory stepping and grasping
reactions in older adults: A randomized controlled trial. Physical Therapy, 90(4), 476–491.
Muir, B. C., Haddad, J. M., Heijnen, M. J. H., & Rietdyk, S. (2015). Proactive gait strategies to mitigate risk of obstacle contact are more prevalent with
advancing age. Gait & Posture, 41(1), 233–239.
Mukamal, K. J., Mittleman, M. A., Longstreth, W., Newman, A. B., Fried, L. P., & Siscovick, D. S. (2004). Self-reported alcohol consumption and falls in older
adults: Cross-sectional and longitudinal analyses of the cardiovascular health study. Journal of the American Geriatrics Society, 52(7), 1174–1179.
Nasar, J. L., & Troyer, D. (2013). Pedestrian injuries due to mobile phone use in public places. Accident Analysis & Prevention, 57, 91–95.
Pai, Y. C., & Bhatt, T. S. (2007). Repeated-slip training: An emerging paradigm for prevention of slip-related falls among older adults. Physical Therapy, 87(11),
1478–1491.
Peel, N. (2000). Validating recall of falls by older people. Accident Analysis & Prevention, 32(3), 371–372.
Raffegeau, T., Rietdyk, S., Haddad, J. M., & Huber, J. (2013). Gait and Speech are Interdependent in Young Healthy Adults. In Paper presented at the 60th annual
Meeting of the American College of Sports Medicine and 4th World Congress on Exercise is Medicine. Indianapolis, IN, USA.
Robinovitch, S. N., Feldman, F., Yang, Y., Schonnop, R., Leung, P. M., Sarraf, T., et al (2013). Video capture of the circumstances of falls in elderly people
residing in long-term care: an observational study. The Lancet, 381(9860), 47–54.
Rosenblatt, N., & Grabiner, M. D. (2012). The problem is falls: The answer is kinesiology. Kinesiology Review, 1, 32–36.
Rubenstein, L. Z. (2006). Falls in older people: Epidemiology, risk factors and strategies for prevention. Age and Ageing, 35 (Suppl. 2), ii37–ii41.
Rubenstein, L. Z., & Josephson, K. R. (2002). The epidemiology of falls and syncope. Clinics in Geriatric Medicine, 18(2), 141–158.
Rusnak, M. (2013). Traumatic brain injury: Giving voice to a silent epidemic. Nature Reviews Neurology, 9(4), 186–187.
Seybert, H. (2013). Internet use in households and by individuals in 2012. Eurostat, Statistics in Focus 50/2012. < />ITY_OFFPUB/KS-SF-12-050/EN/KS-SF-12-050-EN.PDF> Accessed 16.09.14).
Talbot, L. A., Musiol, R. J., Witham, E. K., & Metter, E. J. (2005). Falls in young, middle-aged and older community dwelling adults: Perceived cause,
environmental factors and injury. BMC Public Health, 5(1), 86.
Telonio, A., Blanchet, S., Maganaris, C. N., Baltzopoulos, V., Villeneuve, S., & McFadyen, B. J. (2014). The division of visual attention affects the transition point
from level walking to stair descent in healthy, active older adults. Experimental Gerontology, 50, 26–33.
Usdan, S. L., Schumacher, J. E., & Bernhardt, J. M. (2004). Impaired driving behaviors among college students: A comparison of web-based daily assessment
and retrospective timeline followback. Journal of Alcohol and Drug Education, 48, 34–50.
Verma, S. K., Chang, W. R., Courtney, T. K., Lombardi, D. A., Huang, Y.-H., Brennan, M. J., et al (2011). A prospective study of floor surface, shoes, floor cleaning
and slipping in US limited-service restaurant workers. Occupational and Environmental Medicine, 68(4), 279–285.
Weerdesteyn, V., Rijken, H., Geurts, A. C., Smits-Engelsman, B. C., Mulder, T., & Duysens, J. (2006). A five-week exercise program can reduce falls and improve
obstacle avoidance in the elderly. Gerontology, 52(3), 131–141.
WHO. (2012). Falls.
M.J.H. Heijnen, S. Rietdyk / Human Movement Science 46 (2016) 86–95
95
Winter, D. A. (1991). Biomechanics and motor control of human gait: normal, elderly and pathological.
Woollacott, M., & Shumway-Cook, A. (2002). Attention and the control of posture and gait: A review of an emerging area of research. Gait & posture, 16(1),
1–14.
www.wunderground.com. Weather history|weather underground. Retrieved from <>.
Zietz, D., & Hollands, M. (2009). Gaze behavior of young and older adults during stair walking. Journal of Motor Behavior, 41(4), 357–366.