Frailty as a predictor of future falls among community dwelling older people a systematic review and meta analysis
Bạn đang xem bản rút gọn của tài liệu. Xem và tải ngay bản đầy đủ của tài liệu tại đây (1.25 MB, 7 trang )
JAMDA xxx (2015) 1e7
JAMDA
journal homepage: www.jamda.com
Review Article
Frailty as a Predictor of Future Falls Among Community-Dwelling
Older People: A Systematic Review and Meta-Analysis
Gotaro Kojima MD *
Japan Green Medical Centre, London, United Kingdom
a b s t r a c t
Keywords:
Frailty
falls
community-dwelling older people
Background: Although multiple longitudinal studies have investigated frailty as a predictor of future falls,
the results were mixed. Thus far, no systematic review or meta-analysis on this topic has been conducted.
Objective: To review the evidence of frailty as a predictor of future falls among community-dwelling older
people.
Methods: Systematic review of literature and meta-analysis were performed using 6 electronic databases
(Embase, Scopus, MEDLINE, CINAHL Plus, PsycINFO, and the Cochrane Library) searching for studies that
prospectively examined risk of future fall risk according to frailty among community-dwelling older
people published from 2010 to April 2015 with no language restrictions.
Results: Of 2245 studies identified through the systematic review, 11 studies incorporating 68,723
individuals were included in the meta-analysis. Among 7 studies reporting odds ratios (ORs), frailty and
prefrailty were significantly associated with higher risk of future falls (pooled OR ¼ 1.84, 95% confidence
interval [95% CI] ¼ 1.43e2.38, P < .001; pooled OR ¼ 1.25, 95% CI ¼ 1.01e1.53, P ¼ .005, respectively).
Among 4 studies reporting hazard ratios (HRs), whereas frailty was significantly associated with higher
risk of future falls (pooled HR ¼ 1.24, 95% CI ¼ 1.10e1.41, P < .001), future fall risk according to prefrailty
did not reach statistical significance (pooled HR ¼ 1.14, 95% CI ¼ 0.95e1$36, P ¼ .15). High heterogeneity
was noted among 7 studies reporting ORs and seemed attributed to difference in gender proportion of
cohorts according to subgroup and meta-regression analyses.
Conclusions: Frailty is demonstrated to be a significant predictor of future falls among communitydwelling older people despite various criteria used to define frailty. The future fall risk according to
frailty seemed to be higher in men than in women.
Ó 2015 AMDA e The Society for Post-Acute and Long-Term Care Medicine.
Older people are a highly heterogeneous population. Although
people generally develop diseases and disabilities as they age, the
trajectory and rate of change in health and functional status vary
widely in each individual and persons with the same chronological
age can have very different biological ages.1 Therefore, it is challenging to measure the heterogeneity of the aging process in the
elderly.
One of the potential concepts to quantify the overall health
diversity of older people is frailty. Frailty is a biological syndrome
characterized by reduced reserve capacity in multiple physiologic
systems and increased vulnerability to stressors due to age-related
cumulative deficits.2 In general, people are more likely to develop
The author declares no conflicts of interest.
* Address correspondence to Gotaro Kojima, MD, Japan Green Medical Centre, 10
Throgmorton Avenue, London EC2N 2DL, UK.
E-mail address:
/>1525-8610/Ó 2015 AMDA e The Society for Post-Acute and Long-Term Care Medicine.
frailty as they get older.2,3 Prevalence of frailty among communitydwelling people aged 65 years and older is widely variable depending on settings, ranging from 4.0% to 59.1%.3 Frailty has been shown to
be associated with multiple adverse health outcomes, including
disability, falls, hospitalization, institutionalization, and death. 2
Among these, fall is a leading cause of mortality in older people.4
Fall is not only associated with a wide range of negative consequences, such as disabilities, fear of falling, and impaired quality of
life,4,5 but also associated with increased health care burden and
costs.6 Incidence of fall is high among older people; one-third of
elderly aged 65 and older fall every year, and the incidence of falling
increases up to 50% among those 80 years and older.7 Given the expanding elderly population worldwide, preventing falls has been a
major public concern of authorities in many countries.4,8,9 One of the
important key issues for preventing falls is identification of risk factors for falling.
Weakness, impaired balance, and abnormal gait are major components of physical frailty2,10 and are likely to increase the risk of
2
G. Kojima / JAMDA xxx (2015) 1e7
falling in older people. Furthermore, frail older people may be at high
risk of falling because of decreased functional reserve capacity in
maintaining position, balance, and coordination, and increased
vulnerability to such stressors as accidents, disease symptoms, or
adverse drug reactions. The evidence of frailty as a predictor of falls in
community-dwelling older people comes from prospective cohort
studies with mixed results. Most of the studies demonstrated that the
frail elderly were more likely to fall than the nonfrail,10e17 but a few
showed nonsignificant results.18e20 Thus far, no systematic review or
meta-analysis studies on this topic have been conducted in the
literature. Therefore, the objectives of this systematic review were (1)
to identify and compare prospective cohort studies examining frailty
as a predictor of future falls among community-dwelling older people, and (2) to combine those data to synthesize pooled risk estimates
of frailty for future falls.
Methods
This study was conducted according to a protocol developed with
adherence to Meta-analysis of Observational Studies in Epidemiology
(MOOSE)21 statements by a clinician researcher who was trained for
internal medicine and geriatric medicine and is currently working as
a general practitioner.
Data Sources and Search Strategy
A systematic search of the literature was performed in April 2015
using Embase, Scopus, MEDLINE, CINAHL Plus, PsycINFO, and the
Cochrane Library for studies written in any languages and published
from 2000 through present. The search terms used included (Accidental falls (Medical Subject Heading (MeSH))) OR (Falling (MeSH))
OR (Falls (MeSH)) OR (Fall*) AND (Frailty) using an explosion function
if available. PubMed and reference lists of relevant studies were also
hand searched.
Study Selection
Prospective cohort studies examining frailty as a risk factor for
future falls were selected using the following inclusion criteria:
1.
2.
3.
4.
Prospective study design.
Community-dwelling individuals.
Sample size at least 100 individuals.
Individuals aged 60 years or older or mean age of 70 years or
older.
5. Frailty was defined by criteria originally designed to measure
frailty and validated in population-based studies or its modified versions.
6. Adjusted or unadjusted odds ratio (OR), risk ratio (RR), or
hazard ratio (HR) as a risk measure reported or able to be
calculated from available data.
Studies were excluded if they substituted other measures, such as
disability or walking speed, to define frailty or used selected samples
with certain conditions or diseases. If multiple studies used the same
data or cohort, a study with the largest number of individuals was
selected.
Data Extraction
A standardized data collection tool was used to collect data from
the eligible studies. The data extracted included the following: first
author, year of publication, location, sample size, proportion of male
individuals, age, frailty criteria, outcome, follow-up period, frequency
of fall monitoring, and effect measure. When single fallers and
recurrent fallers were used as separate outcomes and data of any
fallers (single fallers þ recurrent fallers) were not available, calculation of an OR of any fallers compared with nonfallers was attempted,
or the data of only recurrent fallers were used. Some frailty criteria
define “prefrail” or similar terminology, which is an intermediate
frailty status between frail and nonfrail/robust, and these data were
also collected and used for meta-analyses if available. When 2 or
more frailty criteria were used in a study, the most commonly used
Fried phenotype criteria or its modified versions were selected if
available or criteria less modified from the original were selected.
Methodological Quality Assessment
Eligible studies were further examined for methodological quality
using the Newcastle-Ottawa scale for cohort studies. This scale has 9
criteria to examine the methodological quality of cohort studies. Each
of the included studies was assessed using this scale and considered
to have adequate quality to be included for meta-analysis if it met 5
or more items out of 9.
Statistical Analysis
OR, RR, and HR along with 95% confidence interval (95% CI) of
future fall risk for frailty or prefrailty compared with nonfrailty/
robust were extracted directly from the articles or calculated based
on raw numbers shown in the articles. All analyses were performed
using StataIC 13 (Stata Corp, College Station, TX), Review Manager 5
(Computer program, Version 5.2; The Nordic Cochrane Centre, The
Cochrane Collaboration, Copenhagen, Denmark), and Comprehensive
Meta-Analysis version 3.3 (Biostat, Englewood, NJ).
OR, RR, and HR were log-transformed. SEs of the log-transformed
OR, RR, and HR were calculated by dividing the difference between
log-transformed upper and lower limits of 95% CI by 3.92. These data
of each study were entered into the Review Manager and Comprehensive Meta-Analysis to perform meta-analysis and meta-regression
analysis. The c2 test was used to assess heterogeneity across the
studies, and heterogeneity was considered present when P value was
less than 0.10. I2 statistic was used to quantify the degree of heterogeneity and I2 values of 25%, 50%, and 75% were considered as low,
moderate, and high heterogeneity, respectively.22 When high heterogeneity was observed, subgroup analyses and random-effects
meta-regression were performed to identify possible causes of heterogeneity. Publication bias was assessed by visually inspecting the
funnel plots.
Results
Selection Processes
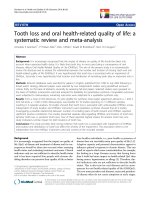
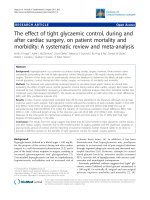
Figure 1 shows a flow chart of the literature search and study
selection with numbers of studies at each stage. Of 2245 citations
identified by the systematic review of the literature using 6 electronic
databases, 1306 duplicated articles were excluded and 920 articles
were excluded through review of titles and abstracts. One additional
article18 was found by manual search and added, leaving 20 articles
for full-text review. Of these, 9 articles were excluded because they
were review articles (n ¼ 2), did not classify frailty and nonfrailty
status (n ¼ 2),23,24 included nonecommunity-dwelling populations
(n ¼ 2), and used the same cohort (n ¼ 1). Neither abstracts nor full
texts were able to be obtained for 2 studies. Eleven articles were left
and confirmed that they met the inclusion criteria.10e20 Eleven articles provided data for 68,723 community-dwelling older people and
these were included in this systematic review. These studies were
then assessed for methodological quality using the Newcastle-Ottawa
G. Kojima / JAMDA xxx (2015) 1e7
3
Osteoporosis in Women, consisting of 48,636 women from multiple
countries in Europe, North America, and Australia,16 and 6 studies
involved fewer than 1000 individuals.14,15,17e20 Three studies had allfemale cohorts,13,16,18 1 had an all-male cohort,12 and the rest had
cohorts including 30.3% to 53.5% male individuals.10,11,14,15,17,19,20 The
mean age of the included studies with available data ranged from 72.1
to 82.0 years old. Original or modified Fried phenotype criteria were
most commonly used by 8 of the 11 studies.10,12e16,18,20 The other
criteria used were Study of Osteoporotic Fractures frailty index,12,14,19
Longitudinal Aging Study Amsterdam frailty instrument,11 and
Chinese-Canadian Study of Health and Aging Clinical Frailty Scale.17
Three studies used 2 different kinds of frailty criteria.12,14,19 Recurrent falls was most frequently used as an outcome11e14,16,17,19,20 and
first fall or any falls were used by 4 studies.10,15,17,18 Follow-up periods
ranged from 1 year to 4 years. Although 6 studies monitored falls
every 1 to 18 months,10e14,18 the other studies identified falls by
asking individuals if they had 1 or more falls at the end of the followup period.15e17,19,20
Cox proportional hazard models were used in 4 studies10,11,14,18
presenting HRs. Seven studies presented ORs calculated using logistic regression models or from raw numbers of 2 Â 2 tables.12,13,15e17,19,20 No study used RR.
Frailty as a Predictor of Future Falls
Fig. 1. Flow chart of study selection.
quality assessment scale for cohort studies. All of the 11 studies met
at least 5 criteria of 9 and were included for the meta-analyses
(Table 1).
Study Characteristics
Characteristics of the 11 studies included in this study are summarized in Table 1.10e20 More than half of the included studies were
from the United States,10,12e15,18 3 were from Europe,11,19,20 1 was
from Taiwan,17 and 1 included cohorts from multiple countries.16 The
largest study used a cohort of the Global Longitudinal Study of
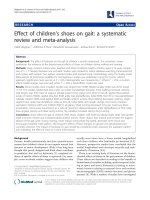
Meta-analysis of studies presenting OR
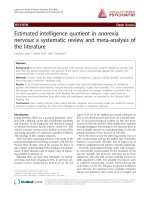
ORs from 7 studies, including a total of 60,577 individuals, were
combined to calculate a pooled OR and 95% CI using a random-effects
model due to high heterogeneity. Frailty was significantly associated
with higher future fall risk (pooled OR ¼ 1.84, 95% CI ¼ 1.43e2.38,
P < .001, c2 ¼ 26.41, df ¼ 6, I2 ¼ 77%). Prefrailty was examined by 4 of
these 7 studies and was also found to be associated with significantly
higher future fall risk (pooled OR ¼ 1.25, 95% CI ¼ 1.01e1.53, P ¼ .04,
c2 ¼ 12.83, df ¼ 3, I2 ¼ 77%) (Figure 2A).
Meta-analysis of studies presenting HR
Four studies with 8146 individuals presented HRs for frailty,
among which 3 studies presented HRs for prefrailty. Fixed-effects
models were used to calculate pooled HR and 95% CI, as heterogeneity was low for frailty and prefrailty. Although frailty was significantly associated with higher future fall risk (pooled HR ¼ 1.24, 95%
CI ¼ 1.10e1.41, P < .001, c2 ¼ 5.11, df ¼ 3, I2 ¼ 41%), an association
between prefrailty and fall risk did not reach a statistical significance
Table 1
Summary of Included Studies on Future Fall Risk Associated With Frailty Among Community-Dwelling Older People
Author
Year Location
Fried et al10
Bandeen-Roche et al18
Ensrud et al13
Ensrud et al12
Kiely et al14
Samper-Ternent et al15
Forti et al19
de Vries et al11
Sheehan et al20
Wu et al17
Tom et al16
2001
2006
2007
2009
2009
2012
2012
2013
2013
2013
2013
Sample Size* Men, % Age, yy Frailty Criteria
USA
5317
USA
560
USA
6543
USA
3118
USA
760
USA
847
Italy
741
Netherlands
1509
Ireland
521
Taiwan
653
USA, Europe, 48154
Australia
42.1
0
0
100
36.1
35.3
44.6
48.2
30.3
53.5
0
>65
>65
76.7
76.4
78.1
82.0
74.7
75.6
72.1
75.4
>55
Outcome
Follow-up Frequency of
Period, y Monitoring
Phenotype
First fall
3
Modified phenotype
First fall
3
Modified phenotype
Recurrent falls 1
Modified phenotype SOF Recurrent falls 1
Modified phenotype SOF Recurrent falls 1.5
Modified phenotype
Any falls
3
CSBA modified SOF
Recurrent falls 4
LASA
Second fall
1
Modified phenotype
Recurrent falls 2
CSHA-CFS
Any falls
1
Modified phenotype
Recurrent falls 1
Every 6 mo
Every 18 mo
Every 4 mo
Every 4 mo
Every mo
Once at follow-up
Once at follow-up
Every 3 mo
Once at follow-up
Once at follow-up
Once at follow-up
Effect
Qualityz
Measure
aHR
aHR
aOR
aOR
aHR
OR
OR
aHR
aOR
OR
aOR
7
7
8
7
8
6
5
8
7
5
7
aOR, adjusted OR; aHR, adjusted HR; CSHA-CFS, Chinese-Canadian Study of Health and Aging Clinical Frailty Scale; CSBA index, Conselice Study of Brain Aging index; LASA,
Longitudinal Aging Study Amsterdam frailty instrument; Recurrent falls, 2 or more falls; SOF, Study of Osteoporotic Fractures frailty index.
*Sample size of cohort actually used for frailty and fall analysis, or of entire cohort if not available.
y
Mean age of analytic sample if available, otherwise mean age of entire sample or age criterion for inclusion.
z
Number of methodological quality criteria met using the Newcastle-Ottawa scale for cohort studies (range: 0e9).
4
G. Kojima / JAMDA xxx (2015) 1e7
Fig. 2. Forest plots presenting effect of frailty and prefrailty on future fall risk according to OR (A: 6 studies, C: 5 studies including women) and HR (B: 4 studies). df, degrees of
freedom; fixed, fixed-effects model; IV, inverse variance; Random, random-effects model.
(pooled HR ¼ 1.14, 95% CI ¼ 0.95e1.36, P ¼ .15, c2 ¼ 2.16, df ¼ 2,
I2 ¼ 7%) (Figure 2B).
Subgroup analysis and meta-regression analysis
High heterogeneity was noted among the 7 studies presenting
ORs.12,13,15e17,19,20 Subgroup analyses were attempted based on age
and gender, 2 well-known factors associated with frailty,2,3 as well as
other factors including location (United States versus others), sample
size (n ! 1000 versus <1000), frailty criteria (original or modified
Fried phenotype versus others), outcome (any falls versus recurrent
falls), follow-up period (1 year versus more than 1 year), and frequency of fall monitoring (1 year or more versus less than 1 year).
Mean age, however, of the 7 studies was in a relatively narrow range
from 67.7 to 76.7 years old and not all studies presented mean age,16
thus subgroup analysis according to age was not performed. When 1
study 12 consisting of all men was excluded, a meta-analysis
G. Kojima / JAMDA xxx (2015) 1e7
incorporating the rest of the 6 studies including women (female
proportion 46.5%e100%)10,13e17 showed that I2 statistic reduced
considerably from 77% down to 17%. Pooled OR combining these 6
studies using a fixed-effects model was slightly decreased but was
statistically significant (pooled OR ¼ 1.65, 95% CI ¼ 1.53e1.79,
P < .001, c2 ¼ 6.00, df ¼ 5, I2 ¼ 17%) (Figure 2C). Other subgroup
analyses showed any subgroups including this all-men study12 had
high heterogeneity and any subgroups without had low heterogeneity (data not shown). Disparity in gender proportion was speculated to be an important moderator influencing future fall risk
according to frailty based on the results of the subgroup analyses as
well as the fact that gender disparity has been shown to be associated
with both falls and frailty.3,25 This possibility was further explored
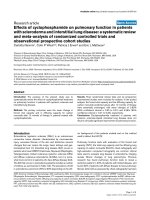
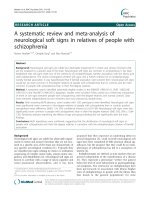
using meta-regression analysis. A random-effects meta-regression
model with the proportion of male individuals in each study as a
covariate demonstrated that higher male proportion was significantly
associated with higher future fall risk according to frailty
(coefficient ¼ 0.0079 per 1% increase in male proportion, SE ¼ 0.0027,
P ¼ .003, goodness of fit P ¼ .08). The male proportion of cohorts
explained 63% of the between-study variance (R2 analog ¼ 0.63).
Figure 3 shows a bubble plot with a meta-regression line, which
suggests that higher male proportion is associated with higher future
fall risk according to frailty.
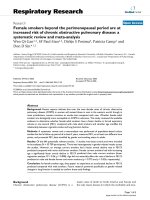
Publication bias assessment
Funnel plots were illustrated for 2 study groups presenting ORs
and HRs separately. Although difficult to interpret because of the
small number of studies, especially for studies providing HRs or
prefrailty outcomes, visual inspection of the funnel plots suggests the
presence of publication bias; asymmetry was noted in both plots with
more studies with results favoring higher future fall risk by frailty
(Figures 4A and 4B).
5
Discussion
This is, to the best of my knowledge, the first study to perform
systematic review and meta-analyses on future fall risk associated
with frailty among community-dwelling older people. Eleven studies
with a total of 68,723 individuals presenting ORs and HRs as fall risk
measures for frailty status were identified by this systematic review.
A meta-analysis combining their findings consistently showed frailty
was associated with higher future fall risk despite different frailty
criteria and effect measures used. Substantial heterogeneity was
observed across the studies presenting ORs and difference in gender
proportion of each study was considered to be a possible moderator
causing the heterogeneity based on the findings of the subgroup
analysis and meta-regression analysis.
Two studies 23,24 could not be included in the meta-analyses
because, instead of comparing frailty versus nonfrailty, they evaluated frailty status in a grade manner using the frailty index. The frailty
index, a continuous score ranging from 0 to 1, is another wellvalidated approach to operationalize frailty based on a cumulative
deficit model and has been shown to have a better discriminative
ability to identify mortality risk than Fried phenotype criteria. 26
A Canadian study with 3985 women aged 55 years and older
showed that the frailty index at baseline was significantly associated
with increased risk of future falls during the third year (adjusted
OR ¼ 1.02 per 0.01 increase in the frailty index, P < .001) and the area
under the receiver operating characteristic curve was 0.69 (95%
CI ¼ 0.67e0.71).24 Another study including 3257 Chinese communitydwellers aged 55 years and older from the Beijing Longitudinal Study
of Aging divided the cohort into 5 groups based on the frailty index
( 0.03, 0.03e0.10, 0.10e0.20, 0.21e0.5, and >0.5) and showed that a
higher level of frailty was significantly associated with future fall risk
(adjusted OR ¼ 1.54 per increase in frailty level, 95% CI ¼ 1.34e1.76).23
The findings of these studies using a different approach of the frailty
Fig. 3. Bubble plot with fitted meta-regression line for the association between OR of future fall risk for frailty and proportion of male individuals.
6
G. Kojima / JAMDA xxx (2015) 1e7
Fig. 4. Funnel plots for future fall risk according to frailty (A: studies presenting ORs, B: studies presenting HRs).
index further support the association between frailty and higher
future fall risk shown in this meta-analysis.
Higher fall risk associated with frailty was observed in studies
including more men in this systematic review. Although women are
reported as more likely to be frail3 and more likely to fall27 than men,
mechanisms underlying this finding are not clear. Gender disparity in
frailty-associated fall risk could be related to differences in health
conditions, physical components, lifestyle factors, behavioral patterns, or mixed. Among these, gender difference in physical activity
may explain the higher fall risk in frail men. Compared with women,
men are more physically active28 and therefore may be more likely to
encounter situations in which frailty is influential to their maintaining balance, stability, and coordination. In such situations, men’s
relatively higher center of gravity and heavier weight may predispose
them further to higher risk of falling associated with frailty.
Falling as a research outcome is difficult to investigate among
older people because it mostly relies on self-report information and
therefore its accuracy may be compromised by memory disorders,
especially when a fall monitoring covers a long period of time.
Therefore, it is important to recognize how falls are identified.
Various methodologies were used across the studies to obtain fall
information from participants. Three studies interviewed participants
for incident falls,15,19,20 and other methods included post card,12,13
calendar,11,14 and telephone.13,17 Three studies did not provide clear
explanation of how falls were reported.10,16,18
Among the studies using original or modified Fried phenotype
criteria, all but the original study modified 1 or more of the original 5
criteria components according to data availability or study designs.
However, it is not the case only with these included studies in this
review but also with most other published studies.29 The modification of the original criteria can potentially result in biasing the study
findings.28
Four studies examined any falls or incident first fall10,15,17,18 and
7 studies examined recurrent falls or incident second falls.11e14,16,19,20 They are theoretically different outcomes although
these outcomes were treated as the same fall outcome when metaanalyzed in this review because of the relatively small number of
studies if stratified. Especially results based on recurrent falls may
be affected by nature and consequences of the first fall. For example,
a serious or injurious first fall may cause disabilities or fear of
falling, which can lead to less mobility or physical activities, eventually limiting chances of second falls. Pooled risk estimates among
studies examining any or incident first fall and those examining
recurrent or incident second falls were calculated in the metaanalysis; pooled OR ¼ 2.05 (95% CI ¼ 1.46e2.89, P < .0001, from 2
studies15,17 using fixed-effects model) and pooled OR ¼ 1.77 (95%
CI ¼ 1.28e2.43, P ¼ .0005, from 5 studies12,13,16,19,20 using randomeffects model), respectively.
This study has some limitations. First, a few of the included
studies15,17,19 did not present adjusted OR but only crude ORs, which
were incorporated into the meta-analyses. However, because of
possible confounding effects on frailty and falls, especially by age and
gender as well as other factors, adjusted ORs would better describe
the true associations. Excluding these studies in the meta-analysis did
not change pooled OR or I2 statistics substantially (pooled OR ¼ 1.80,
95% CI ¼ 1.27e2.57, P ¼ .001, df ¼ 3, I2 ¼ 88%). Second, publication
bias favoring studies with positive results was suggested by visual
inspection of funnel plots and therefore pooled estimates may be
overestimated.
One of this study’s strengths is that it is the first systematic review
and meta-analysis on associations between frailty and future fall risk
among community-dwelling older people. Another strength is its
robust methodology, including extensive and reproducible systematic
reviews using 6 databases and assessments of methodological quality,
publication bias, and heterogeneity across the included studies. In
addition, subgroup analyses and meta-regression analyses were
performed to investigate possible causes of the heterogeneity.
Despite different frailty criteria and methodology used by the
included studies, the meta-analyses consistently demonstrated frailty
as a significant predictor of future falling.
In summary, this study provides the first evidence of the
association between frailty and higher future fall risk among
community-dwelling older people based on the comprehensive systematic review and meta-analyses. Subgroup and meta-regression
analyses suggest a gender disparity in future fall risk associated
with frailty.
Given the detrimental effects of falls in older people, it is important for health care providers, especially geriatricians and those who
treat elderly individuals, to recognize frailty as a risk factor for future
falling. Future research should be directed to whether treating or
reversing frailty should prevent falling among frail elderly and also to
investigation of mechanisms underlying the gender disparity in the
future fall risk according to frailty, which may lead to further understanding frailty in relation to falls and developing more effective
interventions for both frailty and falls.
References
1. Mitnitski AB, Graham JE, Mogilner AJ, et al. Frailty, fitness and late-life
mortality in relation to chronological and biological age. BMC Geriatr
2002;2:1.
2. Clegg A, Young J, Iliffe S, et al. Frailty in elderly people. Lancet 2013;381:
752e762.
3. Collard RM, Boter H, Schoevers RA, et al. Prevalence of frailty in communitydwelling older persons: A systematic review. J Am Geriatr Soc 2012;60:
1487e1492.
G. Kojima / JAMDA xxx (2015) 1e7
4. Centers for Disease Control and Prevention. Falls among older adults: An
overview. 2013. Available at: />falls/adultfalls.html. Accessed April 29, 2015.
5. Parry SW, Deary V, Finch T, et al. The STRIDE (Strategies to Increase confidence, InDependence and Energy) study: Cognitive behavioural therapybased intervention to reduce fear of falling in older fallers living in the
communitydstudy protocol for a randomised controlled trial. Trials 2014;
15:210.
6. Centers for Disease Control and Prevention. Costs of falls among older adults.
2015. Available at: />fallcost.html. Accessed April 29, 2015.
7. Tinetti ME, Speechley M, Ginter SF. Risk factors for falls among elderly persons
living in the community. N Engl J Med 1988;319:1701e1707.
8. National Institute for Health and Care Excellence (UK). NICE clinical guideline,
falls: Assessment and prevention of falls in older people. 2013. Available at:
Accessed April 29, 2015.
9. Public Health Agency of Canada (Canada). You CAN Prevent Falls! 2011.
Available at: />injury-blessure/prevent-eviter/index-eng.php. Accessed April 29, 2015.
10. Fried LP, Tangen CM, Walston J, et al. Frailty in older adults: Evidence for a
phenotype. J Gerontol A Biol Sci Med Sci 2001;56:M146eM156.
11. de Vries OJ, Peeters GM, Lips P, et al. Does frailty predict increased risk of falls
and fractures? A prospective population-based study. Osteoporos Int 2013;24:
2397e2403.
12. Ensrud KE, Ewing SK, Cawthon PM, et al. A comparison of frailty indexes for the
prediction of falls, disability, fractures, and mortality in older men. J Am Geriatr
Soc 2009;57:492e498.
13. Ensrud KE, Ewing SK, Taylor BC, et al. Frailty and risk of falls, fracture, and
mortality in older women: The study of osteoporotic fractures. J Gerontol A Biol
Sci Med Sci 2007;62:744e751.
14. Kiely DK, Cupples LA, Lipsitz LA. Validation and comparison of two
frailty indexes: The MOBILIZE Boston Study. J Am Geriatr Soc 2009;57:
1532e1539.
15. Samper-Ternent R, Karmarkar A, Graham J, et al. Frailty as a predictor of falls in
older Mexican Americans. J Aging Health 2012;24:641e653.
16. Tom SE, Adachi JD, Anderson FA Jr, et al. Frailty and fracture, disability, and
falls: A multiple country study from the global longitudinal study of osteoporosis in women. J Am Geriatr Soc 2013;61:327e334.
7
17. Wu TY, Chie WC, Yang RS, et al. Risk factors for single and recurrent falls: A
prospective study of falls in community dwelling seniors without cognitive
impairment. Prev Med 2013;57:511e517.
18. Bandeen-Roche K, Xue QL, Ferrucci L, et al. Phenotype of frailty: Characterization in the women’s health and aging studies. J Gerontol A Biol Sci Med Sci
2006;61:262e266.
19. Forti P, Rietti E, Pisacane N, et al. A comparison of frailty indexes for prediction
of adverse health outcomes in an elderly cohort. Arch Gerontol Geriatr 2012;
54:16e20.
20. Sheehan KJ, O’Connell MD, Cunningham C, et al. The relationship between
increased body mass index and frailty on falls in community dwelling older
adults. BMC Geriatr 2013;13:132.
21. Stroup DF, Berlin JA, Morton SC, et al. Meta-analysis of observational studies in
epidemiology: A proposal for reporting. Meta-analysis of observational studies
in epidemiology (MOOSE) group. JAMA 2000;283:2008e2012.
22. Higgins JP, Thompson SG, Deeks JJ, et al. Measuring inconsistency in metaanalyses. BMJ 2003;327:557e560.
23. Fang X, Shi J, Song X, et al. Frailty in relation to the risk of falls, fractures, and
mortality in older Chinese adults: Results from the Beijing Longitudinal Study
of Aging. J Nutr Health Aging 2012;16:903e907.
24. Li G, Ioannidis G, Pickard L, et al. Frailty index of deficit accumulation and falls:
Data from the Global Longitudinal Study of Osteoporosis in Women (GLOW)
Hamilton cohort. BMC Musculoskelet Disord 2014;15:185.
25. Stevens JA, Sogolow ED. Gender differences for non-fatal unintentional fall
related injuries among older adults. Inj Prev 2005;11:115e119.
26. Rockwood K, Andrew M, Mitnitski A. A comparison of two approaches to
measuring frailty in elderly people. J Gerontol A Biol Sci Med Sci 2007;62:
738e743.
27. Deandrea S, Lucenteforte E, Bravi F, et al. Risk factors for falls in communitydwelling older people: A systematic review and meta-analysis. Epidemiology
2010;21:658e668.
28. Centers for Disease Control and Prevention. Facts about physical activity. 2014.
Available at: Accessed
April 29, 2015.
29. Theou O, Cann L, Blodgett J, et al. Modifications to the frailty phenotype
criteria: Systematic review of the current literature and investigation of 262
frailty phenotypes in the Survey of Health, Ageing, and Retirement in Europe.
Ageing Res Rev 2015;21:78e94.