Highly sensitive and accurate screening of 40 dyes in soft drinks by liquid chromatography–electrospray tandem mass spectrometry
Bạn đang xem bản rút gọn của tài liệu. Xem và tải ngay bản đầy đủ của tài liệu tại đây (665.21 KB, 6 trang )
Journal of Chromatography B, 879 (2011) 1813–1818
Contents lists available at ScienceDirect
Journal of Chromatography B
journal homepage: www.elsevier.com/locate/chromb
Short communication
Highly sensitive and accurate screening of 40 dyes in soft drinks by liquid
chromatography–electrospray tandem mass spectrometry
Feng Feng a , Yansheng Zhao a , Wei Yong a , Li Sun a , Guibin Jiang b , Xiaogang Chu a,∗
a
b
Institute of Food Safety, Chinese Academy of Inspection and Quarantine, Beijing 100123, China
State Key laboratory of Environmental Chemistry and Eco-toxicology, Research Center for Eco-Environmental Sciences, Chinese Academy of Sciences, Beijing 100085, China
a r t i c l e
i n f o
Article history:
Received 13 December 2010
Accepted 12 April 2011
Available online 20 April 2011
Keywords:
Dyes
Solid-phase extraction
HPLC
ESI-MS/MS
Soft drink
a b s t r a c t
A method combining solid phase extraction with high performance liquid chromatography–electrospray
ionization tandem mass spectrometry was developed for the highly sensitive and accurate screening of
40 dyes, most of which are banned in foods. Electrospray ionization tandem mass spectrometry was used
to identify and quantify a large number of dyes for the first time, and demonstrated greater accuracy
and sensitivity than the conventional liquid chromatography–ultraviolet/visible methods. The limits of
detection at a signal-to-noise ratio of 3 for the dyes are 0.0001–0.01 mg/L except for Tartrazine, Amaranth,
New Red and Ponceau 4R, with detection limits of 0.5, 0.25, 0.125 and 0.125 mg/L, respectively. When
this method was applied to screening of dyes in soft drinks, the recoveries ranged from 91.1 to 105%. This
method has been successfully applied to screening of illegal dyes in commercial soft drink samples, and
it is valuable to ensure the safety of food.
© 2011 Elsevier B.V. All rights reserved.
1. Introduction
Organic aromatic dyes are often added to food to compensate
for the loss of natural colors, which are destroyed during processing
and storage, and to provide the desired colored appearance [1].
Although more and more evidence in recent years indicates that
the abuse of dyes may cause cancer [2], many kinds of dyes are
still widely used because of their low price, high effectiveness and
excellent stability [3].
To protect public health, many countries have established strict
regulations for the allowable kinds and concentrations of dyes [4,5].
However, some food producers may still add banned dyes to their
products putting sensitive population in health risk. Therefore, it
is necessary to develop a sensitive and accurate method to screen
banned dyes in foods to ensure food safety.
Various methods for the determination of dyes in foods have
been reported, including capillary electrophoresis [6–10], thinlayer chromatography [11], ion-pair chromatography [12,13],
high performance liquid chromatography (HPLC) with ultraviolet/visible (UV/Vis) or diode-array detector (DAD) detection
[14–25] and liquid chromatography–mass spectrometry (LC–MS)
[26–32]. HPLC coupled with UV/Vis or DAD detection is the most
commonly used technique because dyes absorb strongly at the
ultraviolet and/or visible wavelength. However, these methods
∗ Corresponding author. Tel.: +86 10 85791012; fax: +86 10 85770775.
E-mail address: (X. Chu).
1570-0232/$ – see front matter © 2011 Elsevier B.V. All rights reserved.
doi:10.1016/j.jchromb.2011.04.014
are not suitable for simultaneous screening large number of dyes
because the multiple isomers and structural analogs of dyes are
difficult to separate. Besides, false positives caused by complex
food matrices are frequently encountered [6,18]. To solve these
problems, the selective detection by liquid chromatography tandem mass spectrometry (LC–MS/MS) has been used [26–32] for it
can provide detailed structural information. In the selective reaction monitoring (SRM) mode, the specific MS transition (precursor
ion → product ion) can exclude the presence of interference substances, improving the accuracy of the quantification. In spite of
the potential value of the application, to our knowledge, no method
based on tandem mass spectrometry has been applied to simultaneous screening of large numbers of dyes in foods.
In this work, we developed a highly sensitive and accurate HPLCMS/MS method to simultaneously screen 40 illegal dyes in soft
drinks. The composition of mobile phases and the mass spectrometric parameters for each dye were optimized in detail. This method
has been successfully applied to screening of illegal dyes in soft
drink samples from local market.
2. Experimental
2.1. Chemicals and reagents
Tartrazine, Amaranth, Ponceau 4R, Indigo Carmine, Carminic
Acid, Sunset Yellow FCF, Allura Red AC, Acid Red 1, Acid Yellow 17,
Wool Green S, Acid Red 13, Light Green SF, Ponceau 2R, Azorubine,
Guinea Green B, Acid Green 25, Acid Violet 17, Erythrosine, Ben-
1814
F. Feng et al. / J. Chromatogr. B 879 (2011) 1813–1818
Table 1
The optimum parameters and selected typical fragment ions for 40 dyes determination.
No
Analyte
Molecular formula
Color index number
E number
Precursor ion (m/z)
Product ion (m/z)
1
2
3
4
5
6
7
8
9
10
11
12
13
14
15
16
17
18
19
20
21
22
23
24
25
26
27
28
29
30
31
32
33
34
35
36
37
38
39
40
Tartrazine
New Red
Amaranth
Ponceau 4R
Indigo Carmine
Carminic Acid
Sunset Yellow FCF
Allura Red AC
Acid Red 1
Wool Green S
Acid Red 13
Light Green SF
Ponceau 2R
Azorubine
Fast Green FCF
Ponceau SX
Brilliant Blue FCF
Quinoline Yellow
Ponceau 3R
Uranine
Orange II
Sulforhodamine B
Acid Black 1
Patent Blue V
Alizarin Yellow GG
Guinea Green B
Metanil Yellow
Eosin Y
Acid Green 25
Acid Violet 17
Erythrosine
Bengal Rose B
Acid Yellow 9
Acid Yellow 17
Chrysoidine
Basic Flavine O
Patent Green
Phloxine B
Rhodamine B Chloride
Methyl Yellow
C16 H9 N4 Na3 O9 S2
C18 H12 N3 Na3 O11 S3
C20 H11 N2 Na3 O10 S3
C20 H11 N2 Na3 O10 S3
C16 H8 N2 Na2 O8 S2
C22 H20 O13
C16 H10 N2 Na2 O7 S2
C18 H14 N2 Na2 O8 S2
C18 H13 N3 Na2 O8 S2
C27 H25 N2 NaO7 S2
C20 H12 N2 Na2 O7 S2
C37 H34 N2 Na2 O9 S3
C18 H14 N2 Na2 O7 S2
C20 H12 N2 Na2 O7 S2
C37 H34 N2 Na2 O10 S3
C18 H14 N2 Na2 O7 S2
C37 H34 N2 Na2 O9 S3
C18 H9 NNa2 O8 S2
C19 H16 N2 Na2 O7 S2
C20 H10 Na2 O5
C16 H11 N2 NaO4 S
C27 H29 N2 NaO7 S2
C22 H14 N6 Na2 O9 S2
C54 H62 CaN4 O14 S4
C13 H8 N3 NaO5
C37 H35 N2 NaO6 S2
C18 H14 N3 NaO3 S
C20 H6 Br4 Na2 O5
C28 H20 N2 Na2 O8 S2
C41 H44 N3 O6 S2 Na
C20 H6 I4 Na2 O5
C20 H2 Cl4 I4 Na2 O5
C12 H11 N3 O6 S2
C16 H10 Cl2 N4 Na2 O7 S2
C12 H13 ClN4
C17 H22 N3 Cl
C37 H34 ClN2 NaO6 S2
C20 H2 Br4 Cl4 Na2 O5
C28 H31 ClN2 O3
C14 H15 N3
19,140
E102
16,185
16,255
73,015
75,470
15,985
16,035
18,050
44,090
16,045
42,095
16,150
14,720
42,053
14,700
42,090
47,005
16,155
45,350
15,510
45,100
20,470
42,051
14,025
42,085
13,065
45,380
61,570
42,650
45,430
45,440
13,015
18,965
11,320
41,000
42,100
45,410
45,170
11,020
E123
E124
E132
E120
E110
E129
E128
E142
467.2
544.2
537.2
537.2
421.1
491.2
407.1
451.2
232.1
553.3
457.1
373.2
435.2
457.1
763.3
435.2
747.4
352.2
449.2
331.1
327.2
557.2
571.2
559.2
286.0
667.4
352.2
646.9
577.3
738.6
834.8
972.7
358.4
507.0
213.3
268.5
703.4
786.7
443.4
226.3
198.1a 423.1
359.2a 464.2
317.0a 457.1
302.0a 429.2
341.1a 261.1
447.3a 327.1
207.1a 327.1
207.1a 371.1
179.0a 291.2
511.3a 496.3
206.8a 377.2
497.4a 170.0
302.1a 355.1
377.2a 171.0
683.5a 421.6
355.1a 171.0
170.1a 561.2
288.2a 244.2
369.2a 302.1
286.1a 243.2
171.1a 156.1
513.2a 433.4
507.3a 479.1
435.3a 479.5
242.2a 156.1
170.1a 497.4
156.0a 260.2
523.2a 443.1
497.3a 417.4
170.0a 568.4
663.0a 537.0
674.8a 893.0
157.0a 109.0
108.1a 173.0
121.1a 196.2
147.1a 252.3
517.2a 533.3
742.8a 563.8
399.3a 355.3
77.1a 120.1
E122
E133
E104
E131
E127
DP (V)
−80
−80
−160
−131
−145
−80
−152
−80
−65
−80
−130
−80
−80
−145
−80
−80
−80
−60
−80
−80
−80
−80
−80
−60
−57
−80
−80
−60
−80
−60
−60
−80
80
160
80
80
80
60
40
80
CE (V)
ESI mode
−43 −22
−39 −35
−45 −35
−34 −28
−42 −54
−30 −37
−45 −30
−47 −32
−15 −22
−34 −45
−44 −34
−34 −35
−40 −35
−33 −37
−50 −66
−28 −35
−79 −61
−35 −35
−37 −39
−30 −34
−34 −40
−58 −62
−34 −37
−62 −45
−24 −31
−65 −54
−42 −36
−44 −45
−52 −56
−67 −55
−52 −54
−50 −37
37 52
60 48
30 28
42 44
70 66
73 88
60 83
32 46
ESI−
ESI−
ESI−
ESI−
ESI−
ESI−
ESI−
ESI−
ESI−
ESI−
ESI−
ESI−
ESI−
ESI−
ESI−
ESI−
ESI−
ESI−
ESI−
ESI−
ESI−
ESI−
ESI−
ESI−
ESI−
ESI−
ESI−
ESI−
ESI−
ESI−
ESI−
ESI−
ESI+
ESI+
ESI+
ESI+
ESI+
ESI+
ESI+
ESI+
DP: declustering potential; CE: collision energy.
a
Quantification ion.
gal Rose B, Fast Green FCF and Ponceau SX were purchased from
Fluka (Buchs, Switzerland). Basic Flavine O, Patent Green, Phloxine B, Rhodamine B Chloride, Methyl Yellow, Brilliant Blue FCF,
Quinoline Yellow, Ponceau 3R, Uranine, Orange II, Chrysoidine and
Sulforhodamine B were obtained from Sigma–Aldrich (St. Louis,
MO, USA). Acid Black 1, Patent Blue V, Alizarin Yellow GG, Metanil
Yellow, Eosin Y and Acid Yellow 9 were obtained from Tokyo Kasei
Kogyo (Tokyo, Japan). New Red was purchased from Dr. Ehrenstorfer (Augsburg, Germany). All of the stock solutions (1000 g/mL)
were dissolved in water except Alizarin Yellow GG, Acid Yellow 9,
Chrysoidine, Basic Flavine O, Metanil Yellow, Methyl Yellow and
Quinoline Yellow which were dissolved in methanol.
HPLC grade methanol and acetonitrile were purchased from
Fisher (Pittsburgh, PA, USA). The ultrapure water was prepared by
the Milli-Q water system (Millipore, Bedford, MA, USA). Analytical
grade ammonium formate and formic acid were purchased from
Sigma–Aldrich (St. Louis, MO, USA).
2.2. Sample collection and preparation
Twenty soft drink samples were purchased from local markets.
Sample preparation was performed as described by Yoshioka et al.
[5] with slight modifications. For each sample, 10 g was weighed
accurately. If carbonated, the sample was degassed by sonication
(5 min). In the case of alcoholic beverages, ethanol in the sample
was evaporated on a hot plate (60 ◦ C) and the evaporated vol-
ume was filled with water. The sample solution was adjusted to
a pH of approximately 3–3.5 with formic acid prior to solid phase
extraction (SPE) on a HLB cartridge (500 mg, Waters, Milford, MA).
The cartridges were first preconditioned with 5.0 mL methanol followed by 5.0 mL acidified water. The samples were loaded through
the cartridges at a rate of less than 3.0 mL/min. The cartridges were
then rinsed with 5.0 mL of 15% (v/v) methanol/water solution (the
water contained 0.1% formic acid) and were finally eluted with
5.0 mL methanol containing 0.1% (v/v) ammonia. The eluate was
dried under a gentle nitrogen gas flow and was reconstituted to a
final volume of 2 mL with water/methanol (9:1, v/v). The solution
was filtered through a 0.22 m nylon membrane prior to LC-MS/MS
analysis.
2.3. Instrumentation
LC coupled with electrospray ionization–tandem mass spectrometry (ESI-MS/MS) was used for screening. The LC system was
Agilent (Palo Alto, CA, USA) 1200 SL Series equipped with a binary
pump, vacuum degasser, autosampler and thermostatic column
compartment. The tandem mass spectrometer was an API 5000
triple quadrupole from Applied Biosystems (Darmstadt, Germany).
Applied Biosystems Analyst software (version 1.5) was used for
system operation and data analysis.
Separations were performed using an Ultimate XB-C18 column (100 × 2.1 mm i.d., 3.0 m) (Welch Materials, Maryland, USA).
F. Feng et al. / J. Chromatogr. B 879 (2011) 1813–1818
1815
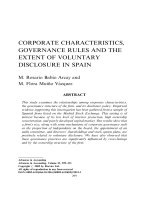
Fig. 1. HPLC-ESI-MS/MS chromatograms from a 40-dye mixed standard solution (each dye at 0.5 g/mL). The sequence number 1–40 corresponds to dye number in Table 1.
The mobile phase system consisted of A (20 mM ammonium formate buffer containing 0.1% formic acid (v/v), pH 3.8) and B
(methanol/acetronitrile, 7/3) using a gradient elution of 10% B at
0–3 min, 10–50% B at 3–12 min, 50% B at 12–25 min, and 85% B at
25–32 min. The flow rate was 0.3 mL/min, and the column temperature was 35 ◦ C. The injection volume was 2 L. The eluate from the
HPLC column was introduced directly into the mass spectrometer
without flowsplitting.
The entire eluate was ionized simultaneously in positive and
negative ionization mode, and monitored by SRM. Mass selection
for the Q1 and Q3 analysers was set on unit resolution. Nitrogen was
used as ion source gas 1, ion source gas 2, curtain gas and collision
gas, with flow rates controlled at 65, 60, 25 and 6 psi, respectively. Ion electrospray voltage was 5500 V for positive ionization
mode and 4500 V for negative ionization mode. The ion source
temperature was 500 ◦ C. The optimum declustering potential (DP),
collision energy (CE) and representative product ions for these 40
dyes were optimized by flow injection analysis (FIA) using a stan-
dard solution of these dyes, and their optimum values are listed in
Table 1.
2.4. Method validation
Quantitative analysis was carried out by the external standard
calibration method. The calibration solutions were prepared by
appropriate dilution of intermediate mixed standard solutions in
water to concentrations between 0.0015 and 10 g/mL. The sensitivity of the method was evaluated by estimating the limit of
detection (LOD) at a signal to noise ratio of 3. The intra-day and
inter-day variability was utilized to evaluate method precision
(n = 3).
For extraction recovery calculations, accurate amounts of 40
standards were added to 10 g of blank samples. Each dye was spiked
at 50 times of the LOD, then filtrated and analyzed as described
above. The matrix effect (ion suppression or enhancement) was
investigated by adding the standard mixture into soft drinks that
1816
F. Feng et al. / J. Chromatogr. B 879 (2011) 1813–1818
had been pretreated and filtered; then the peak area was compared
with the same concentration of diluted standard solution.
3. Results and discussion
3.1. SPE fractionation
It has been proved that carbonated drinks without pulp could
be analyzed directly after filtration. However, SPE cleanup was
still necessary for some fruit drinks or juices. Traditionally used
for dye cleanup, polyamide column, however, does not retain
xanthenes dyes such as erythrosine [21,23]. In this study, a HLB
SPE column was chosen for its dual functionality: hydrophilic
N-vinylpyrrolidone and lipophilic divinylbenzene. The former provides a special “polar hook” for enhanced capture of polar dyes, and
the latter provides a better retention for weak polar dyes. After optimization, all the dyes including xanthene-dyes were retained well
on the column even after the column was rinsed with 5.0 mL of 15%
(v/v) methanol/water solution (the water containing 0.1% formic
acid), and the dyes were eluted completely with 5.0 mL methanol
containing 0.1% (v/v) ammonia.
3.2. LC–MS/MS method development
Traditional methods use HPLC coupled with UV/Vis or DAD
detection for determining dyes in foods [20–22]. However, multiple
isomers and structural analogs of the dyes are difficult to separate
and determine. For instance, Yoshioka et al. used a Zorbax Eclipse
XDB-C18 Rapid Resolution HT (50 mm × 4.6 mm, 1.8 m) column
to separate 40 dyes in food, but many dyes were overlapped [5].
Although the overlapped peaks can be quantified by diode-array
detectors, similar absorption of overlapped peaks renders quantification inaccurate.
The goal of this study was to develop a highly sensitive and accurate HPLC-ESI-MS/MS method to simultaneously screen 40 illegal
dyes. The optimum mass spectrometric parameters for the identification and quantification of the 40 dyes were first obtained after
analyzing the dyes by flow injection analysis (FIA) respectively
(see Table 1). The FIA results demonstrated that 32 dyes could be
determined in the negative ionization mode, and the rest 8 were
appropriate for determination in the positive ionization mode.
Three columns were tested to obtain the best resolution for
these dyes, including Capcell Pak C18 MG Ш (75 × 2.1 mm, 3 m),
Phenomenex Luna C18 (100 × 4.6 mm, 2.6 m), and Ultimate XBC18 (100 × 2.1 mm i.d., 3.0 m). After optimizing the mobile phase
conditions, the results showed that the Ultimate XB-C18 column
achieved the best resolution when a mixture of acetonitrilemethanol-ammonium formate buffer was used as the mobile
phase. An acetonitrile-methanol mixture was chosen as the organic
phase because this mixture achieved a better resolution than
methanol [19]. Two ratios of methanol/acetonitrile (7:3 vs. 3:7, v/v)
were tested. The former resulted in better resolution. Fig. 1 shows
adequate separation of the 40 dyes under the optimum condition
in 30 min.
Each dye was analyzed using two SRM transitions in order to
improve accuracy. One transition was used for qualification and
quantification while the other was used as a supplemental data for
qualification. Some isomers with the same SRM transitions could be
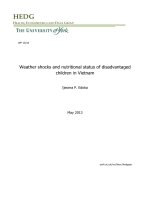
identified and quantified by the difference in another SRM transition. As shown in Fig. 2A, the retention times of Azorubine and Acid
Red 13 were similar, and one of their SRM transitions was identical (m/z 457.1 → 377.2). It was difficult to distinguish the two dyes
if we chose only the transition of m/z 457.1 → 377.2 as the identified and quantified ion. However, because of different locations
of the hydroxyl moiety in the dye structure, the product ion spec-
Fig. 2. (A)HPLC-ESI-MS/MS chromatograms of Azorubine (m/z 457.1 → 171.0, m/z
457.1 → 377.2) and Acid Red 13 (m/z 457.1 → 206.8, m/z 457.1 → 377.2) monitored
in SRM mode. (B) Product ion spectra of Azorubine and Acid Red 13 obtained in
product ion scan mode.
tra were different (m/z 457.1 → 171.0 vs. m/z 457.1 → 206.8) (see
Fig. 2B). Although it is uncertain why Azorubine produced fragment ion of m/z 171.0 but not m/z 206.8 or why Acid Red 13 could
produce fragment ion of m/z 206.8 but not m/z 171.0, the different
SRM transitions provided a simple and reliable distinction. Guinea
Green B and Patent Green showed two peaks in their extracted ion
chromatograms (see Fig. 1, transitions No. 26 and No. 37). The peak
area ratios of each dye in two SRM transitions were similar (data
not shown). These observations suggest that both Guinea Green B
and Patent Green are composed of a mixture of isomers. The two
dyes were quantified using the sum of two peaks.
3.3. Method validation
Method precision was examined by intra-day and inter-day
peak area variation (less than 5%). The matrix effect was investigated by comparing the peak areas of standards dissolved in
water/methanol (9:1, v/v) to standards spiked into matrices at
the same concentration. Our results demonstrated that peak areas
varied less than 5%, suggesting a negligible matrix effect on quantification.
Linear dynamic range, correlation coefficient (r), limit of detection and recovery for the method are listed in Table 2. Excellent
linearity for each dye was achieved with a linear regression coefficient of r ≥ 0.9990 (Table 2). The recoveries were in the range of
91.1–105%.
F. Feng et al. / J. Chromatogr. B 879 (2011) 1813–1818
1817
Table 2
Linear range, correlation coefficients, limits of detection, recoveries and relative standard deviations (RSDs) of dyes were determined. The recoveries were evaluated by
controlling the fortification level of each dye in negative soft drink samples at 50 times the limit of detection (n = 3).
Peak
Analyte
RT (min)
1
2
3
4
5
6
7
8
9
10
11
12
13
14
15
16
17
18
19
20
21
22
23
24
25
26
27
28
29
30
31
32
33
34
35
36
37
38
39
40
Tartrazine
New Red
Amaranth
Ponceau 4R
Indigo Carmine
Carminic Acid
Sunset Yellow FCF
Allura Red AC
Acid Red 1
Wool Green S
Acid Red 13
Light Green SF
Ponceau 2R
Azorubine
Fast Green FCF
Ponceau SX
Brilliant Blue FCF
Quinoline Yellow
Ponceau 3R
Uranine
Orange II
Sulforhodamine B
Acid Black 1
Patent Blue V
Alizarin Yellow GG
Guinea Green B
Metanil Yellow
Eosin Y
Acid Green 25
Acid Violet 17
Erythrosine
Bengal Rose B
Acid Yellow 9
Acid Yellow 17
Chrysoidine
Basic Flavine O
Patent Green
Phloxine B
Rhodamine B Chloride
Methyl Yellow
2.80
3.43
5.13
8.68
8.92
9.25
9.50
10.98
11.34
12.23
12.87
13.52
13.69
13.77
14.02
14.32
14.37
14.46
14.82
17.17
18.31
18.70
19.50
19.72
22.69
22.97
24.33
26.35
27.21
27.75
27.76
28.20
3.39
11.23
14.44
16.94
24.33
27.89
28.01
29.23
Linear range (mg L−1 )
1.25–10
1.25–10
1.25–10
1.25–10
0.031–0.5
0.015–0.50
0.030–0.50
0.015–0.50
0.015–0.50
0.0030–0.50
0.031–0.50
0.0015–0.50
0.007–0.50
0.030–0.50
0.0075–0.50
0.0015–0.50
0.0075–0.50
0.0075–0.50
0.0015–0.50
0.0015–0.50
0.0015–0.25
0.0015–0.50
0.015–0.50
0.0015–0.50
0.0015–0.063
0.0075–0.50
0.0015–0.25
0.015–0.50
0.0015–0.50
0.015–0.500
0.0015–0.50
0.0075–0.5
0.015–0.5
0.0075–0.50
0.0015–0.031
0.0015–0.063
0.0015–0.5
0.0030–0.5
0.0015–0.031
0.0075–0.125
The limits of detection (S/N = 3) of all analyzed dyes were
0.0001–0.01 mg/L except Tartrazine, Amaranth, New Red and Ponceau 4R which were 0.5, 0.25, 0.125 and 0.125 mg/L respectively
(see Table 2). Comparing with the detection limits reported in literatures [5,7,22,25–28], the detection sensitivity was improved more
than 10 times (see Table S1, Supporting information).
R
LOD (mg L−1 )
Recovery (%)
RSD (%)
0.9990
0.9997
0.9992
0.9996
0.9997
0.9995
0.9993
0.9993
0.9998
0.9990
0.9990
0.9995
0.9992
0.9997
0.9997
0.9999
0.9997
0.9997
0.9998
0.9999
0.9999
0.9995
0.9995
0.9999
0.9996
0.9998
0.9997
0.9992
0.9999
0.9990
0.9995
0.9998
0.9998
0.9992
0.9996
0.9990
0.9990
0.9998
0.9990
0.9996
0.5
0.125
0.25
0.125
0.010
0.003
0.010
0.005
0.006
0.001
0.008
0.0005
0.002
0.010
0.002
0.0004
0.002
0.001
0.0005
0.0001
0.0001
0.0004
0.003
0.0003
0.0001
0.002
0.0001
0.004
0.0002
0.0005
0.0004
0.002
0.005
0.002
0.0001
0.0001
0.0004
0.0008
0.0001
0.001
97.7
91.3
96.5
99.8
94.9
92.1
95.9
92.4
96.3
105
101
96.8
99.4
102
96.6
91.5
96.6
91.1
96.5
94.8
93.7
98.9
103
99.9
98.5
102
103
104
91.8
92.4
105
91.2
95.4
93.2
92.1
101
99.4
99.1
97.8
93.4
5.9
7.1
7.3
3.4
5.4
6.1
3.2
6.7
2.1
4.3
5.4
3.5
2.7
4.3
3.5
5.4
4.2
2.1
4.6
5.2
5.1
3.1
1.2
0.5
2.3
3.1
2.4
4.6
6.7
6.2
2.1
3.4
4.5
3.4
4.3
3.2
2.3
3.4
3.2
2.1
3.4. Application to real samples
In China, only 10 dyes are permitted to be added to soft drinks
(including Tartrazine, Allura Red AC, Erythrosine, Indigo Carmine,
Brilliant Blue FCF, Sunset Yellow FCF, Amaranth, Carminic Acid,
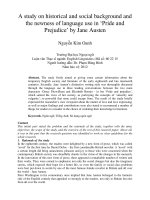
New Red and Ponceau 4R) [4]. In order to detect illegal dyes, this
Fig. 3. Examples of typical chromatograms. (1) Tartrazine in sample No. 19. (2) Sunset Yellow FCF in sample No. 19. (3) Brilliant Blue FCF in sample No. 20.
1818
F. Feng et al. / J. Chromatogr. B 879 (2011) 1813–1818
Table 3
Quantification results for synthetic dyes in positive soft drinks samples analyzed by
HPLC-MS/MS.
Sample
Dye
Concentration (g/g)
RSD (%)
No. 1
No. 9
No. 19
Brilliant Blue FCF
Allura Red
Tartrazine
Ponceau 4R
Sunset Yellow FCF
Allura Red
Brilliant Blue FCF
12.9
0.14
158
2.49
13.3
0.107
0.063
0.4
1.4
2.8
2.4
1.5
1.8
1.6
No.20
HPLC-MS/MS method was applied to 20 samples from the local
market. No illegal dyes were detected. Tartrazine, Ponceau 4R, Sunset Yellow FCF, Allura Red AC, and Brilliant Blue FCF were identified
at levels lower than their legal limits (100, 50, 100, 100 and 25 g/g)
[4]. Table 3 summarizes the screening results of the positive samples.
Fig. 3 shows the typical chromatograms of dyes detected in
positive samples. With this HPLC-ESI-MS/MS method, not only
accuracy was enhanced (identified by two SRM transitions simultaneously), but also the low concentration dye, Brilliant Blue FCF
(0.063 g/g, Table 3), was detected. This suggested that the HPLCMS/MS method is appropriate for the screening of illegal dyes in
foods.
4. Conclusion
In summary, by combining SPE cleanup and HPLC-MS/MS, an
accurate and highly sensitive method was developed to screen 40
dyes in foods. Compared with traditional methods, the accuracy
was enhanced, and the sensitivity was improved by more than 10
times, leading to a powerful method for screening illegal dyes in
foods.
Acknowledgments
The present research was financially supported by the grants
from the project of Beijing Municipal Science and Technology Commission, China (Project number: D08050200310803).
Appendix A. Supplementary data
Supplementary data associated with this article can be found, in
the online version, at doi:10.1016/j.jchromb.2011.04.014.
References
[1] J. Noonan, in: T.E. Furia (Ed.), CRC Handbook of Food Additives, vol. I, 2nd ed.,
CRC Press, Boca Raton, FL, 1981, p. 587.
[2] IARC Monographs on the Evaluation of the Carcinogenic Risk of Chemicals to
Man, vol. 8, IARC, Lyon, 1975, p. 125.
[3] R. Macrae, R.K. Robinson, M.J. Sadler, Food Technology and Nutrition, Academic
Press, California, 1993, p. 1232.
[4] Ministry of Health, P.R.C., Hygienic Standards for Uses of Food Additives,
National Standard of the P.R.C., Beijing, 2007, p. 90.
[5] N. Yoshioka, K. Ichihashi, Talanta 74 (2008) 1408.
[6] H.Y. Huang, C.L. Chuang, C.W. Chiu, M.C. Chung, Electrophoresis 26 (2005) 867.
´
M. Wilk, E. Anuszewska, J. Chromatogr. A 1081 (2005)
[7] M. Jaworska, Z. Szulinska,
42.
[8] N. Dossi, R. Toniolo, A. Pizzariello, S. Susmel, F. Perennes, G. Bontempelli, J.
Electroanal. Chem. 601 (2007) 1.
´ P. Vrábel, P. Krásensky,
´ J. Preisler, J. Chromatogr. A
[9] M. Ryvolová, P. Táborsky,
1141 (2007) 206.
[10] H.Y. Huang, Y. Shih, Y. Chen, J. Chromatogr. A 959 (2002) 317.
[11] J.J.B. Nevado, C.G. Cabanillas, A.M.C. Salcedo, Fresenius J. Anal. Chem. 350 (1994)
606.
[12] J.J. Berzas Nevado, C. Guiberteau Cabanillas, A.M. Contento Salcedo, J. Liq. Chromatogr. Relat. Technol. 20 (1997) 3073.
[13] Q.C. Chen, S.F. Mou, X.P. Hou, J.M. Riviello, Z.M. Ni, J. Chromatogr. A 827 (1998)
73.
[14] C. Long, Z. Mai, Y. Yang, B. Zhu, X. Xu, L. Lu, X. Zou, J. Chromatogr. A 1216 (2009)
8379.
[15] M.S. García-Falcón, J. Simal-Gándara, Food Control. 16 (2005) 293.
[16] A. Kósa, T. Cserháti, E. Forgács, H. Morais, T. Mota, A.C. Ramos, J. Chromatogr. A
915 (2001) 149.
[17] L. He, Y. Su, B. Fang, X. Shen, Z. Zeng, Y. Liu, Anal. Chim. Acta 594 (2007) 139.
[18] Y.S. Al-Degs, Food Chem. 117 (2009) 485.
[19] K.S. Minioti, C.F. Sakellariou, N.S. Thomaidis, Anal. Chim. Acta 583 (2007) 103.
[20] J. Zhang, N. Gao, Y. Zhang, Anal. Lett. 40 (2007) 3080.
[21] J. Kirschbaum, C. Krause, H. Brückner, Eur. Food Res. Technol. 222 (2006) 572.
´ Chromatographia 70 (2009) 1519.
[22] M. Serdar, Z. Kneˇzevic,
˜ J.C. Rivas, J. Assoc. Off. Anal. Chem. 72 (1989) 231.
[23] M. Jalón, M.J. Pena,
[24] M. González, M. Gallego, M. Valcárcel, Anal. Chem. 75 (2003) 685.
[25] M. González, M. Gallego, M. Valcárcel, J. Agric. Food Chem. 51 (2003) 2121.
[26] M. Ma, X. Luo, B. Chen, S. Su, S. Yao, J. Chromatogr. A 1103 (2006) 170.
[27] M.R. Fuh, K.J. Chia, Talanta 56 (2002) 663.
[28] H.W. Sun, F.C. Wang, L.F. Ai, J Chromatogr. A 1164 (2007) 120.
[29] M. Murty, N. Sridhara Chary, S. Prabhakar, N. Prasada Raju, M. Vairamani, Food
Chem. 115 (2009) 1556.
[30] T. Storm, T. Reemtsma, M. Jekel, J Chromatogr A 854 (1999) 175.
[31] M. Holˇcapek, P. Jandera, P. Zderadiˇcka, J. Chromatogr A 926 (2001) 175.
[32] M. Holˇcapek, K. Volná, D. Van˘erková, Dyes and Pigments 75 (2007) 156.