Prevalence and predictors of falls and dizziness in people younger and older than 80 years of age—a longitudinal cohort study
Bạn đang xem bản rút gọn của tài liệu. Xem và tải ngay bản đầy đủ của tài liệu tại đây (353.77 KB, 9 trang )
Archives of Gerontology and Geriatrics 56 (2013) 160–168
Contents lists available at SciVerse ScienceDirect
Archives of Gerontology and Geriatrics
journal homepage: www.elsevier.com/locate/archger
Prevalence and predictors of falls and dizziness in people younger and older than
80 years of age—A longitudinal cohort study
U. Olsson Mo¨ller a,b,*, P. Midlo¨v a,c, J. Kristensson d, C. Ekdahl d, J. Berglund e, U. Jakobsson a,c
a
Center for Primary Health Care Research, Faculty of Medicine, Lund University, SE-205 02 Malmo¨, Sweden
Va˚rdalinstitutet, The Swedish Institute for Health Sciences, Lund University, P.O. Box 187, SE-221 00 Lund, Sweden
c
Department of Clinical Sciences in Malmo¨, Faculty of Medicine, Lund University, SE-205 02 Malmo¨, Sweden
d
Department of Health Sciences, Faculty of Medicine, Lund University, P.O. Box 157, SE-221 00 Lund, Sweden
e
School of Health Science, Blekinge Institute of Technology, SE-371 79 Karlskrona, Sweden
b
A R T I C L E I N F O
A B S T R A C T
Article history:
Received 30 May 2012
Received in revised form 21 August 2012
Accepted 23 August 2012
Available online 19 September 2012
The objectives were to investigate the prevalence and predictors for falls and dizziness among people
younger and older than 80 years of age. The sample was drawn from the Swedish National study on Aging
and Care (SNAC) and comprised 973 and 1273 subjects with data on the occurrence of falls and dizziness
respectively at baseline. Follow-ups were made after 3- and 6-years. Data included socio-demographics,
physical function, health complaints, cognition, quality of life and medications. The prevalence of falls
was 16.5% in those under aged 80 and 31.7% in those 80+ years while dizziness was reported by 17.8%
and 31.0% respectively. Predictors for falls in those under aged 80 were neuroleptics, dependency in
personal activities of daily living (PADL), a history of falling, vision impairment and higher age, and in
those 80+ years a history of falling, dependency in instrumental activities of daily living (IADL), fatigue
and higher age. Factors predicting dizziness in those under aged 80 were a history of dizziness, feeling
nervous and reduced grip strength and in those 80+ years a history of dizziness and of falling. Predictors
for falls and dizziness differed according to age. Specific factors were identified in those under aged 80. In
those 80+ years more general factors were identified implying the need for a comprehensive
investigation to prevent falls. This longitudinal study also showed that falling and dizziness in many
older people are persistent and therefore should be treated as chronic conditions.
ß 2012 Elsevier Ireland Ltd. All rights reserved.
Keywords:
Aged
Accidental falls
Dizziness
Longitudinal study
SNAC
1. Introduction
One third of older people fall each year and the number of falls
increase with age and frailty level (WHO, 2007). Of all falls in older
adults 10–20% results in injury, hospitalisation and/or death
(Rubenstein, 2006). Many studies have investigated risk factors for
falls in older people and as many as 400 have been revealed (NICE,
2004). Longitudinal studies investigating predictors for falls also
showed the importance of a variety of factors including a history of
falling, gait problems, vertigo and drug use (Deandrea et al., 2010).
The large number of risk factors indicates the complexity of the
problem and that the risk factors identified differ depending on
study design and study population. Common risk factors for falls
are more frequent at higher ages and the risk of falling rises with
* Corresponding author at: Center for Primary Health Care Research, Faculty of
Medicine, Lund University, SE-205 02 Malmo¨, Sweden. Tel.: +46 46 222 1833;
fax: +46 46 222 1934.
E-mail address: (U. Olsson Mo¨ller).
0167-4943/$ – see front matter ß 2012 Elsevier Ireland Ltd. All rights reserved.
/>
the number of risk factors for falls present. This may imply that the
predictors for falls differ in different age cohorts.
In a recent meta-analysis of risk factors for falls in communitydwelling older people, the strongest predictors for falls were found
to be a history of falls, gait problems, use of a walking aid, vertigo,
Parkinson disease and antiepileptic drug use (Deandrea et al.,
2010). Most studies that investigate risk factors for falls include
people 65+ years but a few studies have investigated associated
factors and predictors for falls in people 80+ years (Iinattiniemi,
Jokelainen, & Luukinen, 2009; Grundstrom, Guse, & Layde, 2012). A
study in 555 people 85+ years showed history of recurrent falls,
poor vision, antipsychotic drugs and feelings of anxiety, nervousness or fear to be independent risk factors for falls (Iinattiniemi
et al., 2009). Another study comparing risk factors for falls in
people younger and older than 85+ years revealed that even
though many risk factors for falls were similar between the groups,
higher age as well as male gender and general health status were
more strongly associated with an increased fall risk in those 85
years and older (Grundstrom et al., 2012). Those differences might
indicate that predictors of falls differ according to age but, to our
knowledge, no study has investigated predictors for falls in
U. Olsson Mo¨ller et al. / Archives of Gerontology and Geriatrics 56 (2013) 160–168
161
The four youngest age cohorts (60, 66, 72 and 78 years old), i.e.
those under aged 80 were selected, using computer-based
randomization, monthly from the Swedish Population database
(Statistics Sweden). The older age cohorts (81, 84, 87, 90, 93 and 96
years old), i.e. those 80+ years, included the entire population
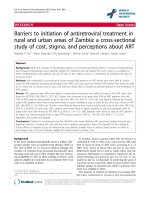
(Halling & Berglund, 2006). At baseline 973 subjects were
interviewed by means of self-reported falls in the past year and
1273 subjects by means of self-reported dizziness in the past three
months and where included in the present study. These samples
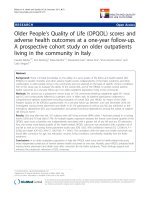
were then divided in subjects under age 80 and 80+ years (Fig. 1).
There were two follow-ups, the first after three years on
subjects aged 80+ years at baseline. This sample included 237 and
224 subjects with valid data at baseline on falls and dizziness
respectively (Fig. 1). The subjects who dropped out before the first
follow-up interview were significantly older in both groups
(p < 0.001) and significantly more of female gender in the
dizziness group (p = 0.009). The second follow-up after six years
included subjects included all at baseline and comprised 616
subjects with valid baseline data on falls; 441 subjects under aged
80 and 175 subjects 80+ years, and 677 subjects with valid baseline
data on dizziness; 531 subjects under aged 80 and 146 subjects 80+
years (Fig. 1). The subjects who dropped out before the second
follow-up interview were significantly older in both groups
(p < 0.001) but with no gender differences.
different age cohorts. This knowledge might reveal specific agerelated predictors, which could be useful when screening for
people at risk for subsequent falls and when designing fall
preventive interventions for people of various ages.
The strategy for preventing falls is elimination of the risk factors
for falls. Dizziness is a known risk factor for falls (Deandrea et al.,
2010) and predictors for dizziness are indirect predictors for falls.
Various studies report the prevalence of dizziness in older people
as being between 11 and 31% with an increase with age (Gassman
& Rupprecht, 2009; Stevens, Lang, Guralnik, & Melzer, 2008;
Tinetti, Speechley, & Ginter, 2000a). The most common major
contributory causes of dizziness in elderly (65+ years) patients
were cardiovascular disease, peripheral vestibular disease and
psychiatric illness (Maarsingh et al., 2010) and although falls may
be the most disabling consequence of dizziness (Mendel,
Bergenius, & Langius-Eklo¨f, 2010) it is also associated with poor
self-related health (Gassman & Rupprecht, 2009) and reduced
quality of life (Ekwall, Lindberg, & Magnusson, 2009), indicating
the importance of prevention. A prospective cohort study in 620
people 65+ years showed higher age, female gender, comorbidity,
polypharmacy, poor subjective health status, falls and mobility
problems to be predictors of dizziness (Gassman & Rupprecht,
2009). To our knowledge no study has investigated predictors for
dizziness stratified by age and this knowledge may identify agespecific factors that ought to be eliminated to prevent dizziness
and thereby falls. The objectives of this study were to investigate
the prevalence and predictors for falls and dizziness among people
younger and older than 80 years of age in a longitudinal cohort
study with 3- and 6-year follow-ups.
2.2. Data collection
At baseline the selected subjects were invited by mail to take
part in the study. If there was no response, they were given one
more invitation by telephone and if participation was refused the
reason was registered. The enrolled subjects who were unable to
come to the research center were offered an examination in their
homes. The subjects included were examined medically and
cognitively, and were asked survey questions by the research
team (physicians and nurses) in two sessions each lasting about
3 h. After the first session, a new visit to the research center was
booked and a questionnaire was filled in by the subjects during the
time period between the two sessions. The subjects were offered
help filling in the questionnaires if needed, and the research team
was accessible during office hours. The same procedure was used
at both follow-ups, where the enrolled subjects were contacted 3
2. Methods
2.1. Sample
The sample was drawn from the SNAC, a national, longitudinal,
multidisciplinary study involving four research centers (Lagergren
et al., 2004). The present study used data from the sub-study of the
County of Blekinge (SNAC-B) with baseline data collection in 2001–
2003 on 1402 people 60–96 years of age. SNAC-B focused on one
municipality with approximately 60 000 inhabitants, located in the
south-eastern part of Sweden including both urban and rural areas.
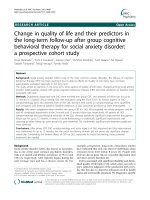
Baseline N=1402
Have you experienced a fall in the past
year?
Have you experienced dizziness in the
past three months?
Baseline n=973*
Baseline n = 1273*
226 subjects (23.2 %) reported falls
301 subjects (23.6 %) reported dizziness
Under aged 80
Baseline
80+ years
Under aged 80
80+ years
n=544*
n=429*
n=712*
n=561*
90 subjects (16.5 %)
reported falls
136 subjects (31.7 %)
reported falls
127 subjects (17.8 %)
reported dizziness
174 subjects (31.0 %)
reported dizziness
3-year
follow-up
N/A
n=237*
N/A
n=224*
6- year
follow-up
n=441*
n=175*
n=531*
n=146*
Fig. 1. Flowchart with falls and dizziness prevalence rates at baseline. *Item response rate.
162
U. Olsson Mo¨ller et al. / Archives of Gerontology and Geriatrics 56 (2013) 160–168
A˚sberg, 1991). The ADL staircase assesses dependence/independence in daily living and comprises five PADL: bathing; dressing;
going to the toilet; transfer; feeding and four IADL: cleaning;
shopping; transportation and cooking. The response alternatives
were dichotomized (can or cannot) according to Sonn & A˚sberg
(1991). Subjects with a score of 0 were defined as independent. The
maximum total score was 0–9, with 0–5 in the PADL subscale and
0–4 in the IADL subscale used in the analyses.
The Romberg test was performed by standing with feet together
and arms along the side of the body with eyes open (EO) and eyes
closed (EC) (can or cannot). Grip strength was measured using
Grippit 1 (Nordenskio¨ld & Grimby, 1993), where the force in
newton (N) from 0 to 999 N is registered. In the present study the
maximum strength in the right hand was used.
and 6 years (Æthree months) after inclusion in the study. The
Regional Ethics Review Board in Lund approved the study (LU 60500, LU 744-00) and written consent was obtained from all enrolled
subjects.
2.3. Questionnaires and measures
Known risk factors and potential predictors for falls and
dizziness (Deandrea et al., 2010; Gassman & Rupprecht, 2009;
Gassmann, Rupprecht, & Freiberger, 2009; NICE, 2004; Rubenstein,
2006; Tinetti, Speechley, et al., 2000) that were available in the
original SNAC-B study at baseline were used in the present study.
This study included data on socio-demographic variables, physical
function, self-reported health complaints, cognition, health-related quality of life (HRQoL) and medication.
2.3.3. Self-reported health complaints
In this study the number of falls was measured by means of selfreported falls in the past year (0, 1, 2, 3, 4, >4 falls) and the subjects
were divided in two groups; no falls (0) or falls (!1). Dizziness was
reported through a single-item question; ‘‘Have you experienced
dizziness in the last three months?’’ (yes or no). Dizziness in this
study is used as an umbrella term and may also include other
sensations such as vertigo, disequilibrium, or presyncope. The
sample was divided into two groups based on whether or not
dizziness occurred. Health status included the self-reported
presence of balance impairment, fatigue, sleeping problems, poor
appetite or feeling nervous in the last three months (yes or no). Fear
2.3.1. Socio-demographic variables
Demographic data included age, sex and living conditions, with
subjects divided into those who lived in ordinary housing
(community-dwelling) and those who lived in special accommodation (nursing homes, modified facilities with staff on call or
around the clock).
2.3.2. Physical function
Activities of daily living (ADL) were assessed using questions
that directly corresponded to the ADL staircase (Sonn & A˚sberg,
1991). The item on continence was excluded in this study (Sonn &
Table 1
Baseline characteristics of subjects older than 80 years of age with falls (F) or no falls (NF) at the 3-year follow-up.
80+ years (n = 237)
F
n = 88
Socio-demographic variables
Age, mean (SD)
Gender, female, n (%)
Community-dwelling, n (%)
Functional capacity
PADL dependency, n (%)
IADL dependency, n (%)
Romberg test (EO), pos, n (%)
Romberg test (EC), pos, n (%)
Grip strength, right, mean (SD)
Self-reported health problems
History of fall, n (%)
Dizziness, n (%)
Fear of falling, n (%)
Self-reported balance impairment, n (%)
Fatigue, n (%)
Sleeping problems, n (%)
Poor appetite, n (%)
Feeling nervous, n (%)
Hearing impairment, n (%)
Vision impairment, n (%)
Cognition and HRQoL
MMSE 24, n (%) 1.1
SF 12 (PCS), mean (SD)
SF 12 (MCS), mean (SD)
Medications
Neuroleptics, n (%)
Sedatives, n (%)
Hypnotics, n (%)
Benzodiazepines, n (%)
Medium- and long-acting benzodiazepines, n (%)
SSRI, n (%)
Bold values indicates statically significant p-value
SD = standard deviation.
a
Student’s t-test.
b
Chi2-test.
c
Missing value: 0.7–6.8%.
d
Missing value: 9.4–12.5%.
e
Missing value: 17.0–21.6%.
0.05.
85.7 (3.9)
52 (59.1)
83 (96.5)c
NF
n = 149
p-Value
83.8 (3.1)
87 (58.4)
140 (94.6)c
<0.001a
0.916b
0.750b
9
46
11
32
191
(10.2)
(52.3)
(15.1)e
(44.4)e
(97)e
11
41
11
40
210
(7.4)
(27.7)c
(7.8)c
(28.8)c
(100)d
0.447b
<0.001b
0.097b
0.023b
0.183a
32
25
36
39
58
39
15
20
51
50
(36.4)
(29.4)c
(42.9)c
(47.0)c
(67.4)c
(45.9)c
(18.1)c
(24.4)c
(58.0)
(56.8)
32
32
37
46
70
51
18
29
63
55
(21.5)
(21.6)c
(25.2)c
(31.7)c
(47.6)c
(34.5)c
(12.2)c
(19.7)c
(42.3)
(36.9)
0.013b
0.183b
0.005b
0.022b
0.003b
0.085b
0.226b
0.409b
0.020b
0.003b
27 (31.0)c
34.9 (10.6)d
51.1 (9.5)d
31 (20.8)
42.9 (11.4)d
54.9 (7.5)d
4
9
26
21
19
4
1
16
22
19
11
6
(4.5)
(10.2)
(29.5)
(23.9)
(21.6)
(4.5)
(0.7)
(10.7)
(14.8)
(12.8)
(7.4)
(4.0)
0.078b
<0.001a
0.004a
0.065b
0.902b
0.006b
0.027b
0.001b
1.000b
U. Olsson Mo¨ller et al. / Archives of Gerontology and Geriatrics 56 (2013) 160–168
163
inhibitor (SSRI) (N06AB). Benzodiazepine included both N05BA
and N05CD with a subgroup of medium- and long-acting
benzodiazepines. The medium-acting benzodiazepines prescribed
in Sweden are nitrazepam (N05CD02) and flunitrazepam
(N05CD03) whereas diazepam (N05BA01) is the only long-acting
benzodiazepine. The data were dichotomized as yes, taking the
medication or no, not taking the medication.
of falling was measured using a single-item questions; ‘‘Are you
afraid of falling when outdoors?’’ (yes or no). Hearing and vision
was self-rated with a single item; ‘‘Do you have problems with
your hearing/vision?’’ (yes or no).
2.3.4. Cognition and HRQoL
Cognitive impairment was measured using the Mini-Mental
State Examination (MMSE) (Folstein, Folstein, & McHugh, 1975).
The maximum total score is 30 points. The sample in the present
study was divided into two groups with 24 as the limit. HRQoL
was assessed using the 12-item Short-form Health Survey (SF 12)
(Ware, Kosinski, & Keller, 1996). The questionnaire consists of two
sub-scores; a Physical Component Summary Scale (PCS) and a
Mental Component Summary Scale (MCS) and were scored and
transformed according to the Swedish manual (Sullivan, Karlsson,
& Taft, 1997), where a higher score indicates a higher level of
HRQoL.
2.4. Statistical analysis
Prevalence rates of the total sample at baseline as well as in
different age groups were calculated. Bivariate analyses with
independent variables at baseline and data on the occurrence of
falls and dizziness at the two follow-ups as dependent variables
were made to explore differences between fallers and non-fallers
and dizzy and non-dizzy subjects. The Pearson chi-square test for
nominal data and Student’s t-test for interval data were used for
group comparisons. A p-value 0.05 was considered statistically
significant. To identify predictors for falls and dizziness the
significant variables from the bivariate analyses at baseline were
included as independent variables in multiple logistic regression
analyses (manual backward), with data on the occurrence of falls
and dizziness at the two follow-ups as dependent variables. Crude
odds ratios (ORs) were calculated for the identified predictors.
Analyses for multicollinearity were tested with Variance inflation
factor and tolerance. The Hosmer and Lemeshow goodness-of-fit
test and Nagelkerke R2 test were used as measures of the quality of
2.3.5. Medication
The subjects were asked to bring their medication and/or a
prescription list to the medical examination. Medication use was
classified according to the Anatomical Therapeutic Chemical (ATC)
classification system (WHO, 2000). The medication groups
included in this study are medications known to increase the risk
factor for falls and dizziness (Leipzig, Cumming, & Tinetti, 1999;
Tinetti, Speechley, et al., 2000), i.e. neuroleptics (N05A), sedatives
(N05B), hypnotics (N05C), and selective serotonin reuptake
Table 2
Baseline characteristics of subjects younger and older than 80 years of age with F or NF at the 6-years follow-up.
Under aged 80 (n = 441)
F
n = 81
Socio-demographic variables
Age, mean (SD)
Gender, female, n (%)
Community-dwelling, n (%)
Functional capacity
PADL dependency, n (%)
IADL dependency, n (%)
Romberg test (EO), pos, n (%)
Romberg test (EC), pos, n (%)
Grip strength, right, mean (SD)
Self-reported health problems
History of fall, n (%)
Dizziness, n (%)
Fear of falling, n (%)
Self-reported balance impairment, n (%)
Fatigue, n (%)
Sleeping problems, n (%)
Poor appetite, n (%)
Feeling nervous, n (%)
Hearing impairment, n (%)
Vision impairment, n (%)
Cognition and HRQoL
MMSE 24, n (%)
SF 12 (PCS), mean (SD)
SF 12 (MCS), mean (SD)
Medications
Neuroleptics, n (%)
Sedatives, n (%)
Hypnotics, n (%)
Benzodiazepines, n (%)
Medium- and long-acting benzodiazepines, n (%)
SSRI, n (%)
Bold values indicates statically significant p-value
a
Student’s t-test.
b
Chi2-test.
c
Missing value: 0.5–1.9 (0.5-5%).
d
Missing value: 6.7–9.3%.
e
Missing value: 12.0–14.0%.
0.05.
69.8 (6.1)
47 (58.0)
81 (100.0)
4 (5.0)c
10 (12.5)c
1 (1.3)c
5 (6.3)c
255(112)c
23
21
17
17
38
29
5
15
32
28
(28.4)
(25.9)
(21.0)
(21.0)
(46.9)
(35.8)
(6.2)
(18.5)
(40.0)c
(35.0)c
5 (6.2)
43.8 (11.4)d
54.1 (9.8)d
3
8
9
9
6
4
(3.7)
(9.9)
(11.1)
(11.1)
(7.4)
(4.9)
80+ years (n = 175)
NF
n = 360
p-Value
67.3 (6.4)
187 (51.9)
358 (100.0)c
<0.001a
0.310b
N/Ab
2
14
2
18
299
(0.6)c
(3.9)
(0.6)c
(5.1)c
(120)c
0.012b
0.005b
0.458b
0.591b
0.003a
41
47
36
33
153
100
15
54
97
57
(11.4)
(13.2)c
(10.1)c
(9.2)c
(43.2)c
(28.1)c
(4.2)c
(15.3)c
(27.1)
(15.8)
F
n = 75
84.4 (3.3)
51 (68.0)
73 (98.6)c
NF
n = 100
84.0 (3.4)
57 (57.0)
98 (98.)0
p-Value
0.395a
0.160b
1.000b
6
35
5
24
194
(8.1)d
(46.7)
(7.1)d
(36.4)e
(89)e
3
20
9
24
215
(3.0)
(20.0)
(9.7)d
(26.4)d
(102)d
0.174b
<0.001b
0.554b
0.195b
0.166a
<0.001b
0.004b
0.006b
0.003b
0.532b
0.165b
0.392b
0.468b
0.023b
<0.001b
30
19
23
35
49
35
7
21
39
36
(40.0)
(26.0)c
(31.5)c
(47.9)c
(66.2)c
(47.3)c
(9.7)c
(29.2)c
(52.0)
(48.0)
14
18
27
23
43
35
14
18
45
39
(14.0)
(18.2)c
(27.0)
(24.2)c
(43.4)c
(35.0)
(14.1)c
(18.4)c
(45.0)
(39.0)
<0.001b
0.229b
0.546b
0.002b
0.004b
0.113b
0.372b
0.105b
0.323b
0.256b
21 (5.8)
47.0 (9.4)c
55.9 (7.2)c
0.799b
0.022a
0.141a
17 (22.7)
37.7 (12.0)e
52.5 (9.0)e
27 (27.0)
42.4 (11.4)e
54.4 (8.3)e
0.489b
0.015a
0.166a
2
9
24
18
15
11
0.045b
0.005b
0.167b
0.067b
0.244b
0.493b
2
8
14
13
7
4
1
6
15
13
10
2
0.578b
0.269b
0.538b
0.441b
0.866b
0.405b
(0.6)
(2.5)
(6.7)
(5.0)
(4.2)
(3.1)
(2.7)
(10.7)
(18.7)
(17.3)
(9.3)
(5.3)
(1.0)
(6.0)
(15.0)
(13.0)
(10.0)
(2.0)
164
U. Olsson Mo¨ller et al. / Archives of Gerontology and Geriatrics 56 (2013) 160–168
the regression models. The statistical analyses were performed
using SPSS 17.0 (Chicago, IL, USA).
3. Results
in hypnotics, all benzodiazepines and medium- and long acting
benzodiazepines (Table 1). At the 6-year follow-up (Table 2) IADL
dependency, a history of falling, balance impairment, fatigue and
reduced physical HRQoL was associated with a higher risk for
falling.
3.1. Prevalence of falls and associated factors
3.2. Prevalence of dizziness and associated factors
At baseline a total of 23.2% of subjects reported falls, those
under aged 80 reported a prevalence of 16.5% and those 80+
years 31.7% (Fig. 1). Many of the baseline variables were
significantly associated in the expected direction and with
higher prevalence rates in those 80+ years except dizziness that
showed the same prevalence rate in younger and older fallers,
i.e. 26% (Table 2).
In those under aged 80 a fall was significantly associated with
higher age, ADL dependency, reduced grip strength, a history of
falling and dizziness, fear of falling, balance, hearing and vision
impairment and reduced physical HRQoL in the expected direction
(Table 2). Significant differences between the groups regarding
medication were seen in neuroleptics and sedatives (Table 2).
In those 80+ years a fall was at the 3-year follow-up
significantly associated with higher age, IADL dependency,
Romberg test EC, a history of falling, fear of falling, balance
impairment, fatigue, hearing and vision impairment and reduced
HRQoL (Table 1). A statistically significant difference was also seen
At baseline 23.6% of subjects reported dizziness, 17.8% in those
under aged 80 and 31.0% in those 80+ years (Fig. 1). The
independent factors showed a higher prevalence rate in the older
age group except sleeping problems with 47% in the younger age
group compared with 41% in the older (Table 4). Variables
significantly associated with dizziness in those under aged 80 were
higher age, female gender, reduced grip strength, a history of
falling or dizziness, fear of falling, balance impairment, fatigue,
sleeping problems, poor appetite, feeling nervous, vision impairment, reduced HRQoL, hypnotics, all benzodiazepines and
medium- and long acting benzodiazepines (Table 4). In those 80+
years significant associations in the expected direction at the 3year follow-up were seen in gender, IADL dependency, reduced
grip strength, a history of falling or dizziness, fear of falling, balance
impairment, fatigue and reduced physical HRQoL (Table 3). At the
6-year follow-up IADL dependency, a history of falling or dizziness,
balance impairment, fatigue, feeling nervous and reduced HRQoL
Table 3
Baseline characteristics of subjects older than 80 years of age with and without dizziness at the 3-year follow-up.
80+ years (n = 224)
Yes
n = 80
Socio-demographic variables
Age, mean (SD)
Gender, female, n (%)
Community-dwelling, n (%)
Functional capacity
PADL dependency, n (%)
IADL dependency, n (%)
Romberg test (EO), pos, n (%)
Romberg test (EC), pos, n (%)
Grip strength, right, mean (SD)
Self-reported health problems
History of fall, n (%)
Dizziness, n (%)
Fear of falling, n (%)
Self-reported balance impairment, n (%)
Fatigue, n (%)
Sleeping problems, n (%)
Poor appetite, n (%)
Feeling nervous, n (%)
Hearing impairment, n (%)
Vision impairment, n (%)
Cognition and HRQoL
MMSE 24, n (%)
SF 12 (PCS), mean (SD)
SF 12 (MCS), mean (SD)
Medications
Neuroleptics, n (%)
Sedatives, n (%)
Hypnotics, n (%)
Benzodiazepines, n (%)
Medium- and long-acting
Benzodiazepines, n (%)
SSRI, n (%)
Bold values indicates statically significant p-value
a
Student’s t-test.
b
Chi2-test.
c
Missing value: 0.7–4.2%.
d
Missing value: 6.9–11.8%.
e
Missing value:13.8–17.5%.
f
Missing value: 22.9%.
g
Missing value: 33.8%.
84.3 (2.5)
52 (65.0)
78 (100.0)c
p-Value
83.7 (3.2)
74 (51.4)
144 (100.0)
0.126a
0.049b
N/Ab
5
31
5
22
191
(6.3)
(38.8)
(7.2)e
(32.4)e
(78)e
3
30
9
40
222
(2.1)c
(20.8)
(7.0)d
(31.5)d
(101)d
0.139b
0.004b
1.000b
0.903b
0.018a
22
45
34
48
54
37
10
22
43
41
(41.5)g
(56.3)
(43.0)c
(61.5)c
(67.5)
(47.4)c
(12.8)c
(27.8)c
(53.8)
(51.3)
18
12
32
34
72
52
15
24
65
55
(16.2)f
(8.3)
(22.9)c
(24.6)c
(50.0)
(36.1)
(10.4)
(16.8)c
(45.1)
(38.2)
<0.001b
<0.001b
0.002b
<0.001b
0.011b
0.100b
0.589b
0.051b
0.217b
0.059b
13 (16.3)
38.3 (10.9)e
53.0 (10.1)e
20 (13.9)
42.0 (10.8)d
54.5 (8.1)d
0.633b
0.023a
0.264a
2
5
16
10
9
1
11
22
20
14
0.291b
0.699b
0.367b
0.770b
0.718b
(2.5)
(6.3)
(20.0)
(12.5)
(11.3)
2 (2.5)
0.05.
No
n = 144
(0.7)
(7.6)
(15.3)
(13.9)
(9.7)
4 (2.8)
1.000b
U. Olsson Mo¨ller et al. / Archives of Gerontology and Geriatrics 56 (2013) 160–168
165
Table 4
Baseline characteristics of subjects younger and older than 80 years of age with or without dizziness at the 6-year follow-up.
Under aged 80 (n = 531)
Socio-demographic variables
Age, mean (SD)
Gender, female, n (%)
Community-dwelling, n (%)
Functional capacity
PADL dependency, n (%)
IADL dependency, n (%)
Romberg test (EO), pos, n (%)
Romberg test (EC), pos, n (%)
Grip strength, right, mean (SD)
Self-reported health problems
History of fall, n (%)
Dizziness, n (%)
Fear of falling, n (%)
Self-reported balance impairment, n (%)
Fatigue, n (%)
Sleeping problems, n (%)
Poor appetite, n (%)
Feeling nervous, n (%)
Hearing impairment, n (%)
Vision impairment, n (%)
Cognition and HRQoL
MMSE 24, n (%)
SF 12 (PCS), mean (SD)
SF 12 (MCS), mean (SD)
Medications
Neuroleptics, n (%)
Sedatives, n (%)
Hypnotics, n (%)
Benzodiazepines, n (%)
Medium- and long-acting benzodiazepines, n (%)
SSRI, n (%)
Bold values indicates statically significant p-value
a
Student’s t-test.
b
Chi2-test.
c
Missing value: 0.2–6.0%.
d
Missing value: 7.9–15.5%.
e
Missing value: 20.6–23.9%.
f
Missing value: 28.9–31.0%.
80+ years (n = 146)
Yes
n = 114
No
n = 417
p-Value
69.4 (6.3)
84 (73.7)
112 (100.0)c
67.0 (6.2)
213 (51.1)
415 (100.0)c
<0.001a
<0.001b
N/Ab
Yes
n = 58
83.2 (2.5)
40 (69.0)
57 (98.3)
No
n = 88
p-Value
83.2 (2.6)
48 (54.5)
87 (100.0)c
0.985a
0.081b
0.400b
(2.7)c
(3.5)
(0.0)
(8.0)d
(97)c
4
18
4
29
303
(1.0)c
(4.3)
(1.0)c
(7.4)c
(116)c
0.172b
1.000b
0.587b
0.839b
<0.001a
2
15
4
13
201
(3.4)
(25.9)
(7.8)d
(26.5)d
(89)c
1
10
4
19
223
(1.1)
(11.4)
(5.1)d
(24.1)d
(103)c
0.563b
0.023b
0.711b
0.753b
0.200a
(23.5)f
(40.4)
(25.4)
(29.1)c
(61.1)c
(46.9)c
(12.4)c
(27.9)c
(36.0)
(30.7)
38
40
37
34
158
100
15
48
123
87
(11.5)e
(9.6)
(8.9)c
(8.3)c
(38.1)c
(24.0)
(3.6)
(11.6)c
(29.6)c
(20.9)c
0.005b
<0.001b
<0.001b
<0.001b
<0.001b
<0.001b
<0.001b
<0.001b
0.190b
0.028b
13
25
20
24
37
24
10
19
30
28
(32.5)f
(43.1)
(35.1)c
(42.9)c
(63.8)
(41.4)
(17.5)c
(32.8)
(51.7)
(48.3)
7
10
20
21
37
31
9
11
36
37
(10.4)e
(11.4)
(22.7)
(24.7)c
(42.0)
(35.2)
(10.2)
(12.5)
(40.9)
(42.0)
0.005b
<0.001b
0.104b
0.024b
0.010b
0.453b
0.202b
0.003b
0.199b
0.459b
5 (4.4)
42.0 (10.4)c
53.8 (9.5)c
20 (4.8)
47.9 (9.1)c
56.5 (6.8)c
0.855b
<0.001a
0.005a
7 (12.1)
38.1 (12.2)d
52.4 (10.2)d
2
8
15
13
11
7
3
14
19
17
12
10
0.293b
0.108b
0.001b
0.003b
0.004b
0.066b
3
4
0
8
224
19
46
29
32
69
53
14
31
41
35
(1.8)
(7.0)
(13.2)
(11.4)
(9.6)
(6.1)
(0.7)
(3.4)
(4.6)
(4.1)
(2.9)
(2.4)
1
3
9
6
4
3
(1.7)
(5.2)
(15.5)
(10.3)
(6.9)
(5.2)
10 (11.4)
43.7 (10.3)d
55.7 (7.9)d
0.897b
0.005a
0.035a
1
4
14
11
8
3
1.000b
1.000b
0.949b
0.691b
0.764b
0.682b
(1.1)
(4.5)
(15.9)
(12.5)
(9.1)
(3.4)
0.05.
were associated with a higher risk of falling (Table 4). There was no
significant difference in the older age group between those with
and without dizziness regarding any of the medications used
(Tables 3 and 4).
3.3. Predictors of falls
The predictors of falls are shown in Table 5. The multivariate
logistic regression showed significant ORs with regard to the
Table 5
Predictors of falls in subjects younger and older than 80 years of age in the 3 and 6-year follow-ups.
Final model
Under aged 80
6-year follow-up (n = 438)
Neuroleptics
PADL dependency
History of falling
Vision impairment
Higher age
80+years
3-year follow-up (n = 233)
History of falling
Fatigue
Higher age
6-year follow-up (n = 174)
History of falling
IADL dependency
ORa,b,c
95% CI for OR
10.82
6.58
2.63
2.29
1.05
1.62–72.15
1.00–43.18
1.42–4.89
1.28–4.09
1.01–1.09
p-Value
Crude OR
95% CI for crude OR
p-Value for crude OR
0.014
0.050
0.002
0.005
0.022
6.88
9.37
3.08
2.86
1.07
1.13–41.90
1.68–52.08
1.72–5.52
1.67–4.91
1.03–1.11
0.036
0.011
<0.001
<0.001
<0.001
2.05
2.00
1.16
1.10–3.82
1.12–3.58
1.07–1.26
0.024
0.019
<0.001
2.09
0.44
0.00
1.16–3.75
0.25–0.26
1.07–1.26
0.013
0.004
<0.001
3.18
2.72
1.49–6.80
1.35–5.47
0.003
0.005
4.10
3.50
1.97–8.50
1.80–6.82
<0.001
<0.001
Bold values indicates statically significant p-value 0.05.
Dependent variable (falls) coded as: 0 = no falls, 1 = falls.
a
Hosmer and Lemeshow goodness-of-fit test: under aged 80 p = 0.886, 80+ years 3-years p = 0.420 6-years p = 0.406.
b
Nagelkerke R2: under aged 80 0.138, 80+ years 3-years 0.153 6-years 0.167.
c
Variables at baseline entered into the regression analysis (manual backward): 3-year: age, IADL, Romberg EC, history of fall, fear of falling, self-reported balance
impairment, fatigue, hearing, vision, hypnotics. 6-year: under aged 80: age, IADL, grip strength, history of fall, dizziness, fear of falling, self-reported balance impairment,
hearing, vision, neuroleptics, sedatives. 80+ years: IADL, history of fall, self-reported balance impairment, fatigue.
U. Olsson Mo¨ller et al. / Archives of Gerontology and Geriatrics 56 (2013) 160–168
166
Table 6
Predictors of dizziness in subjects younger and older than 80 years of age in the 3- and 6-year follow-ups.
Final model
Under aged 80
6-year follow-up (n = 513)
History of dizziness
Feeling nervous
Reduced grip strength
80+ years
3-year follow-up (n = 164)
History of dizziness
History of falling
6-year follow-up (n = 107)
History of dizziness
History of falling
ORa,b,c
95% CI for OR
p-Value
2.76–8.14
1.37–4.25
0.99–1.00
<0.001
0.002
<0.001
18.15
3.74
6.88–47.90
1.55–9.03
5.42
4.40
1.90–15.47
1.50–12.92
4.74
2.41
0.99
Crude OR
95% CI for crude OR
p-Value for crude OR
6.38
2.96
0.99
3.88–10.47
1.77–4.93
0.99–1.00
<0.001
<0.001
<0.001
<0.001
0.003
14.14
3.67
6.76–29.58
1.74–7–71
<0.001
0.001
0.002
0.007
5.91
4.13
2.55–13.67
1.48–11.50
<0.001
0.007
Bold values indicates statically significant p-value 0.05.
Dependent variable (dizziness) coded as: no = 0, yes = 1.
a
Hosmer and Lemeshow goodness-of-fit test: 3-year 0.414, 6-year; under aged 80, p = 0.927; 80+ years, p = 0.814.
b
Nagelkerke R2; 3-year 0.404, 6-year; under aged 80 0.231, 80+ years 0.217.
c
Variables at baseline for subjects younger and older than 80 years entered into the regression analysis (manual backward): 3-year: gender, IADL, grip strength, history of
fall, dizziness, fear of falling, self-reported balance impairment, fatigue. 6-year; under aged 80: age, gender, grip strength, history of fall, dizziness, fear of falling, self-reported
balance impairment, fatigue, sleeping problems, poor appetite, feeling nervous, vision, hypnotics, 80+ years: IADL, history of fall, dizziness, self-reported balance impairment,
fatigue, feeling nervous.
following variables for those under aged 80: neuroleptics
(OR = 10.82, 95% confidence interval (CI) = 1.62–72.15), PADL
dependency (OR = 6.58, 95% CI = 1.00–43.18), a history of falling
(OR = 2.63, 95% CI = 1.42–4.89), vision impairment (OR = 2.29, 95%
CI = 1.28–4.09) and higher age (OR = 1.05, 95% CI = 1.01–1.09). For
those 80+ years the strongest predictors at the 3-year follow-up
were a history of falling (OR = 2.05, 95% CI = 1.10–3.82), fatigue
(OR = 2.00, 95% CI = 1.12–3.58) and higher age (1.16, 95% CI = 1.07–
1.26) and at the 6-year follow-up a history of falling (OR = 3.18, 95%
CI = 1.49–6.80) and IADL dependency (OR = 2.72, 95% CI = 1.35–
5.47) (Table 5).
3.4. Predictors of dizziness
The predictors of dizziness are shown in Table 6. The variables
predicting dizziness with significant ORs in those under aged 80
were a history of dizziness (OR = 4.74, 95% CI = 2.76–8.14), feeling
nervous (OR = 2.41, 95% CI = 1.37–4.25) and reduced grip strength
(OR = 0.99, 95% CI = 0.99–1.00) (Table 6). In those 80+ years at the
3-year follow-up a history of dizziness (OR = 18.15, 95% CI = 6.88–
47.90) and falling (OR = 3.74, 95% CI = 1.55–9.03) were able to
predict dizziness and the same predictors were shown at the 6year follow-up; a history of dizziness (OR = 5.42, 95% CI = 1.90–
15.47) and falling (OR = 4.40, 95% CI = 1.50–12.92) (Table 6).
4. Discussion
Approximately 23% of subjects experienced falls or dizziness
with an almost doubled prevalence rate the older age cohort
compared to the younger (Fig. 1). The high prevalence of associated
factors showed that people that fall or have dizziness are strongly
affected, signifying the importance of preventive interventions. A
history of falling and dizziness were predictors in people with falls
and dizziness respectively, in both those under and above 80 years
of age, indicating that these conditions may be persistent and
difficult to treat.
The prevalence of falls (Fig. 1) was slightly lower than the
expected one-third of older people yearly experiencing a fall
(WHO, 2007) but clearly showed an increase with age. The present
study was in line with a study by Gassman and Rupprecht (2009)
that showed a prevalence of about 15% in those under aged 80, 23%
in 80–89 year olds and 45% in those 90+ years. The prevalence of
dizziness (Fig. 1) was within the span of previously reported
prevalence rates (Gassman & Rupprecht, 2009; Stevens et al., 2008;
Tinetti, Speechley, et al., 2000). This study clearly showed that the
prevalence increased with age and with one third of those 80+
years being affected the importance of early identification and
intervention for older people with falls and dizziness is evident.
As in other studies (Deandrea et al., 2010; Ekwall et al., 2009;
Gassman & Rupprecht, 2009; Gassmann et al., 2009; Maarsingh
et al., 2010; Tinetti, Speechley, et al., 2000) falls and dizziness were
significantly associated with a variety of factors, some of which
might be seen as risk factors, such as reduced functional capacity,
while others may be seen as consequences such as fear of falling
and lower HRQoL (Tables 1–4). As expected, those affected and
those 80+ years had a higher prevalence in associated factors.
Fatigue showed the highest prevalence rate (47–67%) in people
with falls or dizziness and differed significantly from those not
affected in all age groups except in fallers under aged 80. In a study
in people aged 65+ years (Vestergaard et al., 2009) fatigue was
associated with poorer physical function and disability and fatigue,
and the present study indicates that fatigue is closely connected to
both falls and dizziness.
Different predictors for falls in people younger and older than
80 years of age were revealed in this study. In those under aged 80
neuroleptics, PADL dependency, a history of falling and impaired
vision were the strongest predictors for falls (Table 5). Psychotropic medications are known to increase the risk of falling
(Hartikainen, Lo¨nnroos, & Louhivuori, 2007; Leipzig et al., 1999),
and the 10-fold increase in risk of future falls, albeit with great
variation, in this study implies that this disadvantage should be
taken in consideration when prescribing this medication. Impaired
ADL is a known risk factor for falls (NICE, 2004) as it represents a
number of risk factors such as gait and balance deficits. This study
adds that PADL dependency in people under aged 80 is a strong
predictor for future falls which means that this group will benefit
from fall preventive interventions. Impaired vision as a risk factor
for falls was described by Lord (2006) who recommended regular
eye examinations and use of appropriate prescription spectacles to
eliminate or reduce the risk and the present study adds that in
those under aged 80 regular eye examinations might prevent
future falls.
In those 80+ years a history of falling was also a strong
predictor, together with fatigue and IADL dependency. The
association between fatigue and poorer physical function and
disability (Vestergaard et al., 2009) and the fact that physical
fatigue affects gait control (Helbostad, Leirfall, Moe-Nilssen, &
Sletvold, 2007) could probably explain why fatigue increase the
U. Olsson Mo¨ller et al. / Archives of Gerontology and Geriatrics 56 (2013) 160–168
risk for future falls. Even though self-reported fatigue is a broad
term that might include both physical and psychological aspects,
the high prevalence rate in the present study (47–67%) and also
being a predictor for future falls implies that this health complaint
needs to be addressed. IADL dependency as a risk factor for falls
(NICE, 2004) may be seen as the initial phase of a functional decline
where the older person is in transition from being independent to
being dependent. This emphasizes the need to detect older people
in this phase and initiate a fall-preventive intervention in order to
improve IADL, i.e. physical function, to prevent future falls.
The strongest predictors of dizziness in those under aged 80
were a history of dizziness and feeling nervous (Table 6). That a
history of dizziness was the strongest predictor shows that
dizziness is probably a chronic condition, even though this study
does not show whether dizziness is continuous or periodic. Earlier
studies have shown the relationship between dizziness and
psychological distress (Maarsingh et al., 2010; Nagaratnam, Ip, &
Bou-Haidar, 2005; Tinetti, Speechley, et al., 2000), however, in the
present study the reasons for feeling nervous are not known and
the underlying cause might be the reason for the dizziness. Other
studies showed that psychological disorders are uncommon as
causes of dizziness in older, at least compared to younger age
groups (Lawson, Fitzgerald, Birchall, Aldren, & Kenny, 1999) and,
although not the primary cause, they are contributing or
modulating factors in older people with dizziness (Sloane, Hartman, & Mitchell, 1994). This study indicates that feelings of
nervousness ought to be addressed and the underlying cause
explored in those with dizziness under aged 80s.
In those 80+ years a history of dizziness or falls was the
strongest predictors (Table 6). In the 3-year follow-up the subjects
were 18 times more likely to have dizziness, indicating the
presence of a persistent condition, however with large variations.
At the 6-year follow-up there was five times the likelihood of
having dizziness for both those younger and older than 80 years
(Table 6). In a study (Tinetti, Speechley, et al., 2000) in older people
with dizziness, 63–69% reported having it for at least one year. The
present study confirmed that dizziness in older people might be a
chronic condition that needs to be recognized, investigated and
treated at an early stage, to avoid such negative consequences as
poor self-rated health and reduced quality of life (Ekwall et al.,
2009; Gassman & Rupprecht, 2009).
A history of falls as a predictor for dizziness was also described
by Gassman and Rupprecht (2009) who concluded that there is a
close causal relationship between dizziness and falls regarding gait
disturbances and balance, showing on the one hand that dizziness
is a risk factor for falls, and on the other that motor disabilities can
be described by older people as a sensation of dizziness. They also
argued that the consequences of a fall, i.e. feeling insecure and
frightened of walking, may lead to the development of a feeling of
dizziness or that dizziness and falls are caused by identical
multiple risk factors such as comorbidity, poor self-rated health
status and gait disturbances (Gassman & Rupprecht, 2009). The
present study confirms that falls and dizziness are closely
connected.
It has been suggested that both falls and dizziness should be
treated as geriatric syndromes, i.e. conditions caused by concomitant impairment in multiple bodily systems (Tinetti, Williams, &
Gill, 2000). The difficulty in finding specific predictors in people
aged 80+ years in this study might support this view, as in
Grundstrom et al. (2012) where a deterioration of overall health
status with age increased the risk of falling in people 85+ years.
This would imply that the underlying cause could perhaps not be
detected or eliminated. When a person has multiple risk factors for
falls that cannot be eliminated, they should be informed and
helped to find a way to cope with living with a greater risk of
falling. Suffering from a geriatric syndrome also means being
167
vulnerable to situational challenges (Tinetti, Williams, et al., 2000)
and it is important for health care providers working with older
people suffering from falls and dizziness to be aware of this
vulnerability.
4.1. Limitations
This was a large population-based study with a long follow-up
of a representative sample, allowing the detection of statistically
significant differences. However, this study has certain limitations.
First, although there was an oversampling of the oldest age group,
the drop-out seen in the oldest group might threaten the external
validity, and reduce overall generalizability to the oldest. Second,
the highest internal drop-outs were seen in the Romberg test, SF 12
and grip strength (20–39%) indicating that the results from these
measurements should be interpreted with caution. This might also
be the case for those medications where the prevalence was
sometimes low. Third, we used dizziness as an umbrella term and
all the four most common dizziness symptom categories in older
adults (e.g. vertigo, presyncope, disequilibrium, non-specific
dizziness) are probably included. In addition, the reason behind
the sensation of dizziness and other self-reported health complaints experienced is not known. The data in this study are derived
from a large population-based study where no attempt was made
to investigate dizziness and self-reported health complaints in
depth but rather to give a broad view of its prevalence and
predictors. Finally, data were collected before using the following
definition of a fall; ‘‘an unexpected event in which the participant
comes to rest on the ground, floor or lower level’’ which is
recommended in order to make comparisons between studies
possible (Lamb, Jorstad-Stein, Hauer, & Becker, 2005). Reporting
falls in the previous year may also have lower validity due to the
high risk of recall bias. This means that the number of falls may be
slightly biased (probably underestimated). Despite its limitations
above this study is important because to our knowledge it is the
first to investigate predictors of falls and dizziness in people
younger and older than 80 years of age in a large, longitudinal
cohort study.
5. Conclusions
This study showed that younger and older age cohorts reveal
similar patterns concerning associated factors. Nevertheless, the
predictors for the age cohorts differ and it is therefore important to
develop strategies differentiated according to age to prevent falls
and dizziness. In those under aged 80 specific factors such as
neuroleptics, PADL dependency, visual acuity and feelings of
nervousness are important factors in predicting falls and dizziness.
The results in those 80+ years show that these conditions are
persistent and should be comprehensively investigated. If the
underlying cause cannot be eliminated, people with falls and
dizziness should be helped to cope with living with a greater risk of
falling.
Conflict of interest statement
None.
Acknowledgements
The SNAC () is supported financially by the
Swedish Ministry of Health and Social Affairs, and by the
participating county councils, municipalities and university
departments. We are grateful to the subjects and staff of SNACBlekinge for their engagement in the study. We also wish to thank
Pat Shrimpton for revising the English.
168
U. Olsson Mo¨ller et al. / Archives of Gerontology and Geriatrics 56 (2013) 160–168
References
Deandrea, S., Lucenteforte, E., Bravi, F., Foschi, R., La Vecchia, C., & Negri, E. (2010). Risk
factors for falls in community-dwelling older people. A systematic review and
meta-analysis. Epidemiology, 21, 658–668.
Ekwall, A., Lindberg, A˚., & Magnusson, M. (2009). Dizzy – Why not take a walk? Low
level physical activity improves quality of life among elderly with dizziness.
Gerontology, 55, 652–659.
Folstein, M. F., Folstein, S. E., & McHugh, P. R. (1975). ‘‘Mini-mental state’’. A practical
method for grading the cognitive state of patients for the clinician. Journal of
Psychiatric Research, 12, 189–198.
Gassman, K. G., & Rupprecht, R. (2009). Dizziness in an older community-dwelling
population: A multifactorial syndrome. Journal of Nutrition, Health and Aging, 13,
278–282.
Gassmann, K. G., Rupprecht, R., & Freiberger, E. (2009). Predictors for occasional and
recurrent falls in community-dwelling older people. Zeitschrift fur Gerontologie und
Geriatrie, 42, 3–10.
Grundstrom, A. C., Guse, C. E., & Layde, P. M. (2012). Risk factors for falls and fall-related
injuries in adults 85 years of age and older. Archives of Gerontology and Geriatrics,
54, 421–428.
Halling, A., & Berglund, J. (2006). Concordance between elderly patients’ understanding
of and their primary healthcare physician’s diagnosis of heart failure. Scandinavian
Journal of Primary Health Care, 24, 110–114.
Hartikainen, S., Lo¨nnroos, E., & Louhivuori, K. (2007). Medication as a risk factor for
falls: Critical systematic review. Journal of Gerontology, 10, 1172–1181.
Helbostad, J. L., Leirfall, S., Moe-Nilssen, R., & Sletvold, O. (2007). Physical fatigue affects
gait characteristics in older persons. Journal of Gerontology, 9, 1010–1015.
Iinattiniemi, S., Jokelainen, J., & Luukinen, H. (2009). Fall risk among a very old homedwelling population. Scandinavian Journal of Primary Health Care, 27, 23–30.
Lagergren, M., Fratiglioni, L., Hallberg, I. R., Berglund, J., Elmstahl, S., Hagberg, B., et al.
(2004). A longitudinal study integrating population, care, and social sevices data.
The Swedish National Study on Aging and Care (SNAC). Aging Clinical and Experimental Research, 16, 158–168.
Lamb, S. E., Jorstad-Stein, E. C., Hauer, K., & Becker, C. (2005). Development of a common
outcome data set for fall injury prevention trials: The prevention of falls net-work
Europe´ consensus. JAGS, 53, 1618–1622.
Lawson, J., Fitzgerald, J., Birchall, J., Aldren, C. P., & Kenny, R. A. (1999). Diagnosis of
geriatric patients with severe dizziness. JAGS, 47, 12–17.
Leipzig, M. R., Cumming, R. G., & Tinetti, M. E. (1999). Drugs and falls in older people: a
systematic review and meta-analysis: I. Psychotropic drugs. JAGS, 47, 30–39.
Lord, S. R. (2006). Visual risk factors for falls in older people. Age and Ageing, 35, 42–45.
Maarsingh, O. R., Dros, J., Schellevis, F. G., van Weert, H. C., Bindels, P. J., & van der
Horst, H. E. (2010). Dizziness reported by elderly patients in family practice:
Prevalence, incidence, and clinical characteristics. BMC Family Practice11(2)
(open access).
Mendel, B., Bergenius, J., & Langius-Eklo¨f, A. (2010). Dizziness: A common, troublesome
symptom but often treatable. Journal of Vestibular Research, 20, 391–398.
Nagaratnam, N., Ip, J., & Bou-Haidar, P. (2005). The vestibular dysfunction and anxiety
disorder interface: A descriptive study with special reference to the elderly.
Archives of Gerontology and Geriatrics, 40, 253–264.
National Institute for Health and Clinical Excellence (NICE). (2004). Clinical practice
guidelines for the assessment and prevention of falls in older peoplehttp://www.
nice.org.uk/nicemedia/live/10956/29585/29585.pdf Accessed 18.05.12.
Nordenskio¨ld, U. M., & Grimby, G. (1993). Grip force in patients with rheumatoid
arthritis and fibromyalgia and in healthy subjects. A study with the Grippit
instrument. Scandinavian Journal of Rheumatology, 22, 14–19.
Rubenstein, L. Z. (2006). Falls in older people: Epidemiology, risk factors and strategies
for prevention. Age and Ageing, 35, 37–41.
Sloane, P. D., Hartman, M., & Mitchell, C. M. (1994). Psychological factors associated
with chronic dizziness in patients aged 60 years and older. JAGS, 42, 847–852.
Sonn, U., & A˚sberg, K. H. (1991). Assessment of activities of daily living in the elderly. A
study of a population of 76-year-olds in Gothenburg, Sweden. Scandinavian Journal
of Rehabilitation Medicine, 23, 193–202.
Stevens, K. N., Lang, I., Guralnik, J. M., & Melzer, D. (2008). Epidemiology of balance and
dizziness in a national population: Findings from the English Longitudinal Study of
Ageing. Age and Ageing, 37, 300–305.
Sullivan, M., Karlsson, J., & Taft, C. (1997). SF 12 Ha¨lsoenka¨t. Svensk manual. [SF 12 health
survey. Swedish manual]. Gothenburg: Gothenburg University and Sahlgrenska
University Hospital.
Tinetti, M. E., Speechley, M., & Ginter, S. F. (2000). Health, functional and psychological
outcomes among older persons with chronic dizziness. JAGS, 48, 417–421.
Tinetti, M. E., Williams, C. S., & Gill, T. M. (2000). Dizziness among older adults: A
possible geriatric syndrome. Annals of Internal Medicine, 132, 337–344.
Vestergaard, S., Nayfield, S. G., Patel, K. V., Eldadah, B., Cesari, M., Ferrucci, L., et al.
(2009). Fatigue in a representative population in older persons and its association
with functional impairment, functional limitation, and disability. Journal of Gerontology, 64, 76–82.
Ware, J., Kosinski, M., & Keller, S. D. (1996). A 12-item short-form health survey:
Construction of scales and preliminary tests for reliability and validity. Medical
Care, 34, 220–233.
World Health Organization (WHO). (2000). Collaborating Centre for Drug Statistics
Methodology, Anatomical Therapeutic Chemical (ATC) classificationhttp://
www.whocc.no/atcddd Accessed 28.05.12..
World Health Organization (WHO). (2007). Global report on falls prevention in older
age />Accessed 18.05.12..