FUNCTIONS AND THEIR REPRESENTATIONS
Bạn đang xem bản rút gọn của tài liệu. Xem và tải ngay bản đầy đủ của tài liệu tại đây (763.23 KB, 64 trang )
SECTION 1.1
FUNCTIONS AND THEIR
REPRESENTATONS
FOUR WAYS TO REPRESENT A FUNCTION
Functions arise whenever one quantity depends
on another. Consider the following four
situations.
A.The area A of a circle depends on the radius r of
the circle.
The rule that connects r and A is given by the
equation A = π r 2 .
With each positive number r, there is associated
one value of A, and we say that A is a function of r.
1.1 P.2
FOUR WAYS TO REPRESENT A FUNCTION
B.The human population of the world P depends
on the time t.
The table gives estimates of the world population
P(t) at time t, for certain years.
For instance,
P(1950) ≈ 2,560, 000, 000
However, for each value of
the time t, there is a
corresponding value of P,
and we say that P is a function
of t.
1.1 P.3
FOUR WAYS TO REPRESENT A FUNCTION
C.The cost C of mailing a first-class letter
depends on the weight w of the letter.
Although there is no simple formula that connects w
and C, the post office has a rule for determining C
when w is known.
1.1 P.4
FOUR WAYS TO REPRESENT A FUNCTION
D.The vertical acceleration a of the ground as
measured by a seismograph during an
earthquake is a function of the elapsed time t.
Figure 1 shows a graph generated by seismic
activity during the Northridge earthquake that
shook Los Angeles in 1994.
For a given value of t,
the graph provides a
corresponding value
of a.
1.1 P.5
FUNCTION
Each of these examples describes a rule
whereby, given a number (r, t, w, or t), another
number (A, P, C, or a) is assigned.
In each case, we say that the second number is a
function of the first number.
A function f is a rule that assigns to each
element x in a set A exactly one element, called
f(x), in a set B.
1.1 P.6
DOMAIN
We usually consider functions for which the
sets A and B are sets of real numbers. The set A
is called the domain of the function.
1.1 P.7
VALUE AND RANGE
The number f(x) is the value of f at x and is
read ‘‘f of x.’’
The range of f is the set of all possible values of
f(x) as x varies throughout the domain.
1.1 P.8
INDEPENDENT VARIABLE
A symbol that represents an arbitrary number in
the domain of a function f is called an
independent variable.
For instance, in Example A, r is the independent
variable.
1.1 P.9
DEPENDENT VARIABLE
A symbol that represents a number in the range
of f is called a dependent variable.
For instance, in Example A, A is the dependent
variable.
1.1 P.10
MACHINE
It’s helpful to think of a function as a machine
(See Figure 2). If x is in the domain of the
function f, then when x enters the machine, it’s
accepted as an input and the machine produces
an output f(x) according to the rule of the
function. Thus, we can think of the domain as
the set of all possible inputs and the range as the
set of all possible outputs.
1.1 P.11
ARROW DIAGRAM
Another way to picture a function is by an
arrow diagram as in Figure 3.
Each arrow connects an element of A to
an element of B.
The arrow indicates that
f(x) is associated with x,
f(a) is associated with a,
and so on.
1.1 P.12
GRAPH
The most common method for visualizing a
function is its graph.
If f is a function with domain A, then its graph
is the set of ordered pairs
{ ( x, f ( x)) | x ∈ A}
Notice that these are input-output pairs. In other
words, the graph of f consists of all points
(x, y) in the coordinate plane such that y = f(x)
and x is in the domain of f.
1.1 P.13
GRAPH
The graph of a function f gives us a useful
picture of the behavior or ‘life history’ of a
function.
Since the y-coordinate of any point (x, y) on the
graph is y = f(x), we can
read the value of f(x)
from the graph as being
the height of the graph
above the point x.
See Figure 4.
1.1 P.14
GRAPH
The graph of f also allows us to picture:
The domain of f on the x-axis
Its range on the y-axis as in Figure 5.
1.1 P.15
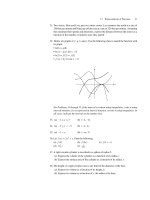
Example 1
The graph of a function f is shown in Figure 6.
(a) Find the values of f(1) and f(5).
(b) What is the domain and range of f ?
1.1 P.16
Example 1(a) SOLUTION
We see from Figure 6 that the point (1, 3) lies
on the graph of f.
So, the value of f at 1 is f(1) = 3.
In other words, the point on the graph that lies above
x = 1 is 3 units above the x-axis.
When x = 5, the graph lies
about 0.7 units below
the x-axis.
So, we estimate that
f (5) ≈ −0.7
1.1 P.17
Example 1(b) SOLUTION
We see that f(x) is defined when 0 ≤ x ≤ 7 .
So, the domain of f is the closed interval [0, 7].
Notice that f takes on all values from – 2 to 4.
So, the range of f is
{ y | −2 ≤ y ≤ 4} = [−2, 4]
1.1 P.18
REPRESENTATIONS OF FUNCTIONS
There are four possible ways to represent a
function:
Verbally (by a description in words)
Numerically (by a table of values)
Visually (by a graph)
Algebraically (by an explicit formula)
1.1 P.19
REPRESENTATIONS OF FUNCTIONS
If a single function can be represented in all
four ways, it’s often useful to go from one
representation to another to gain additional
insight into the function.
But certain functions are described more
naturally by one method than by another.
With this in mind, let’s reexamine the four situations
that we considered at the beginning of this section.
1.1 P.20
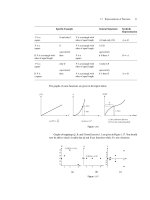
SITUATION A
The most useful representation of the area of a
circle as a function of its radius is probably the
algebraic formula A(r ) = π r 2 .
However, it is possible to compile a table of values
or to sketch a graph (half a parabola).
As a circle has to have a positive radius, the domain
is { r | r > 0} = (0, ∞) , and the range is also (0, ∞).
1.1 P.21
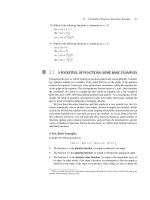
SITUATION B
We are given a description of the function in
words: P(t) is the human population of the
world at time t.
The table of values of world
population provides a
convenient representation of
this function.
If we plot these values, we get
a graph as follows.
1.1 P.22
SITUATION B
This graph is called a scatter plot.
It too is a useful representation.
It allows us to absorb all the data at once.
1.1 P.23
SITUATION B
What about a formula?
Of course, it’s impossible to devise an explicit
formula that gives the exact human population P(t)
at any time t.
But it is possible to find an expression for
a function that approximates P(t).
In fact, we could use a graphing calculator with
exponential regression capabilities toobtain the
approximation
P(t ) ≈ f (t ) = (0.008079266) ⋅ (1.013731)t
1.1 P.24
SITUATION B
Figure 8 shows that the approximation is a
reasonably good ‘‘fit.’’
1.1 P.25