Energy Efficiency in Industrial and Household Sectors
Bạn đang xem bản rút gọn của tài liệu. Xem và tải ngay bản đầy đủ của tài liệu tại đây (1018.73 KB, 16 trang )
Chapter 3
Energy Efficiency in Industrial and
Household Sectors
Overview
• Implementing the energy-efficiency measures identified in this report
would reduce required power capacity additions in 2015–30 by 11.7 GWe
(7 percent), reduce 2030 generation requirements by 11 percent, reduce
c apital expenditure (CAPEX) for power plants by $19.1 billion, and reduce
imported coal requirements by 24 million tons per year.
• Energy efficiency in the low-carbon development (LCD) scenario also contributes 35 percent of carbon dioxide (CO2) emissions reductions (314 million
tons of carbon dioxide equivalent [MtCO2e]), and lowers energy consumption
by 350,000 gigawatt-hour equivalent (GWhe) compared with the businessas-usual (BAU) scenario.
• Dominant industrial and household sector energy-efficiency programs can
reduce cumulative CO2 emissions at a composite marginal abatement cost
(MAC) of −$4.24, or $1.4 billion below BAU levels.
• Enforcing the Energy Efficiency and Conservation Law, combined with accessing financial resources, will improve the implementation of energy-efficiency
programs in Vietnam. In light of available opportunities, there is a need to
strengthen energy-efficiency institutional capacity, as well as to review the
adequacy of public and private investments in energy efficiency.
• Energy-efficiency opportunities quantified in the report can be considered elements of an investment pipeline and used to encourage banks to finance energy
efficiency, given the magnitude of the opportunities available. They can also be
used to define targets for specific industries in a national energy-efficiency
program.
Introduction
Energy efficiency promises to be one of the most significant contributors to
Vietnam’s goal of improving economic competitiveness while lowering CO2
emissions. Energy-efficiency measures described in the LCD scenario have the
Exploring a Low-Carbon Development Path for Vietnam • />
29
30
Energy Efficiency in Industrial and Household Sectors
potential to reduce electricity demand by a cumulative 350,000 GWhe between
2015 and 2030, without detrimental effects on the end services or products provided. They would potentially lower power capacity requirements by 11.7 GW
during the modeling period, and subsequently contribute 35 percent of the CO2
emissions reduction projected in the LCD scenario. Most of the energy-efficiency
measures outlined have negative MACs—that is, the low-carbon options (LCOs)
are less costly than the baseline alternatives. Many countries integrate energy efficiency in their strategic energy programs. China has an energy-efficiency program
whose goal is to reduce energy intensity by 16 percent between 2011 and 2015;
Brazil’s goal is to save 106 terawatt-hours (TWh) by 2030—25 percent of total
consumption in 2010, and is expected to be 10 percent of consumption by 2030.
Decoupling economic growth from energy demand growth offers a significant
opportunity to increase economic competitiveness. Vietnam’s energy demand
has been growing in tandem with its economic growth rate. While the economy
is projected to grow by 7.14 percent per year until 2030, energy demand
is expected to grow by 9.3 percent under the BAU scenario. Decoupling
the growth in energy demand from economic growth—that is, reducing their
correlation—would lead to lower energy costs per unit of output, and thus make
Vietnamese products more competitive. China successfully weakened the correlation between its economic growth and primary energy consumption.
Vietnam’s energy intensity is the highest among major East Asian economies.
Vietnam’s industrial sector plays a crucial role in the nation’s economy. It generated around 42 percent of the gross domestic product (GDP)(ILO 2011) and
provided employment to nearly 21 percent of the workforce in 2011.1 Industrial
energy use grew from 3.6 million tons of oil equivalent (toe) in 1998 to
13.9 million toe in 2007—almost fourfold in just nine years. In 1998 the industrial
sector accounted for one-third of final energy use; by 2007 it accounted for
46 percent. The significant influence of the industrial sector is partly responsible
for Vietnam’s energy intensity being about 10 times larger than that of Japan,
where the service sector plays a more significant role. Vietnam’s industry is also
generally more energy intensive than the global energy intensity benchmark.
Vietnam’s iron and steel (I&S) plants use twice as much energy as similar plants
around the world to produce the same amount of steel. This is because this and
many other sectors, such as cement and textiles, use relatively old technologies.2
Investing in energy efficiency in this sector would not only improve the competitiveness of the sector but also reduce CO2 emissions. For instance, investing in
energy-efficient measures in I&S plants would result in about 45,000 GWhe
reduction in energy consumption (that is, cost reduction) between 2015 and 2030.
Domestic power sources will not be able to meet energy demand at current economic growth rates. Between 2000 and 2010 Vietnam’s electricity
demand grew by about 14 percent per year, and electricity generation reached
100,189 gigawatt-hours (GWh) in 2011, which was roughly four times the
25,694 GWh generated in 2000.3 Vietnam’s industrial power demand is
expected to grow by 7 percent between 2010 and 2030 in the BAU scenario,4
and Electricity Vietnam (EVN) forecasts 9 percent growth in total electricity
Exploring a Low-Carbon Development Path for Vietnam • />
31
Energy Efficiency in Industrial and Household Sectors
demand during the same period. Thus Vietnam might have to start relying on
imported coal or liquefied natural gas (LNG) starting as early as 2019 to feed its
power plants. This would imply significant risks for energy security and further
industrial sector import dependence.
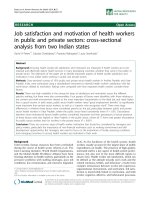
The successful implementation of energy-efficiency measures identified in
this study would reduce grid capacity additions by 1,400 megawatts (MW) in
2015–20 and by 10,300 MW in 2021–30. Energy-efficiency measures can defer
600 MW of subcritical coal plants and eliminate the need for 800 MW of supercritical coal plants using imported coal through 2020.5 The major revision to the
BAU capacity expansion plan occurs between 2021 and 2030, with the elimination of 10,300 MW (figure 3.1).6 Thus the combined impact of all energy-
efficiency measures considered in this study reduces total generation requirements
in 2015–30 by 7 percent and 2030 generation requirements by 11 percent. The
total reduction of 11,700 GW of capacity additions reduces CAPEX by
$19.1 billion. It is also important to note that the energy-efficiency measures
considered here have impacts that extend well beyond the 2030 end date considered in this study. The major industrial measures considered involve investment in technologies with lives of at least 20 years. Household refrigerators have
expected lives of at least 15 years. Efficient units added in 2030 would continue
to produce savings for another 15–20 years. While this study logically focuses on
efforts to reach the Vietnam Green Growth Strategy (VGGS) targets through
2030, beneficial emissions reductions would extend well beyond that year.
From the demand side, 19.3 percent of grid electric demand reductions during
2015–30 could come from I&S, cement, fertilizer, and pulp and paper industries
(table 3.1; see also figure 3.2). Refineries were also included in the large industry
Figure 3.1 Reduced Electricity Generation Capacity Additions: EE$10 vs. Business as Usual
14
12
10
GW
8
6
4
2
0
–2
Coal sub
(0.6)
Coal super
2015–2020
Nuclear
2021–2030
Total
2015–2030
Source: World Bank estimates.
Note: BAU = business as usual; EE = energy efficiency; GW = gigawatts.
Exploring a Low-Carbon Development Path for Vietnam • />
32
Table 3.1 Grid Electricity Reductions Due to Increased Energy Efficiency
Grid electric demand reductions from energy efficiency
Sector
Six large industries (1)
All other industries
Total industry
Households top 5 (2)
Households next 8 (3)
Household 13 end uses
Transport (4)
Total
Trans distn losses
Total (5)
Total
MACs
calculated
Ref point
Units
2015
2020
2025
2030
Total
2015–30
666
364
1,030
757
52
809
−201
1,638
9.48%
1,810
1,709
1,721
3,337
5,058
4,100
482
4,581
−814
8,825
9.11%
9,709
8,629
4,749
13,299
18,048
9,602
1,446
11,049
−1,850
27,247
8.75%
29,858
26,774
12,684
31,091
43,775
17,120
2,764
19,884
−2,985
60,674
8.40%
66,239
59,981
68,077
170,296
238,373
120,035
17,717
137,753
−22,653
353,473
8.67%
387,022
348,325
Yes
No
Partial
Yes
No
No
Yes
Partial
At User
At User
At User
At User
At User
At User
At User
At User
GWhe
GWhe
GWhe
GWhe
GWhe
GWhe
GWhe
GWhe
Partial
Partial
Total supply
Dom grid gen
GWhe
GWhe
(1) Large i&s; small i&s, cement, fertilizer, refinery, pulp&paper
(2) Lighting; refrigerator, air conditioner, water heaters, fans
(3) Radio, stereo, cd player, tv, dvd/vcr, computer, washing machine, thermo pot
(4) Increased use in transport due to electric bikes replacing gas bikes
(5) Includes imports and captive generation
Source: World Bank estimates.
Note: GWhe = gigawatt-hour electric; MAC = marginal abatement cost; Trans Distn Losses = transmission and distribution losses.
% Shares
19.3
48.2
67.4
34.0
5.0
39.0
−6.4
100.0
109.5
90.0
2015–30 %
of BAU
17.2
7.4
8.9
19.6
10.6
17.7
−59.0
10.1
2030
% of BAU
40.0
13.0
16.1
26.9
22.0
24.2
−85.5
17.0
33
Energy Efficiency in Industrial and Household Sectors
Figure 3.2 Electric Demand Reductions at the Consumer Level
70,000
60,000
50,000
GWhe
40,000
30,000
20,000
10,000
0
Household next 8
All other industry
Household top 5
Six large industries
Source: World Bank estimates.
Note: GWhe = gigawatt-hour electric.
category, but reduced emissions from energy efficiency there did not include
reduced electricity demands. Efficiency standards for five household uses account
for 34 percent of grid electric demand reductions by 2030. The combined grid
demand reductions from energy efficiency in the industry and household sectors
are offset to a limited extent by the 6.4 percent share of demand increases from
the conversion of gas to electric bicycles (e-bikes) in the transport sector. Clearly,
the 48.2 percent share of grid electric demand reductions for “all other” industry
requires intensive additional research to establish a more comprehensive set of
energy-efficiency measures with specific estimates of MACs and related emissions reduction potential. Reductions of 40 percent for large industry and
26.9 percent for five household end uses in 2030 are impressive, but the lack
of sufficient data for other industries leaves substantial untapped potential for
further research.7
Energy Efficiency and Financial Competitiveness
As a means of reducing CO2 emissions and improving economic competitiveness, energy-efficiency measures in Vietnam are found to generally have negative
MAC curves (MACCs) (figure 3.3). A MACC consists of a number of columns,
each of which represents an opportunity to reduce CO2 emissions. The width of
the column denotes the amount of CO2 that could be potentially abated, and
the height denotes the present cost of avoiding one ton of CO2 (tCO2) with this
opportunity. Hence, negative costs (bars below the horizontal axis) indicate net
Exploring a Low-Carbon Development Path for Vietnam • />
30
20
29
28
Transport
20
20
27
26
20
20
25
23
24
20
20
20
21
22
20
20
20
20
19
20
18
20
17
20
16
20
20
15
–10,000
34
Energy Efficiency in Industrial and Household Sectors
Figure 3.3 Marginal Abatement Cost Curve for Industrial Sector Energy Saving (Electricity and Fossil Fuels)
RTS pulping
Coke dry quenching
Vertical roller mill
Eccentric bottom tapping
Other efficiency measures
Cement
30
Abatement cost $/tCO2
20
10
0
Top pressure recovery
Transformers
VFD
Waste heat recovery
Process control
Oxyfuel burners
Scrap preheating
Bottom stirring
–10
–20
–30
10
20
30
40
50
60
70
80
90
100 110 120 130 140 150 160 170 180 190 200
Cumulative abatement potential 2010–2030 MtCO2
Source: World Bank estimates.
Note: MtCO2 = million tons of carbon dioxide; RTS = lower Retention time, higher Temperature, higher refiner Speed; tCO2 = tons of carbon
dioxide; VFD = variable frequency drive.
economic benefit to the economy over the life cycle of the abatement opportunity, while positive costs (bars above horizontal axis) indicate incremental costs
compared to the BAU case. Thus the role of the MACC is to help policy makers
identify opportunities for cost-effective CO2 reduction. (Appendix B explains
the methodology and main assumptions used to create the MAC curves.)
Emission reductions from “other efficiency measures” in industry are quite
significant, and can only be estimated at indicative levels due to the lack of
sufficient data for Vietnam. Electricity demand reductions reported in “other
efficiency measures” are estimates based on typical results achieved in other
countries that have established industrial energy-efficiency programs. Recent
studies by the American Council for an Energy Efficient Economy of extensive
sets of industrial energy-efficiency measures document a levelized cost of energy
(LCOE) of $30 per MWhe (megawatt-hour equivalent). This would imply total
incremental CAPEX in the range of $37 billion with an estimated MAC in the
range of $2.62 per ton of CO2 equivalent (tCO2e) for Vietnam.
Industrial energy efficiency reduces both electricity and fuel consumption;
the MACC for industrial measures that directly affect electricity consumption is
shown in figure 3.4.
More than 60 percent of emissions reductions from reduced grid electricity
demands by the large industry sector come from waste-heat recovery power
generation at large I&S and cement production facilities. The importance of
sound feasibility assessments and adequate financing mechanisms for efficient
power generation for large I&S and cement producers is clear (see table 3.2).
Exploring a Low-Carbon Development Path for Vietnam • />
35
Energy Efficiency in Industrial and Household Sectors
Figure 3.4 Marginal Abatement Cost Curve for Industrial Sector Electric and Energy Savings Options
250
Trap management
Flare gas
Combustion optimization
Pre-concentrator in urea plant
Isothermal CO converter
Kiln shell heat loss reduction
Steam pipe lines insulation
Natural gas in BF
Thermo mechanical pulping
Pulverized coal in BF
Paper drying
Abatement cost $/tCO2
200
150
100
50
Black liquor gasification
Dry kilns
Extended nip press
Recycled pulp
0
Sinter plant
Hot blast stoves
Hot charging
Furnaces
Continuous casting
–50
–100
5
10
15
20
25
30
35
40
Abatement potential MtCO2
Source: World Bank estimates.
Note: BF = blast furnace; CO = carbon monoxide; MtCO2 = million tons of carbon dioxide; tCO2 = tons of carbon dioxide.
Table 3.2 Summary of Select Industrial Marginal Abatement Costs that Affect Electricity
Demand
Industry
sector
Small I&S
Small I&S
Large I&S
Large I&S
Large I&S
Large I&S
EE measure
Improved process control
Transformer efficiency
Installation of VFD
Variable frequency drives
NG injection
Heat recuperation from hot
blast stoves
Variable frequency drives
Waste heat recovery power
Vertical roller mill
Variable frequency drives
RTS pulping
Cement
Cement
Cement
Fertilizer
Pulp & Paper
Total
Weighted Average
2015–30
MtCO2 Redn (1)
% Shares
MAC
$/tCO2
2015–30
CAPEX MUSD (2)
3.10
0.97
32.93
0.09
3.82
5.9
1.8
62.6
0.2
7.3
(9.59)
(7.33)
(8.88)
(7.81)
(3.96)
5.1
9.1
56.2
0.6
52.2
3.26
0.58
4.76
2.85
0.02
0.28
52.64
6.2
1.1
9.0
5.4
0.0
0.5
100.0
12.49
(8.17)
0.46
11.46
(7.63)
33.74
204.3
2.7
232.1
174.6
0.0
50.1
787.0
(5.03)
(1) Million Metric Tons Emission Reductions
(2) CAPEX equals incremental investment vs the BAU Baseline in Million USD
Source: World Bank estimates.
Note: CAPEX = capital expenditure; EE = energy efficiency; I&S = iron and steel; MAC = marginal abatement cost;
MtCO2 = million tons of carbon dioxide; MUSD = millions of U.S. dollars; Redn = reduction; RTS = lower Retention time, higher
Temperature, higher refiner Speed; tCO2 = tons of carbon dioxide.
Exploring a Low-Carbon Development Path for Vietnam • />
45
36
Energy Efficiency in Industrial and Household Sectors
With a weighted average MAC of −$5.03, these industrial energy-efficiency
measures are clearly high-priority, cost-effective emissions reduction alternatives
with modest incremental CAPEX requirements.
Figures 3.5, 3.6, and 3.7 show the MACCs of the I&S producers, small-scale
steel producers, and cement producers, respectively (see appendix B for relevant
details).
Figure 3.5 Iron and Steel Producers: Marginal Abatement Cost Curves
Coke dry quenching
Continuous casting
Furnaces
Hot charing
Abatement cost $/tCO2
10
5
0
Hot blast stoves
Sinter plant
Top pressure recovery
Pulverized coal in BF
Variable speed drives
Natural gas in BF
Waste heat recovery
–5
–10
–15
10
20
30
40
50
60
70
80
90
Cumulative abatement potential 2010–2030 MtCO2
Source: World Bank estimates.
Note: BF = blast furnace; MtCo2 = million tons of carbon dioxide; tCO2 = tons of carbon dioxide.
Figure 3.6 Small Steel Producers: Marginal Abatement Cost Curves
Abatement cost $/tCO2
0
–5
–10
–15
Tranformers
Eccentric bottom tapping
Process control
Oxyfuel burners
–20
–25
–30
Scrap preheating
Bottom strring
1
2
3
4
5
Cumulative abatement potential 2010–2030 MtCO2
6
7
Source: World Bank estimates.
Note: MtCO2 = million tons of carbon dioxide; tCO2 = tons of carbon dioxide.
Exploring a Low-Carbon Development Path for Vietnam • />
37
Energy Efficiency in Industrial and Household Sectors
Figure 3.7 Cement Sector: Marginal Abatement Cost Curves
Dry kilns
Vertical roller mill
Cement
Abatement cost $/tCO2
40
20
0
–20
VFD
Kiln shell heat loss reduction
Combustion optimization
–40
1
2
3
4
5
6
7
8
9
10
11
12
Cumulative abatement potential 2010–2030 MtCO2
13
14
15
16
Source: World Bank estimates.
Note: MtCO2 = million tons of carbon dioxide; tCO2 = tons of carbon dioxide; VFD = variable frequency drive.
Figure 3.8 Household Sector: Marginal Abatement Cost Curves
0
Abatement cost $/tCO2
–2
–4
–6
–8
–10
–12
–14
Refrigerators
Air conditioners
Fans
Residential lighting
Solar heaters
–16
–18
–20
10
20
30
40
50
60
70
Abatement potential MtCO2
80
90
100
Source: World Bank estimates.
Note: MtCO2 = million tons of carbon dioxide; tCO2 = tons of carbon dioxide.
Energy Efficiency at the Household Level
Supporting energy efficiency in the five main household end uses reduces cumulative CO2 emissions by 120 million tons of CO2 equivalent (CO2e) by 2030,
with negative MACs. Well-developed efficiency standards enforced at the point
of sale can provide the emissions reductions summarized in figure 3.8 based on
estimated replacements and new purchases. Efficiency improvements for refrigerators and air conditioners can be achieved with no incremental investment.
Although new, more efficient refrigerators tend to have higher sticker prices,
Exploring a Low-Carbon Development Path for Vietnam • />
110
120
38
Energy Efficiency in Industrial and Household Sectors
the increases are principally due to added size and features rather than to the
inclusion of energy-efficient technology. The lighting improvements shown are
limited to compact fluorescent lamp (CFL) replacement of incandescent bulbs.
Much greater efficiency gains are possible at somewhat higher cost if lightemitting diodes (LEDs) are introduced in addition to or in lieu of CFLs. The item
“solar heaters” refers to the modest substitution of solar for electric water heating.
This would require education and promotion programs. It should be noted that
administrative and enforcement costs have not been included in the MAC estimates shown for either the industrial or household sectors.
Energy Efficiency: An Implementation Gap Assessment
Despite having energy-efficiency laws and programs in place, Vietnam’s energy
consumption quadrupled in the decade leading up to 2011 and its energy elasticity reached 1.8. This section evaluates Vietnam’s programs against a framework
of typically successful energy-efficiency programs based on the World Bank’s
international experience. Successful programs typically consist of the right combination of legislation, policies and regulations, financing and implementation
mechanisms, capacity-building and awareness programs, and market characteristics. Each of these is described in figure 3.9.
Energy-efficiency legislation is generally in place, but the government would
need to ensure that enforcement is at a level commensurate with the policy goals.
The Energy Efficiency and Conservation (EE&C) Law (2010) is the cornerstone
of the legal energy-efficiency framework. The government issued 10 decisions,
decrees, and circulars as secondary legislation to support the law, but the law is
barely enforced and has had limited success.
Many policies and regulations are in place, but the implementing institutions
could be strengthened with additional resources. The Energy Efficiency and
Conservation Office (EECO) was established through Decision No. 79/2006/
QD-TTG dated April 14, 2006, and Vietnam’s National Energy-Efficiency
Program (VNEEP I) was established in the same year. The program had saved
4,900 kilotonnes of oil equivalent (ktoe) of energy when it ended in 2010, and
VNEEP II was launched in 2011. Additional programs include Standards and
Labeling (S&L), Promoting Energy Conservation in Small and Medium Scale
Enterprises in Vietnam (PECSME), and the building codes program run through
Vietnam Building Energy Efficiency Codes. The government also set a target of
5–8 percent energy savings between 2012 and 2015, allocated across provinces.
All these programs have had limited success because the responsible institutions
need to be strengthened. The EECO is temporary, and it is uncertain what will
happen to the office when the VNEEP II ends. Moreover, the energy-efficiency
targets and agreements with large energy consumers are voluntary, and electricity
prices are subsidized; hence there are no incentives to implement energy-efficiency
measures.
Energy-efficiency financing and implementation capacity are limited.
Development institutions such as the International Finance Corporation (IFC)
Exploring a Low-Carbon Development Path for Vietnam • />
39
Energy Efficiency in Industrial and Household Sectors
Figure 3.9 Framework of a Typically Successful Energy Efficiency Program
Legislation
Overarching EE legal framework
(EE Law)
Policies and regulations
National EE action plan
Secondary legislation/rulebooks
National EE strategy
EE building codes
Building certificates
Appliance labelling
Equipment standards
Market
characteristics
Availability of ESCOs
Financing market: (# of banks lending
for EE, % of companies able to borrow
Data availability for market analysis
Metering of energy consumption
Appropriate electricity/energy pricing
ESPC regulations
Energy auditing regulation
Utility EE implementation actions
Performance contracting regulations
Vehicle fuel efficiency standards
Successful energy
efficiency
programs
Capacity building
and awareness
Energy auditor/manager training and
certification programs
Financing and
implementation
Financial incentives for EE
EE revolving fund
Commercial bank lending
(credit lines, guarantees)
Donor EE financing
Commercial ESCO financing
Residential home/appliance credit
Equipment leasing
Private sector training programs (banks,
ESCOs/EE service providers, end users)
EE project templates (audits, M&V
plans, EPC bidding documents, contracts)
EE awareness activities
Public recognition of successful EE
activities
Source: World Bank.
Note: EE = energy efficiency; EPC = engineer procure and construct; ESCOs = energy service companies; ESPC = Energy Savings Performance
Contracts; M&V = monitor and evaluate.
and the World Bank have provided some energy-efficiency financing. The
Ministry of Industry and Technology (MOIT) has a $1 million subsidy fund that
offers up to 30 percent of a project’s cost with a cap of $250,000 per project.
The government also funds energy audits, technical assistance, and training, and
promotes energy efficiency. But the incentives are limited and complex to use,
and banks are hesitant to lend for energy efficiency because they do not understand the sector well. Additionally, the interest rates are high, and there is virtually no project finance for energy efficiency in Vietnam.
Existing capacity-building and awareness programs can be strengthened. The
Vietnam Industry Association holds awareness-building workshops and provides
energy-efficiency training to its members. The government and universities also
provide training for energy managers. But there is limited energy-efficiency
awareness among small and medium enterprises (SMEs), and there is an
Exploring a Low-Carbon Development Path for Vietnam • />
40
Energy Efficiency in Industrial and Household Sectors
energy-efficiency capacity gap among workers, engineers, and managers. In an
attempt to raise awareness, the government publishes energy-efficiency success
stories. The distribution of these success stories could be widened. Many firms
lack focus on improving efficiency in existing production systems, but focus
instead on maximizing “production” by adding machinery. Banks are also more
comfortable lending for additional machinery.
The industrial sector is dominated by state-owned enterprises (SOEs), which
makes it harder for SMEs to thrive. Economic liberalization would encourage
the competition that drives firms to be efficient. The current energy prices in
Vietnam are generally lower than in other Association of Southeast Asian
Nations (ASEAN) countries. This largely discourages energy efficiency, and the
lack of market data makes it difficult to analyze the market. Energy service companies (ESCOs) are at a nascent stage—there are a couple of well-established
ESCOs such as Ho Chi Minh City Energy Conservation. Additionally, there is
limited investment (in terms of both fiscal and other resources) in developing
energy-efficiency research facilities and testing laboratories. Sixty percent of
lending is tied to SOEs, and this creates a barrier for private enterprises that
would otherwise use energy efficiency as a competitive instrument.
Key Recommendations
It is critical that energy-efficiency measures be implemented rapidly, not only
because of the cost-effectiveness of these measures but also to allow time to
estimate the revised supply options for displacing coal-based generation in the
electricity sector. Based on the findings of this study, energy-efficiency programs
can be implemented as early as 2015 to reduce grid electric demand through
2030 and beyond. While this is an aggressive schedule, it avoids unnecessary
costs. Every year Vietnamese firms acquire substantial amounts of electrical
equipment and appliances. Failure to identify and promote efficient technologies
represents lost opportunities for cost-effective emissions reductions. This is particularly critical for energy-efficiency measures designed to reduce grid electricity
demands: many power plants coming on line in 2021 will close financing in 2016
and begin construction in 2017.
EE&C law enforcement and the strengthening of relevant institutions would
jump-start energy efficiency in Vietnam. While Article 33 of the EE&C law
mandates that major energy consumers develop five-year energy-efficiency plans,
and Article 34 mandates that they engage energy auditors certified by the
Government of Vietnam (GoV) to conduct energy audits every three years, there
are no mandatory performance-based targets. As a result, there are virtually no
incentives to implement energy-efficiency investments. International best practices indicate that mandatory performance-based targets would be very effective
in spurring energy-efficiency investments compared to voluntary input-based
targets. The GoV would need to break the national energy-efficiency targets
down into province- or enterprise-specific targets, and hold officials responsible
through penalties and incentives for meeting the targets. The EECO would need
Exploring a Low-Carbon Development Path for Vietnam • />
Energy Efficiency in Industrial and Household Sectors
to be strengthened or a separate energy-efficiency institution set up to effectively
support the program. The institution would need more resources, independent
decision-making power, and a relatively high rank to coordinate across ministries.
Lastly, the program would need an effective delivery model (such as in Ho Chi
Minh City, mentioned above). China offers an example of a successful, mandatory energy-efficiency target program. The Chinese government set targets to
reduce energy intensity per unit GDP by 20 percent in 2005–10 and 16 percent
in 2011–15. The national target was allocated to each province, and the provincial leaders were held accountable. The government also signed specific energyefficiency targets with the nation’s top 10,000 energy consumers, which
accounted for two-thirds of China’s energy use.
Coupling financing with EE&C law enforcement and institutional strengthening would significantly improve the implementation of energy-efficiency programs. Energy-efficiency targets without financial incentives would not succeed.
The GoV could provide financial support using different mechanisms: guarantees, credit lines, grants, subsidies, rebates, and tax relief. Partial Risk Guarantee
Funds could be developed so as to support the nascent ESCO industry. There is
a need to raise the current energy-efficiency subsidy program and make it fairly
simple for enterprises to utilize available resources. The government could also
provide incentives for the public to purchase more energy-efficient appliances
such as refrigerators, air conditioners, and televisions where needed. The Chinese
government spent $25 billion between 2006 and 2010 to support energy efficiency, and the Turkish government provided $2 billion worth of guarantees to
finance energy efficiency in the five years leading up to 2013. Raising the needed
resources from levies on energy tends to be the most financially stable way to
raise energy-efficiency finance. This could be supplemented by donor financing.
There would need to be a differentiated approach, taking into account the
challenges in each sector. For instance, investments in the industry sector are
fairly sizable and concentrated among a few stakeholders, while investments in
the residential sectors are fairly small and dispersed. Depending on the goals
of the implementing entity, the government might lean toward one sector more
than the other. The capabilities of the entity and financiers involved would influence some of the implementation decisions as well.
At the implementation level, there are some specific recommendations that
tie in closely to the Green Growth Action Plan (GGAP) approved on March 20,
2014. As applicable, the GGAP activities are cross-referenced in endnotes to the
following list of recommendations:
• Almost 80 percent of the emissions reductions from energy-efficiency measures for large industry come from waste-heat recovery and new turbine generation for large I&S and cement producers. The GoV should ensure that the
planning of potential generation by such producers is closely coordinated with
grid planning, that interconnection policies and possible sales to the grid are
clearly defined, and that the economics of such projects are sufficiently documented to allow for commercial financing.8
Exploring a Low-Carbon Development Path for Vietnam • />
41
42
Energy Efficiency in Industrial and Household Sectors
• Variable frequency drives and transformer efficiency programs constitute the
other major programs for large industry. The GoV should develop specific
policies for these programs and provide regular reporting of reliable electric
rate forecasts to support such analyses by interested industrial facilities.9
• The most significant gap in industrial energy-efficiency program development
lies in the compilation of reliable survey and energy audit data to support
evaluation and implementation of electricity demand reductions by SMEs.
Commitments to reduce electric demand by 1 percent per year for “all other”
industries should be established.10
• Efficiency standards should be established for residential refrigerators, air conditioners, and lighting, and enforced at the point of sale starting in 2015.11
• Energy-efficiency resource plans should be separately identified and included
in all future power sector development plans. (The GGAP focuses on the
2014–20 period; longer-term integration of energy efficiency with power sector planning for 2021–30 is also needed based on near-term energy-efficiency
program development.)
Notes
1.World Bank data indicators.
2. />-reduce-energy-consumption-31003-11224.html.
3. /> 4.IEVN estimates.
5.Assuming that the eliminated supercritical coal plants operate at 42 percent efficiency
with annual capacity factors of 75 percent, the total reduction of 10,700 MW of such
plants would reduce coal imports by 24 million tons per year.
6.Implementation of the energy efficiency programs is not expected to influence capacity additions of hydro, gas, or renewable energy generation plants in 2015–30.
7.All grid electric demand reductions related to energy efficiency are logically estimated
initially at the consumer level as 9.5 percent (transmission and distribution [T&D]
losses) then summed to arrive at reduced grid generation requirements.
8.This corresponds to the Green Growth Action Plan (GGAP) activities 3, 14, 16, 37.
9.This corresponds to GGAP activities 3, 14, 16, 37.
10.This corresponds to GGAP activities 15, 16, 37.
11.This corresponds to GGAP activities 4, 6, 11, 12, 13, 62.
Bibliography
APEC (Asia-Pacific Economic Cooperation). 2009. Review of Energy Efficiency in Vietnam.
Singapore: APEC.
ASTAE (Asia Sustainable and Alternative Energy Program). 2010. Vietnam: Expanding
Opportunities for Energy Efficiency. Washington, DC: ASTAE.
Exploring a Low-Carbon Development Path for Vietnam • />
Energy Efficiency in Industrial and Household Sectors
Chu, T. 2013. “Cement Industry Strives to Reduce Energy Consumption.” http://
tietkiemnangluong.com.vn/en/activity-news/cement-industry-strives-to-reduce
-energy-consumption-31003-11224.html.
Cooper, G. 2012. “Vietnam’s Renewable Energy Legal Environment.” http://enerexpo
.com.vn/images//4E-Vietnam-Renewable-Energy-Legal-Environment_23-March
-2012.pdf.
ILO (International Labour Organization) Office in Vietnam. 2011. Vietnam Employment
Trends 2010. Geneva: ILO. />-bangkok/@ilo-hanoi/documents/publication/wcms_151318.pdf.
Morrow III, William R., Ali Hasanbeigi, and Jayant Sath. 2013. Assessment of Energy
Efficiency Improvement and CO2 Emission Reduction Potentials in India’s Iron and Steel
Industry. s.l.: Lawrence Berkeley National Laboratory, Berkeley.
NEDO (New Energy and Industrial Technology Development Organization). 2008.
Global Warming Countermeasures Japanese Technologies for Energy Savings/GHG
Emission Reduction. Kawasaki City: NEDO.
U.S. EPA (U.S. Environmental Protection Agency). 2010. Available and Emerging
Technologies for Reducing Greenhouse Gas Emissions from the Pulp and Paper
Manufacturing Industry. North Carolina: U.S. EPA.
World Bank. 2009. Potential for Climate Change Mitigation Opportunities in the Energy
Sector (Vietnam). Washington, DC: World Bank.
———. 2009a. Potential for Climate Change Mitigation Opportunities in the Industry Sector
(Vietnam). Washington, DC: World Bank.
———. 2010. Vietnam: Expanding Opportunities for Energy Efficiency. Washington, DC:
World Bank.
Exploring a Low-Carbon Development Path for Vietnam • />
43