Unraveling a Secret Vietnam’s Outstanding Performance on the PISA Test
Bạn đang xem bản rút gọn của tài liệu. Xem và tải ngay bản đầy đủ của tài liệu tại đây (1.73 MB, 45 trang )
Public Disclosure Authorized
Public Disclosure Authorized
Policy Research Working Paper
7630
Unraveling a Secret
Vietnam’s Outstanding Performance on the PISA Test
Suhas D. Parandekar
Elisabeth K. Sedmik
Public Disclosure Authorized
Public Disclosure Authorized
WPS7630
Education Global Practice Group
April 2016
Policy Research Working Paper 7630
Abstract
This paper seeks to find an empirical explanation of Vietnam’s outstanding performance on the Programme for
International Student Assessment (PISA) in 2012. Only
a few developing countries participate in the assessment.
Those who do, with the unique exception of Vietnam, are
typically clustered at the lower end of the range of the
Programme for International student Assessment scores.
The paper compares Vietnam’s performance with that of
a set of seven developing countries from the 2012 assessment’s data set, using a cut-off per capita GDP (in 2010
purchasing power parity dollars) of $10,000. The seven
developing countries’ average performance lags Vietnam’s
by more than 100 points. The “Vietnam effect” is difficult
to unscramble, but the paper is able to explain about half
of the gap between Vietnam and the seven countries. The
analysis reveals that Vietnamese students may be approaching their studies with higher diligence and discipline, their
parents may have higher expectations, and the parents
may be following up with teachers regarding those expectations. The teachers themselves may be working in a
more disciplined environment, with tabs being kept on
their own performance as teachers. Vietnam may also be
benefiting from investments in pre-school education and
in school infrastructure that are disproportionately higher
when compared with Vietnam’s per capita income level.
This paper is a product of the Education Global Practice Group. It is part of a larger effort by the World Bank to provide
open access to its research and make a contribution to development policy discussions around the world. Policy Research
Working Papers are also posted on the Web at . The authors may be contacted at esedmik@
worldbank.org.
The Policy Research Working Paper Series disseminates the findings of work in progress to encourage the exchange of ideas about development
issues. An objective of the series is to get the findings out quickly, even if the presentations are less than fully polished. The papers carry the
names of the authors and should be cited accordingly. The findings, interpretations, and conclusions expressed in this paper are entirely those
of the authors. They do not necessarily represent the views of the International Bank for Reconstruction and Development/World Bank and
its affiliated organizations, or those of the Executive Directors of the World Bank or the governments they represent.
Produced by the Research Support Team
Unraveling a Secret: Vietnam’s Outstanding
Performance on the PISA Test
Suhas D. Parandekar
Elisabeth K. Sedmik
Global Practice for Education, The World Bank
Keywords: PISA; Vietnam; Oaxaca-Blinder Decomposition; Fryer-Levitt; Economics
of Education.
JEL Classification Numbers: I21 (Analysis of Education); I28 (Government Policy);
Z18 (Public Policy).
This paper has been written using open source software: R for the econometric analysis and graphics and LaTeX for typesetting. Thanks to all who make free software
possible and to OECD for making the PISA data freely and easily available to anyone.
The R and Latex code used in writing this paper is freely available for download at
PAPER. The authors would like to thank World Bank
colleagues Amer Hasan, Marguerite Clarke, and Thanh Thi Mai for reading earlier versions
of the paper and providing helpful feedback. Errors and omissions are the responsibility of
the authors only.
1
Introduction
Vietnam participated in the Programme for International Student Assessment (PISA)
for the first time in 2012 and its performance has been much higher than other developing
countries that take part in this OECD led initiative. PISA scores of 15 year-olds in Mathematics, Reading and Science are calibrated to an OECD mean of 500 and standard deviation
of 100 points. Only a few developing countries take part in PISA, perhaps because most of
them have results much lower than the OECD countries. In the OECD-PISA 2012 database,
there are seven countries other than Vietnam with a per capita GDP (in 2010 PPP dollars)
below US$ 10,000 - Albania, Colombia, Indonesia, Jordan, Peru, Thailand and Tunisia. At
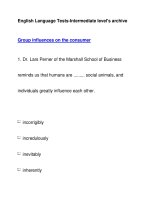
US$ 4,098, Vietnam’s GDP per capita is the lowest of this group. Figure 1 indicates a positive, albeit non-linear correlation between GDP per capita and PISA test scores. Vietnam,
represented by a red star, lies much above the other developing countries clustered in the
lower left hand corner of Figure 1. With a mathematics mean score of 511, Vietnam is more
aligned to Finland (519) and Switzerland (531), rather than Peru (368) and Colombia (376).
700
600
500
Shanghai−China
400
Vietnam (511)
Finland
(519)
Switzerland
(531)
Colombia (376)
Peru (368)
300
PISA Math Average Score 2012
Figure 1: PISA 2012 results compared with GDP per capita
0
10000 20000 30000 40000 50000 60000
GDP per Capita in PPP 2010
Source: OECD-PISA database
The weighted average mathematics score of the seven developing countries is 383. It
is helpful to understand the significance of the 128 point difference of the seven countries
as compared with Vietnam. According to a recent OECD publication [OECD, 2013a], “an
entire proficiency level in mathematics spans about 70 score points –a large difference in the
2
skills and knowledge students at that level possess. Such a gap represents the equivalent of
about two years of schooling in the typical OECD country.” Applying this heuristic would
imply a nearly 3 year difference in educational attainment between Vietnam and the group of
seven developing countries in the PISA database. It should be noted at the outset that crosssection data from one application of PISA does not permit causal inference, but correlations
can still provide useful insights. The difference is not only for mathematics and not just in
the mean score, but spanning the entire test distribution, as can be seen in Figure 2.
Figure 2: Kernel Density comparison between Vietnam and other Developing Countries
OECD Average
−200
0
200
400 500 600
Science Score
(a) Science
800
1000
0.004
Density
GROUP OF 7
Vietnam
0.000
Density
GROUP OF 7
Vietnam
0.002
0.004
OECD Average
0.000
0.002
0.004
0.002
GROUP OF 7
Vietnam
0.000
Density
OECD Average
0
200
400 500 600
800
Mathematics Score
(b) Mathematics
1000
−200
0
200
400500600
800
1000
Reading Score
(c) Reading
A range of alternative classifications are possible to organize the explanatory factors available in the OECD-PISA database. Figure 3 presents four sets of factors, starting clockwise
from the right. This is admittedly an arbitrary classification, utilized merely for expository
purposes as we consider each of the constituent variables in turn.
Figure 3: Conceptual Scheme based on available comparative variables
3
The approach of this paper is as follows. We begin in Section 2 by examining closely the
mean differences between Vietnam and the collective group of seven developing countries,
termed as “Dev7” for this paper (not to be confused with the G-7 of wealthy countries).
Comparing means in this context is a first pass at understanding the performance anomaly of
Vietnam on empirical grounds. Do Vietnamese 15 year olds somehow enjoy better cultural,
social or civic endowments to balance their economic disadvantages? An examination of
mean differences will provide us with a first set of tentative hypotheses.
The insights provided by mean differences need to be explored further by a regression
of the test scores on the explanatory variables. Large differences in means may not amount
to much if the associated variables are not correlated with test scores. In Section 3 we
adopt the regression methodology used by Fryer and Levitt to understand differences in
test score results of black children in the first two years of schooling in the United States
[Fryer and Levitt, 2004]. Fryer and Levitt are able to explain away all of a 0.62 standard
deviation negative achievement gap for black kindergarten children. In our case, we are able
to explain about half of a larger 1.28 standard deviaton positive achievement gap for Vietnam
compared to Dev7 countries. The lower ability of the Fryer-Levitt method to explain the
“Vietnam gap” is probably accounted for by the fact that per capita GDP lower than US
$ 10,000 is the only common support across diverse economic, political and educational
systems.
The Fryer-Levitt method deepens the understanding from mean comparisons, but what
it does not reveal may be as interesting as what it does. Our Fryer-Levitt adaption is
based on a pooled regression of eight developing countries, where we follow the fate of the
magnitude of the coefficient of the dummy variable representing the Vietnamese students
in the sample. However, we also need to investigate structural differences in the effects of
endowments between Vietnam and Dev7 countries. In Section 4, we adopt an approach first
used to explain variation in PISA performance between Germany and Finland by Andreas
Ammermueller [Ammermueller, 2007]. This is an adaptation of the popular Oaxaca-Blinder
decomposition of the wage earnings equation to uncover evidence of discrimination on the
basis of gender [Blinder, 1973] and [Oaxaca, 1973]. In this section, we examine closely the
structural differences between Vietnam and the Dev7 countries, including the contribution
of differences in endowments and the coefficients to the gap in test scores.
Even a multi-variate regression approach only proves correlation with nothing more than
a hint regarding causation, and so far we have only one year (2012) of PISA data for Vietnam.
Even though we cannot uncover causality, there are useful policy related conclusions that we
can derive from the analysis presented in this paper. There is a veritable industry of papers
4
regarding Finland’s PISA performance, directed mostly toward other OECD countries with
lower scores, for instance the United States. Vietnam’s superlative performance points to
a similar future stream of research, with the added advantage of relevance for developing
countries. Section 5 provides concluding ideas that might be among the first of many more
such ideas for future investigations of Vietnam’s performance.
2
Endowment Differences
Utilizing the categorization of explanatory factors presented in Figure 3, this section
analyzes mean differences in explanatory factors on students, parents, teachers and schools.
All variable means presented in the tables are statistically different at the 95% significance
level, unless otherwise noted in the footnotes and figures in parentheses represent standard
deviations. PISA documentation, especially the technical report - [OECD, 2014a] provides
rich definitions and explanations of the variables used. Appendix tables A2, A3 and A4 of
this paper accordingly provide references mapping the variables used in this paper and the
original PISA variable names.
2.1
Student Characteristics
Table 1 begins an exploration of differences in mean values between Vietnamese and
Dev7 student characteristics. The absence of differences is sometimes as important as the
presence of differences. Table 1 indicates no differences by age or gender of students. The
PRESCHOOL variable shows the first instance of a large statistically significant difference.
While 78.88% of Dev7 students reported attending pre-school, the number of students attending pre-school from the Vietnam sample was 91.20% - a sizable difference that is both
statistically and economically significant. The relationship between pre-school and later
educational outcomes has been studied very closely over the years. Longitudinal impact
evaluation studies regarding the Perry Pre-school project and Head Start in the US are
among the most cited studies in the economics literature1 . We can also see from the numbers of REPEAT in Table 1 that PISA takers in Vietnam were three times less likely to have
repeated a grade in the past (6.79% compared to 19.15%).
1
For detailed meta-analysis, see [Barnett, 1995] and [Schweinhart et al, 2005]
5
Table 1: Student characteristics and family background
Dev7 countries
Variable
Description
Vietnam
MS
Valid N
MS
Valid N
Fixed characteristics
FEMALE
Sex of student
0.5265
(0.4993)
41394
0.5336
(0.4989)
4882
AGE
Age of student
15.8211
(0.2895)
41394
15.7692
(0.2885)
4853
0.7888
(0.4082)
0.1915
(0.3935)
40114
0.912
(0.2833)
0.0679
(0.2516)
4866
Student’s prior history
PRESCHOOL
Attended Preschool
REPEAT
Grade repeating
40343
4860
Truancy from School
ST08Q01
Times late
for school
1.5131
(0.7648)
40663
1.1872
(0.4685)
4873
ST09Q01
Days unexcused
absence
1.2192
(0.5276)
40650
1.0999
(0.3527)
4875
ST115Q01
Times skipped
classes
1.2585
(0.545)
40632
1.0764
(0.3216)
4880
Parental background and family wealth
HISEI
Highest parental
occupational status
40.4196
(22.5168)
32814
26.6023
(19.855)
4860
MISCED
Educational level
of mother (ISCED)
3.1193
(1.9853)
40486
2.1744
(1.6059)
4844
WEALTH
Family wealth
possessions
-1.4606
(1.2267)
40821
-2.1343
(1.1656)
4881
CULTPOS
Cultural possessions
-0.1424
(0.9678)
39905
-0.2361
(1.0173)
4809
HEDRES
Home educational
resources
-0.7427
(1.1473)
40579
-1.0743
(0.9364)
4874
BOOK N
Number of books
in family home
53.6393
(94.5556)
39631
50.786
(75.4031)
4841
Notes: The variables relate to the questionnaires administered to students in the general
(non-rotated) booklet. For a more detailed description of variables, please see Tables A2,
A3, A4 in the Appendix.The variable means of Dev7 and Vietnam are statistically different
at the 95% significance level, except FEMALE. Figures in parenthesis represent standard
deviations.
The findings regarding PRESCHOOL and REPEAT indicate the possible importance of
the trajectory of the student prior to high school. Repetition rates are difficult as comparative
indicators of system quality because of the variations across countries in curriculum and
standards, but REPEAT is another interesting variable to keep in mind as a possible clue
to the mystery of Vietnam’s PISA performance. As in some other East Asian cultures,
Vietnamese parents expect their children to study hard. Though Mark Twain, translated
into Vietnamese, is quite a best seller for young readers in Vietnam, truancy from school is
not perceived benevolently by parents.2 Table 1 indicates a consistently lower truancy rate
2
A cultural explanation is possibly quite important in explaining Vietnam’s anomalous PISA results,
though the PISA data set may only be able to measure the possible effects of culture rather than measuring
cultural differences. Literature from the World Values Survey, that does seek to measure cultural differences,
6
for the three variables used. The question refers to the past two complete weeks of school
and we can see that Vietnamese students are less likely to have been late for school, have
fewer days of unexcused absence and skip fewer classes.3
The final set of variables in Table 1 concerns parental background and wealth at the students’ home, including cultural resources and books at home which may work to stimulate
cognitive development. The PISA database includes a number of indices to measure aspects
such as wealth. These indices are based on underlying data regarding occupations and possessions. The scaling of raw data to indices is described in detail in the PISA technical report
[OECD, 2014a]. For HISEI, which describes parental occupation status, the OECD mean
is 50 and the OECD standard deviation is 15. Table 1 shows that HISEI for Dev7 parents
stands at 40.42 and is thus much higher than 26.60 for Vietnamese parents. MISCED refers
to the International Standard Classification of Education (ISCED) developed by UNESCO.
Table 1 shows that the average level of mother’s education (MISCED) for Dev7 was just
over 3, meaning Upper Secondary education, while for Vietnam the mean was just over 2,
meaning Lower Secondary education. The WEALTH index is set for an OECD mean of
zero and standard deviation of 1. Dev 7 countries wealth level was -1.5 and Vietnam’s was
-2.1, which is consistent with the data regarding occupational classification and mother’s
education. These findings indicate the close correlation of these variables with GDP per
capita. Another interesting finding concerns the indices CULTPOS, cultural possessions and
HEDRES, educational resources at home which have an OECD mean 0 and a standard deviation 1, as well as BOOK N, the number of books in family home. CULTPOS includes
classical literature, books of poetry and works of art. HEDRES includes reference books and
books to help with school work as well as a study desk and “a quiet place to study”. These
three variables are also in line with per capita income - with the Dev7 mean being lower
than the OECD mean, and Vietnam being lower than the Dev7 mean. One explanation
regarding Vietnam’s PISA performance can probably be ruled out - it does not seem likely
that Vietnamese households spend a disproportionately higher amount of their income on
acquiring possessions such as books and other objects that would give their children an edge
in life.
indicates that Vietnam is a positive outlier on discipline and authority orientation[Dalton and Ong, 2005].
3
In the student’s questionnaire, there is a telling question - student’s have to agree or disagree on a four
point Likert scale to the statement “If I had different teachers, I would try harder at school.”. Converted
into an index, the mean for Vietnam at 0.363 is lower than that for Dev7 at 0.525. This suggests a tendency
in Vietnamese students for greater self-responsibility.
7
2.2
Student Effort
The phenomenon of primary and high school children taking extra classes to supplement in-school instruction in Vietnam is well known, see [Ha and Harpham, 2005] and
[Dang, 2007]. Table 2 indicates that while Dev7 students spent roughly 4.7 hours in such
classes (total of OUTMATH, OUTLANG and OUTSCIE), the Vietnamese student spends
nearly 2 hours more for a total of 6.6 hours per week in such classes, with the difference
being highest for OUTMATH. Vietnamese students also spent about 1 additional hour per
week doing homework (total of ST57Q01 and ST57Q02) compared to Dev7 students. The
highest difference in this set of variables concerns the variable ST57Q04, which relates to
extra classes taught by a commercial company. While most of the schools in Vietnam are
public or government schools, it is interesting to note that students report nearly 5 hours
of commercially provided extra lessons, while the total for Dev7 countries is only about 2
hours per week. Collectively, these variables indicate that Vietnamese students spent about
16 hours per week studying outside of school, compared to 13 hours per week for Dev7
students.
Table 2: Student studying time out of school
Dev7 countries
Variable
Description
Vietnam
MS
Valid N
MS
Valid N
Weekly out-of-school hours per subject
OUTMATH (r)
weekly out-of-school
lessons in math
1.828
(2.1539)
23603
3.1305
(2.3133)
3227
OUTREAD (r)
weekly out-of-school
lessons in ’test language’
1.2882
(1.9623)
23531
1.4483
(1.8837)
3223
OUTSCIE (r)
weekly out-of-school
lessons in science
1.5609
(2.0456)
23298
2.0927
(2.1776)
3205
Weekly out-of-school hours approach
ST57Q01 (r)
Out-of-school time
homework
5.0953
(5.0319)
23696
5.8145
(5.7196)
3164
ST57Q02 (r)
Out-of-school time
guided homework
2.551
(2.9296)
19355
2.8814
(3.2384)
2285
ST57Q03 (r)
Out-of-school time
personal tutor
1.7276
(2.7884)
20367
1.5749
(2.938)
3049
ST57Q04 (r)
Out-of-school time
classes by company
1.892
(3.3487)
19517
4.878
(4.8058)
3091
ST57Q05 (r)
Out-of-school time
parent/family member
2.1354
(3.055)
21542
1.7646
(3.2442)
3092
ST57Q06 (r)
Out-of-school time
learn on computer
2.588
(3.5519)
21338
1.8029
(3.0496)
3079
Notes: The variables relate to the questionnaires administered to students in the rotated booklet, marked with (r). For a more detailed description of variables, please see Tables A2, A3,
A4 in the Appendix. The variable means of Dev7 and Vietnam are statistically different at the
95% significance level. Figures in parenthesis represent standard deviations.
8
2.3
Student Attitudes
PISA applications in each test round have a focus on one of the subjects and in PISA 2012
the focus subject was mathematics. Mathematics happens to be the subject where the mean
score difference is highest between Vietnam and Dev7 countries. The PISA questionnaire
for students includes a very interesting series of questions regarding students’ perceptions of
their abilities, their effort and their reported practices. The details of these questions can
be found in the PISA technical report [OECD, 2014a]. Typically, each question includes
a set of Likert scaled items to which the student provides a discrete response on a four
point agree-disagree scale. These responses are then combined under specified algorithms
to provide an index value. For instance, MATWKETH, is meant to measure a student’s
“mathematics work ethic”. Students either agree or disagree with a set of 9 items on a 4
point likert scale - strongly disagree, disagree, agree and strongly disagree. The items include
items such as “I work hard on my mathematics homework”, and “I listen in mathematics
class”, “I keep my mathematics work well organized”. In the case of MATWKETH, when
a student agrees/strongly agrees with a positive statement, or disagrees/strongly disagrees
with a negative statement, he or she would tend to be deemed to have a stronger work
ethic towards mathematics. The raw data from the Likert scale is converted into an index
using IRT scaling procedures, so that the mean for OECD countries is 0 and the standard
deviation is 1. Table 3 indicates a most interesting finding regarding a range of such indices
from the PISA database.
Table 3: Student self-perception regarding mathematical ability and student effort
Dev7 countries
Variable
Description
Vietnam
MS
Valid N
MS
Valid N
0.4514
(0.9782)
26140
-0.0014
(0.6915)
3217
0.716
(1.165)
26509
-0.0923
(0.8395)
3220
Indices susceptible to ’bragging’ tag
MATWKETH (r)
Mathematics
work ethic
SUBNORM (r)
Subjective norms
in mathematics
OPENPS (r)
Openness to
problem solving
0.1949
(0.9787)
25612
-0.6125
(0.8708)
3207
SCMAT (r)
Self-concept of
own math skills
0.1673
(0.8101)
26222
-0.1896
(0.5903)
3249
Indices less related to bragging/being boastful
PERSEV (r)
Perseverance
in problem solving
0.3387
(0.9605)
25710
0.4475
(0.8767)
3211
ANXMAT (r)
Mathematics
Anxiety
0.3995
(0.7724)
26275
0.2115
(0.6354)
3248
MATINTFC (r)
Mathematics
intentions
0.092
(0.9837)
24827
0.3285
(1.0964)
3181
Notes: The variables relate to the questionnaires administered to students in the rotated
booklet, marked with (r). For a more detailed description of variables, please see Tables
A2, A3, A4 in the Appendix. The variable means of Dev7 and Vietnam are statistically different at the 95% significance level. Figures in parenthesis represent standard deviations.
9
The upper panel in Table 3 indicates a set of indices for which the scores of Vietnamese
students are lower than the scores of Dev7 students. For example, the score for MATWKETH
is 0.45 for Dev7 and 0 for Vietnam. The variable SUBNORM is supposed to measure
subjective norms regarding mathematics. This construct relates to a student’s perceptions
regarding how other people in the student’s life value mathematics. It includes items such
as “my friends enjoy taking mathematics tests” and “my parents believe it’s important for
me to study mathematics.” Presumably, when this measure is high, the student has a high
subjective norm for mathematics. Table 3 shows that the resulting mean for Dev7 countries
is 0.72 and the corresponding value for Vietnam is -0.09. The index SCMAT includes items
such as “I learn mathematics quickly” and “I have always believed that mathematics is one
of my best subjects”. Vietnamese students, who scored more than 1 standard deviation
above the Dev7 students on the PISA math test, scored half a standard deviation lower on
SCMAT. What is going on here?
This mini-mystery within the overall mystery of Vietnam’s PISA performance can possibly be resolved by looking at some further indices. The lower panel of Table 3 reports on
indices where the balance tips to the other side - these are indices where Vietnamese students
have a higher mean value than Dev7 students. These three indices bear close examination.
PERSEV consists of items that purport to capture perseverance with a task or a problem to
resolve; ANXMAT is a negative index (less is better) that deals with mathematics anxiety
(for example, an item included in this index states that “I get very nervous doing mathematics problems”); MATINTFC relates to future mathematics intention, including items such
as “I am planning on majoring in a subject in college that requires lots of mathematics”.
One possible explanation, as indicated in the heading of the Table 3 panels, is that
Vietnamese students are brought up in a culture that stresses the importance of modesty
and humility as a pathway to learning. They may find it difficult to say great things about
themselves, because of cultural norms against bragging or boasting. The lower panel in Table
3, on the other hand includes items that are less prone for an immodest interpretation. To
say that you are not afraid of mathematics may not be perceived as bragging. In this
context, the Vietnamese students are less anxious and more confident about the future role
of mathematics in their life.4
4
It will be straightforward to examine this hypothesis more closely by performing an IRT scaling of the
underlying items for the indices. We can then test for differences between Vietnam and the Dev7 countries in
values of the location parameters linking the items to the index. Systematic differences will tend to support
the hypothesis laid out here.
10
2.4
Mathematics Curriculum
In addition to beliefs and perceptions of students regarding mathematics in general, PISA
also seeks to closely investigate the issues related to the content of mathematics instructions.
PISA incorporates a very interesting approach to avoid or minimize the bragging or overclaiming problem referred to in the previous sub-section. The index FAMCON is constructed
out of a response to a question about mathematical concepts for which students are asked
“How familiar are you with the following items?” The list of items includes items such
as ‘Linear Equation’, ‘Quadratic Function’ and ‘Cosine.’ The list of items also includes
three nonsensical items or pseudo-concepts that sound fancy: ‘Proper Number’,‘Subjunctive
Scaling’ and ‘Declarative Fraction’. These items are termed as “FOIL”, and are used as
trick items to calibrate the response for over-claiming on part of the students. The index
without correction is presented as FAMCON, and the index with correction is presented as
FAMCONC. It is quite fascinating that with FAMCON, the ”uncorrected” version, Dev7
students come out apparently better than Vietnam students, with a mean value of 0.26 as
compared to 0.12. Unfortunately, this also included familiarity with non-existent items like
‘subjunctive scaling’ - or bragging. With the corrected version, FAMCONC, the Vietnamese
students turn out to do much better, with a mean value of 0.43 as compared -0.54 for Dev7,
as can be seen in Table 4.
Table 4: Student reported experience in mathematics
Dev7 countries
Variable
Description
FAMCON (r)
Vietnam
MS
Valid N
MS
Valid N
Familiarity with
math concepts
0.2559
(1.1654)
26164
0.1225
(0.6935)
3243
FAMCONC (r)
FAMCON corrected
with FOIL
-0.5441
(0.8768)
25832
0.4297
(0.9057)
3231
EXAPPLM (r)
Experience with
applied math tasks
0.1111
(1.06)
26133
-0.2418
(0.7624)
3243
EXPUREM (r)
Experience with pure
math tasks
-0.1384
(0.9809)
25973
0.1587
(0.8076)
3244
Notes: The variables relate to the questionnaires administered to students in the rotated
booklet, marked with (r). For a more detailed description of variables, please see Tables
A2, A3, A4 in the Appendix. The variable means of Dev7 and Vietnam are statistically different at the 95% significance level. Figures in parenthesis represent standard deviations.
The index EXAPPLM asks students about their experience during school work with
examples of applied mathematics problems. Similarly, the index EXPUREM refers to experience with examples of pure mathematics. Not surprisingly, Vietnamese students indicate
a lower performance on EXAPPLM and a higher performance on EXPUREM.5
5
It has been a long standing issue that Vietnamese students are expected to learn a curriculum that is
more “crammed” than the international norm and contains more theory and abstract mathematics rather
than applied mathematics. See [Danh Nam Nguyen and Trung Tran, 2013] and [Tuan Anh Le, 2007].
11
2.5
Parental Support at School
The publication of the bestselling book [Chua, 2011] “Battle Hymn of the Tiger Mother”
in 2011 ignited a firestorm of controversy. The book gave prominence in popular culture to a
vast academic literature regarding parenting styles and the perceived higher performance of
children from Asian immigrant families in the US and other Western countries. One of the
ways that parents influence their children’s educational outcome is through the interaction
that parents have with their child’s teachers and others at school. The PISA data includes
a question that tries to examine parental expectations towards schools. The question SC24
includes a statement “There is constant pressure from many parents, who expect our school
to set very high academic standards and to have our students achieve them.”6 Table 5
indicates a higher level of PARPRESSURE (an index derived from SC24) for Vietnam,
compared to Dev7. Another question (SC25) asks school principals about the proportion of
parents that take part in a set of 12 activities. While the question does not specify which
parent (or both) may be involved, the variables, that may contain more than one of these
activities, have been named after the mother for ease of exposition.
Table 5: Parental Support at School
Dev7 countries
Variable
Description
PARPRESSURE
Vietnam
MS
Valid N
MS
Valid N
Parental achievement
pressure
0.2665
(0.4421)
40372
0.3837
(0.4863)
4866
TIGERMOM
Parent initiates progress discussion
52.4472
(38.097)
41394
62.4183
(41.3743)
4882
DUTYMOM
Teacher initiates progress discussion
66.9737
(36.727)
41394
68.5543
(37.4796)
4882
VOLUMOM
Parent Participation Volunteering
35.2134
(38.8428)
41394
38.3623
(39.9773)
4882
TEACHMOM
Parent Participation Teaching Assistance
12.1764
(23.4241)
41394
38.2821
(41.5357)
4882
FUNDMOM
Parent Participation Fundraising
23.0784
(35.2134)
41394
59.6022
(44.0376)
4882
COUNCILMOM
Parent Participation School government
36.4546
(37.2252)
41394
23.1174
(36.4406)
4882
Notes: The variables relate to the questionnaires administered to schools. For a more detailed
description of variables, please see Tables A2, A3, A4 in the Appendix. The variable means of
Dev7 and Vietnam are statistically different at the 95% significance level. Figures in parenthesis represent standard deviations.
TIGERMOM refers to the reported proportion of parents who discussed their child’s
behavior or the child’s progress “on their own initiative”, to differentiate from cases where
parents might have done so following the initiative of the teacher, termed as DUTYMOM.
6
[Hsin and Xie, 2014] investigate in great detail data from a set of longitudinal surveys that cover thousands of children over a long period of time starting from their early childhood through high school. As part
of the explanation of the superior performance of Asian immigrant children, the authors report that “Asian
students report greater parental expectations of academic success.”
12
Table 4 shows a slightly higher number on DUTYMOM for Vietnamese parents compared to
Dev7, but a greater difference, more than ten percentage points for TIGERMOM. VOLUMOM refers to parents volunteering in various non-academic activities, such as field trips
or carpentry and yard work. Vietnamese parents appear to have a slight advantage with
regard to VOLUMOM, yet a much higher one when considering TEACHMOM, which refers
to parents volunteering as assistants to the teacher - 38.28% compared to 12.18% for Dev7.
Vietnamese parents also appear to be much more active in fund raising, looking at FUNDMOM, though they may have less formal influence through school committees.
2.6
Teacher Characteristics
Conventional measures regarding student-teacher ratios and teacher certification show
some advantage for Vietnam over Dev7 as shown in Table 6.
Table 6: Teacher characteristics and management
Dev7 countries
Variable
Description
Vietnam
MS
Valid N
MS
Valid N
0.6757
(0.4042)
35130
0.7961
(0.3978)
4586
188.1791
(158.6256)
33985
120.9773
(43.6092)
4777
40.5068
(40.8546)
39550
49.0086
(45.1706)
4762
Teacher numbers and teacher management
PROPCERT
Proportion of
certified teacher
SMRATIO
Mathematics
teacher-student ratio
SC35Q02
Professional development
in math in last 3 months
STUDREL (r)
Teacher student
relations
0.3794
(1.0178)
25870
0.0186
(0.8883)
3253
TCH INCENTV
Teacher appraisal
linked to incentives
-0.0317
(1.0301)
41394
0.2687
(0.6336)
4882
Quality assurance of mathematics teachers through . . .
TCH MENT
Teacher mentoring
as quality assurance
0.8566
(0.3505)
40734
0.9859
(0.1181)
4882
TCM PEER
Teacher peer review
of lectures, methods etc
0.7916
(0.4061)
41095
0.8382
(0.3683)
4882
TCM OBSER
Principal or senior
staff observations
0.8015
(0.3989)
41170
0.9785
(0.1451)
4882
TCM INSPE
Observation of classes
external inspector
0.5882
(0.4922)
41020
0.8664
(0.3402)
4882
Notes: The variables relate to the questionnaires administered to schools and students in the rotated booklet, marked with (r). For a more detailed description of variables, please see Tables A2,
A3, A4 in the Appendix. The variable means of Dev7 and Vietnam are statistically different at the
95% significance level. Figures in parenthesis represent standard deviations.
The overall student-teacher ratio is not much different for Vietnam and Dev7 and stands
at roughly 20 students per teacher. However, there are more specialized mathematics teachers per student in Vietnam, as shown by the values for SMRATIO (121 in Vietnam compared
to 188 for Dev7). There is a higher percentage of certified teachers in Vietnam and higher
13
reported professional development in mathematics (SC35Q02). A very interesting variable
from a policy point of view regards the incentives for teachers. School principals were asked
to what extent performance appraisal or other forms of feedback are related to incentives for
teachers in seven different forms, from salary and bonus to public recognition and greater
job responsibilities. The answers were to be given on a 4 point scale: ‘No change’, ‘A small
change’, ’A moderate change’ and ’A large change’. We converted the rating into a Rasch
index, scaled to an OECD mean of 0 and standard deviation of 1. The mean for Dev7 for this
index, TCH INCENTV was -0.03 for Dev7 and 0.27 for Vietnam, indicating greater presence
of teacher incentives in Vietnam. The final set of variables in Table 6 deal with the way that
quality assurance regarding teacher performance is carried out, with help of a mentor, peer,
supervisor or external inspector. These variables indicate a higher prevalence of oversight
for teachers in Vietnam, with the difference being greatest for external inspections (86.64%
in Vietnam compared to 58.82% in Dev7 countries).
2.7
Pedagogical Practices
Pedagogical practices are an outcome of a complex interaction between curriculum and
related educational policies, economic possibilities and the cultural and historical context. It
is difficult to trace differences in these practices in a quantitative survey.7 Table 7 presents a
few variables that seek to capture variation in pedagogical practices. They indicate the higher
prevalence of national policies in Vietnam regarding the use of computers in the classroom
and the use of a standardized curriculum that specifies what has to be taught each month.
There is no difference with regard to the use of a single textbook. There is some difference in
the use of formative student assessment, with slightly higher percentage of use of assessments
to monitor teachers and schools in Vietnam. COGACT represents an OECD-PISA index
variable based on response to student reports regarding classroom practices such as teachers
requiring students to reflect on a problem or develop new procedures rather than rely on
common practices. This variable shows a much lower level of cognitive activation in Vietnam
(-0.33) compared to 0.30 for Dev7. In the final set of classroom management variables, an
interesting variation can be seen in DISCLIMA, an index variable that measures disciplinary
climate in class, and is higher for Vietnam (0.38) than Dev7 (-0.02).
7
For an interesting recent qualitative study that seeks to emulate the TIMSS video study for Vietnam,
see [Vu Dinh Phuong, 2014].
14
Table 7: Pedagogical practices
Dev7 countries
Variable
Description
Vietnam
MS
Valid N
MS
Valid N
Policies applied
COMP USE
Math policy - use of
computers in class
0.4345
(0.4957)
40800
0.6447
(0.4787)
4815
TXT BOOK
Math policy same textbook
0.7905
(0.4069)
40557
0.7855
(0.4105)
4882
STD CUR
Maths policy standardized curriculum
0.8705
(0.3358)
40595
0.949
(0.22)
4882
Fromative assessment used to . . .
ASS SCH
monitor the schools
yearly progress
0.9111
(0.2846)
40555
0.9799
(0.1403)
4882
ASS TCH
make judgements on
teachers’ effectiveness
0.7764
(0.4166)
40400
0.9912
(0.0934)
4882
0.2998
(0.975)
26217
-0.3278
(0.6647)
3249
0.7105
(0.4536)
40788
0.8419
(0.3649)
4882
Cognitive Activation in Mathematics
COGACT (r)
Cognitive activation in
mathematics lessons
Classroom Management
STU FEEDB
Seeking written feedback from students
CLSMAN (r)
Teacher classroom
management (in math)
0.2394
(0.905)
25753
0.2163
(0.7761)
3252
DISCLIMA (r)
Disciplinary climate
in class (mathematics)
-0.0243
(0.9055)
26242
0.3747
(0.6926)
3254
Notes: The variables relate to the questionnaires administered to schools and students in the
rotated booklet, marked with (r). For a more detailed description of variables, please see Tables A2, A3, A4 in the Appendix.The variable means of Dev7 and Vietnam are statistically
different at the 95% significance level, except TXT BOOK. Figures in parenthesis represent
standard deviations.
2.8
School Characteristics
Table 8 indicates interesting basic differences between Vietnam and Dev7 school characteristics. Vietnamese schools are about half as likely to be private schools (8% compared
to 17%) and less dependent on funding from student fees; in Vietnam, student fees account
for 17% of the school’s financing, compared to 26% on average for Dev7. One very useful
comparison comes from a question regarding the geographic location of the high school. The
percentage of schools reported in a VILLAGE (defined in PISA by population below 3,000
inhabitants), was 46% of high schools in Vietnam compared to 14% of High schools in Dev7
countries. With CITY, defined by a population above 100,000 inhabitants, we find only 23%
Vietnamese schools in cities, compared to 41% of high schools located in cities for Dev7
countries.
15
Table 8: School characteristics
Dev7 countries
Variable
PRIVATESCL
Description
Private school
dummy variable
SC02Q02
Funding for school
from student fees
VILLAGE
Vietnam
MS
0.1714
(0.3768)
Valid N
41182
MS
0.0832
(0.2762)
Valid N
4882
25.7233
(36.0117)
34621
16.6104
(26.3564)
4848
School located
in a village
0.1403
(0.3473)
41347
0.4584
(0.4983)
4882
TOWN
School located
in a town
0.4508
(0.4976)
41347
0.3101
(0.4626)
4882
CITY
School located
in a city
0.4089
(0.4916)
41347
0.2315
(0.4218)
4882
CLSIZE
Average class size
35.013
(9.764)
40771
42.5043
(8.7236)
4882
SCHSIZE
Number of enrolled
students at school
1057.0332
(924.2422)
35062
1302.9009
(648.6821)
4882
PCGIRLS
Proportion of
girls at school
0.4900
(0.2597)
36342
0.5282
(0.0801)
4882
Notes: The variables relate to the questionnaires administered to schools. For a more detailed description of variables, please see Tables A2, A3, A4 in the Appendix.The variable
means of Dev7 and Vietnam are statistically different at the 95% significance level. Figures
in parenthesis represent standard deviations.
The average class size in Vietnam is higher, with 43 students compared to 35 students
in Dev7 countries, and the schools in Vietnam are bigger, with average enrollment of 1,303
students compared to 1,057 in Dev7. There is also a slightly higher percentage of girls in
Vietnamese schools.
2.9
School Resources
The comparison of Vietnam and Dev7 regarding school resources may be showing that
Vietnam makes a deeper effective investment in education (Table 9). Schools in Vietnam have
a lower number of computers per student (0.22) compared to a Dev7 (0.39). However, the
ratio of computers connected to the Internet is slightly higher in Vietnam (78% compared to
76%). Indices on quality of school educational resources (SCMATEDU) show Vietnam with
-0.4941 value and Dev7 with -0.8145 value, and similar higher Vietnam level exists for quality
of physical infrastructure at the school (SCMATBUI). There is also a higher proportion of
schools that offer additional math classes. These differences indicate that Vietnam has made
it a priority to invest in Basic Education that compensates to some extent for its income
disadvantage compared to the Dev7. With regard to extra-curricular activities; there is a
mixed picture. Not all extra-curricular activities are shown in Table 9, but some indicate
lower prevalence in Vietnam compared to Dev7 - for instance school band and math club
(not shown, with similar pattern are chess club, IT club, art club). Some activities have
higher prevalence in Vietnam - school play/musical, mathematics competition, and sports
16
(not shown here). It would appear that even for extra-curricular activities, the prevalence of
activities that require greater effort or competition are more prevalent in Vietnam compared
to Dev7.
Table 9: School resources and Management
Dev7 countries
Variable
Description
Vietnam
MS
Valid N
MS
Valid N
Resource quantity and quality
RATCMP15
Available computers
for 15-year-olds
0.3909
(0.5476)
39490
0.2216
(0.3411)
4875
COMPWEB
Ratio of computers
connected to Internet
0.7556
(0.3578)
37446
0.7795
(0.3109)
3634
SCMATEDU
Quality of school
educational resources
-0.8145
(1.1538)
41373
-0.4941
(0.9718)
4882
SCMATBUI
Quality of
physical infrastructure
-0.6322
(1.1113)
41221
-0.3988
(1.0161)
4882
SCL EXTR CL
School offers
additional math classes
0.6538
(0.4757)
40869
0.9584
(0.1997)
4882
EXC1 BAND
School offers
Band, orchestra or choir
0.4710
(0.4992)
40044
0.1678
(0.3737)
4882
EXC2 PLAY
School offers
school play/musical
0.5928
(0.4913)
40122
0.8509
(0.3562)
4882
EXC5 MCLUB
School offers
mathematics club
0.453
(0.4978)
40154
0.2687
(0.4434)
4882
EXC6 MATHCOMP
School offers
Mathematics competition
0.6268
(0.4837)
40215
0.8032
(0.3977)
4882
EXC10 SPORT
School offers
sporting activities
0.9321
(0.2516)
40581
0.992
(0.089)
4882
Extra-curriculars
Leadership accountability and autonomy
SCORE PUBLIC
Achievement data
posted publicly
0.345
(0.4754)
40965
0.7567
(0.4291)
4882
SCORE AUTHRITS
Achievement data
tracked by authority
0.8003
(0.3998)
41139
0.8282
(0.3773)
4778
SCHAUTON
School Autonomy
in admin. decisions
-0.2542
(1.1328)
41394
-1.0419
(0.9378)
4882
TCHPARTI
Teacher participation
in admin. decisions
-0.2169
(1.4457)
41394
-1.6445
(0.5188)
4882
LEADCOM
Communicating and acting
on defined school goals
0.2387
(1.1105)
41252
0.0894
(0.6744)
4882
STUDCLIM
Student-related aspects
of school climate
0.0485
(1.1642)
40973
0.0418
(0.6849)
4874
TEACCLIM
Teacher-related aspects
of school climate
-0.1997
(1.1474)
40973
-0.0873
(0.7125)
4874
Notes: The variables relate to the questionnaires administered to schools. For a more detailed description of variables, please see Tables A2, A3, A4 in the Appendix.The variable means of Dev7 and
Vietnam are statistically different at the 95% significance level, except STUDCLIM. Figures in parenthesis represent standard deviations.
With regard to school leadership and autonomy, there appears to be less autonomy
and more accountability in Vietnam. The index variable SCHAUTON indicates a Dev7
mean value of -0.2542, higher than the Vietnam mean value of -1.0419 (recall that indices
are set to OECD mean of zero). Teachers in Vietnam have lower chances to participate
17
in school management - TCHPARTI indicates a Dev7 mean value of -0.2169 compared to
1.6445 for Vietnam. Principals in Dev7 are more likely to say that they communicate and
act on school goals (LEADCOM), but there is much higher prevalence of public posting of
school achievement data (SCORE PUBLIC) in Vietnam. Interestingly, even Dev7 countries
have high levels of achievement tracking data by authorities (80% of schools report this SCORE AUTHRITS). Finally with regard to the school climate, indices described further
in the PISA documentation, STUDCLIM (student climate) is roughly even between Vietnam and Dev7, but TEACCLIM (teacher climate), that includes variables such as teacher
absenteeism and teacher expectations of students, is higher for Vietnam.
2.10
Preliminary conclusions from comparison of endowments
In summary, the mean comparisons between Vietnam and Dev7 students finds a number
of potentially insightful results. Consider the four-fold classification of factors presented in
the conceptual diagram of Figure 3 - students, parents, teachers and the school, the findings
are summarized below.
Students: Students in Vietnam are more likely to have attended pre-school and less likely
to have repeated grades in the past. They are likely to behave more disciplined at school, skip
fewer classes, and assume greater responsibility for their own learning. Vietnamese students
are less likely to brag about their abilities and experience and yet work harder, especially out
of school, in extra classes. They tend to have lower anxiety about mathematics and higher
confidence about the usefulness of mathematics in their future.
Parents: Parents in Vietnam are likely to be more involved in the school life of their
children than parents of students in Dev7 countries. Though time spent on homework help
is similar in both groups, Vietnamese parents are more likely to volunteer and take part
in fund-raising for the school and help the teachers as classroom assistants. Vietnamese
parents are also more likely to seek to meet the teacher to discuss their child’s progress or
the child’s behavior on their own initiative. Principals in Vietnam report higher levels of
parental pressure.
Teachers: Teachers have similar levels of formal education in both groups, but Vietnamese teachers may have had more recent professional development activities. There are
more specialist mathematics teachers at high schools in Vietnam, and teachers overall are
also more likely to be certified. The performance of teachers is more likely to be monitored
in Vietnam, with higher emphasis on student achievement and on making information about
that achievement public. Teachers also tend to have lower autonomy, more likely to be sub-
18
ject to centralized policies and work in an environment with higher prevalence of incentives
for performance. Principals report fewer problems with regard to teacher absenteeism, which
squares with an explanation about a Confucian heritage culture.
Schools: Vietnam has a much lower level of economic development compared to the
Dev7 countries, which is reflected in lower levels of educational attainment of parents and
lower level of home possessions, including so called cultural possessions such as artwork
and books. Also, comparatively more Vietnamese students go to school in villages and
small towns, reflecting the national population distribution. Yet, two things are striking
about schools - although schools have fewer computers compared to Dev7 countries, these
computers are as likely as Dev7 countries to be connected to the internet. Also, indices
regarding quality of school infrastructure and school educational resources are less deficient
in Vietnam compared to Dev7, which is indicative of substantive investments in schools in
the past few decades.
Overall, across these four domains of information, it seems likely that the PISA data
set is able to detect significant cultural differences between Vietnam and Dev7 countries.
There appears to be some influence of policy, looking at student achievement assessment
and teacher incentives, and higher levels of centralized controls, but the effectiveness of
such policies is also likely tied to cultural factors. Unlike the ‘World Values Survey’ the
set of PISA instruments is not suited to clearly identify cultural differences, for instance
through responses regarding beliefs, attitudes and practices defined specifically to discriminate between cultures. While mean differences provide interesting hints, they are essentially
bi-variate correlations. In order to tell us more about the correlations, which ones are more
important than others, and whether indeed some unobservable ‘Vietnamese culture’ variable
may be a plausible explanation, we need to unravel the mystery further through a study of
multi-variate correlations. We do this first by using the Fryer-Levitt approach.
3
Regression Approach I: Fryer-Levitt
We are now ready to investigate the secret a bit further by deepening our analytical
approach beyond a mere comparison of means. We adopt a simple methodology that is
easy to understand and interpret. Our approach closely follows [Fryer and Levitt, 2004]
who sought to explain the black-white achievement gap in the first two years of schooling
for children in the United States. For the results presented in this section, we pool the
student level data from Vietnam and Dev7 countries. Recall that Dev7 stands for the seven
developing countries in the 2012 PISA dataset with a per capita income below the cut-off
19
of US$10,000. The reason for focusing on developing countries is that we want to have a
common support with regard to a country’s wealth. If a rich country shows outstanding
results, perhaps it may be of interest to other rich countries which do not do as well, but
it is hardly of great interest to a poor country. But if a poor country does very well, and
stands out from the pack of poor countries that mostly do poorly in PISA, readers from
poor countries want to know what can explain such a phenomenon, since it clearly cannot
be attributed to the wealth of the country (as captured albeit imperfectly by per capita
GDP). We start by looking at the Mathematics scores, with the identical approach being
used for the other two PISA disciplines; Reading and Science.
3.1
Mathematics
We estimate a weighted least squares regression of student level test scores as follows:8
TESTSCORE i = V IET N AMi γ + Xi Θ +
i
(1)
A key estimate of interest is γ, the coefficient on V IET N AM , a 0 or 1 dummy variable.
Regressions are run in a sequence, starting from one without any covariates in X, and then
adding variables in groups to expand X in consecutive columns in Table 10. Column (1) in
Table 10 shows that the Vietnam dummy has a coefficient of 128.05, when no other covariates
are added. By construction, this is the absolute difference in means between Vietnam and
the Dev7 countries. Next, we want to see the extent to which observable variables included
in the PISA dataset can help to explain this large gap of 128.05.9 The first set of variables
included in the regression reported in column (2) concern the students themselves. The
student characteristics were - if students went to pre-school, repeated a grade in the past,
and how often they are late for school (ST08Q01) or skipped classes (ST115Q01). With
these variables included, the coefficient on the dummy or “the Vietnamese advantage” or
“gap”, comes down by nearly 20 points, or roughly 0.2 standard deviation units, to 108.91.
In other words, one key reason that the Vietnam gap is so high is because of these student
related variables - this result was hinted at in the endowment comparison presented earlier
in Section 2. Note that of the four student variables used in column (2), only two are
8
This is a simplification, used to present our main idea. In PISA, the test score is not provided as a
single value but as a set of five plausible values for each student, and complex algorithms have to be used
for weighting based on a method called Balanced Repeated Replication (BRR) using Fay’s variant. Details
are provided in the PISA technical manual [OECD, 2014a]. In this paper, we utilize the R intsvy package
for implementation.
9
For explanatory variables not discussed in the previous sections but used for the regressions here, please
see Appendix Table A1 for a comparison of mean values.
20
statistically significant. Figures in parenthesis represent t-values.
As we add variables to expand the group of covariates for Mathematics (Table 10),
Reading (Table 11) and Science (Table 12) we follow a trial and error method, depending
on whether or not, within each group of variables (students, parents, teachers and schools),
the inclusion of the specific variable leads to a reduction in the Vietnam dummy coefficient.
We retain the variable if it leads to a reduction in the Vietnam dummy coefficient, even
if the variable itself may or may not be statistically significant. In this approach, we are
not interested in accurately capturing the size of the coefficients other than the one for
the Vietnam dummy. Neither are we seeking to maximize the explanatory power of the
regression. 10
After considering student related variables, the second set of variables relates to the home
background and parents of students. Mean comparisons showed that PISA indices on family
wealth or parental education are much lower for Vietnam compared to the other seven
countries. Clearly, Vietnam’s higher PISA scores cannot be explained by higher parental
wealth or prental education. Inclusion of these variables would increase the coefficient on
the Vietnam dummy and would take us away from our objective. If Vietnam had enjoyed
the Dev7 levels of those variables, the Vietnam gap would have turned to be larger than
128 points. Hence, the parent variables that are retained and presented in column (3) are
only those variables that reduce the Vietnam dummy. The reduction amounts to only 11
points compared to the nearly 20 point reduction for student variables. Only the variable
PARPRESSURE is statistically significant in this group and indeed has a sizeable impact
on the score. This variable reports on principals claiming that “there is constant pressure
from many parents, who expect our school to set very high academic standards and to have
our students achieve them.”
10
The R code for all statistical analysis undertaken in this research paper is freely available for download
at PAPER
21
Table 10: The estimated impact of ‘Vietnam’ on Mathematics PISA test scores
Mathematics
Variables
VIETNAM
(1)
(2)
(3)
(4)
(5)
128.05
(5.65)
108.91
(5.32)
97.46
(5.48)
95.13
(5.87)
77.26
(7.84)
PRESCHOOL
-
-
45.86
(3.92)
40.54
(3.95)
39.21
(4.09)
24.90
(3.80)
REPEAT
-
-
-50.57
(2.59)
-47.55
(2.56)
-45.05
(3.19)
-36.96
(3.00)
ST08Q01
-
-
-8.59
(1.20)
-8.41
(1.18)
-8.38
(1.33)
-7.84
(1.32)
ST115Q01
-
-
-4.94
(1.70)
-4.57
(1.73)
-6.10
(1.80)
-5.40
(1.86)
BOOK N
-
-
-
-
0.09
(0.01)
0.08
(0.01)
0.07
(0.01)
PARPRESSURE
-
-
-
-
10.73
(5.01)
12.51
(4.78)
10.02
(4.40)
FUNDMOM
-
-
-
-
0.27
(0.06)
0.24
(0.06)
0.19
(0.07)
COUNCILMOM
-
-
-
-
-0.14
(0.06)
-0.18
(0.06)
-0.10
(0.07)
DUTYMOM
-
-
-
-
-0.07
(0.06)
-0.12
(0.07)
-0.10
(0.07)
PROPCERT
-
-
-
-
-
16.08
(5.50)
16.32
(6.87)
SMRATIO
-
-
-
-
-
-
-0.01
(0.01)
-0.03
(0.01)
TCSHORT
-
-
-
-
-
-
-1.91
(1.97)
2.24
(1.87)
TCFOCST
-
-
-
-
-
-
0.30
(2.19)
-1.45
(1.88)
TCM STUASS
-
-
-
-
-
-
10.85
(7.45)
-0.18
(7.85)
TCM PEER
-
-
-
-
-
-
-1.53
(6.59)
-5.61
(5.65)
TCH INCENTV
-
-
-
-
-
-
-0.92
(2.73)
ASS PROG
-
-
-
-
-
-
-0.51
(15.51)
-
-2.75
(2.72)
-22.58
(8.04)
ASS PROM
-
-
-
-
-
-
7.60
(6.11)
14.09
(5.80)
ASS SCH
-
-
-
-
-
-
5.51
(6.51)
0.51
(7.31)
3.66
(5.27)
2.20
(5.07)
STU FEEDB
-
-
-
-
-
-
PCGIRLS
-
-
-
-
-
-
-
-
14.59
(13.65)
COMP USE
-
-
-
-
-
-
-
-
-1.57
(5.30)
TXT BOOK
-
-
-
-
-
-
-
-
-9.51
(7.05)
TOWN
-
-
-
-
-
-
-
-
-9.53
(3.76)
CLSIZE
-
-
-
-
-
-
-
-
0.81
(0.23)
COMPWEB
-
-
-
-
-
-
-
-
15.28
(6.31)
SCMATEDU
-
-
-
-
-
-
-
-
5.58
(2.94)
SCMATBUI
-
-
-
-
-
-
-
-
3.46
(2.45)
EXC2 PLAY
-
-
-
-
-
-
-
-
8.69
(3.96)
EXC6 MATHCOMP
-
-
-
-
-
-
-
-
-1.70
(5.37)
EXC10 SPORT
-
-
-
-
-
-
-
-
-5.65
(9.15)
EXC11 UNICORN
-
-
-
-
-
-
-
-
6.81
(5.59)
SCL EXTR CL
-
-
-
-
-
-
-
-
10.90
(5.08)
SCORE PUBLIC
-
-
-
-
-
-
-
-
10.10
(4.75)
QUAL RECORD
-
-
-
-
-
-
-
-
6.99
(6.77)
SCHSEL
-
-
-
-
-
-
-
-
1.57
(3.29)
R2
27.21
37.24
40.03
43.15
43.93
N
48483
46267
44046
30051
25612
Notes: Figures in parentheses are t-values (95% significance level). For a more detailed description of variables,
please see Tables A2, A3, A4 in the Appendix.
The third set of variables, related to teachers is presented in column (4) and results in a
reduction of the Vietnam dummy by only 3 points to a level of 95.13. This does not mean that
teachers are unimportant as a reason for Vietnam’s superior performance in mathematics,
only that the observed teacher related variables in the PISA dataset do not collectively help
as an explanation. In the regression itself, one can see that PROPCERT, proportion of
certified teachers affects mathematics scores positively. The same goes for a few of student
assessment related variables, including TCM STUASS and STU FEEDB, that relate to the
use of student assessment and student written feedback to assess teachers.
22
The final set of variables, related to schools is presented in column (5), that results in
a further reduction of the dummy coefficient by 12 points, to a level of 77.26. There are
interesting insights from some of these school variables. COMP USE does not have a positive
effect on the mathematics score, but COMPWEB does - recall that Vietnam does relatively
better on internet connectivity compared to mere availability of computers. The presence
of SCMATEDU and SCMATBUI, quality of school educational resources and quality of
physical infrastructure, helps explain the gap, recall from Table 9 that Vietnam has superior
endowments compared to the Dev7 countries. Table 10 shows that extra classes organized
by the school (SCL EXTR CL) and the “systematic recording of data including teacher
and student attendance and graduation rates, test results and professional development of
teachers” (QUAL RECORD) are also part of the story of explaining the Vietnam test score
gap. Public dissemination by the school of test results (SCORE PUBLIC) has a positive
coefficient, which is also one of the variables where Vietnam appears to have twice as many
schools following this practice.
As we successively add variables in the regression equation, the number of observations in
the regressions drops significantly due to missing values in the data set. Comparing available
observable values to other variables for the dropped observations does not seem to indicate
a systematic bias in this attrition. The 2012 PISA round included a so called ‘rotated’
module for the student’s questionnaire. The idea of the rotated module was to ask three
additional sets of questions in a systematic division that increases the overall data available
without burdening the respondents with excessively long questionnaires. The main caveat
of the ‘rotated’ design is that these additional three sets of questions/variables only cover
two-thirds of students each, and any combination of two sets would only cover one-third
of students. Regressing on variables of the rotated modules, thus significantly reduces the
sample size. The regression tables with rotated variables included can be downloaded from
the github site for this paper. The lowest possible value for the Vietnam dummy in the
Mathematics regression was 49.59, adding gap-decreasing variables from the second rotated
module (appendix table A5 online). This relates to a 61% reduction of the Vietnam ‘gap’.
The rest of the gap is explained due to effects not measured by PISA.
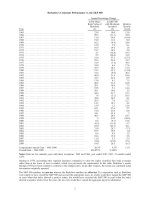
23