Advanced mathematics pre calculus
Bạn đang xem bản rút gọn của tài liệu. Xem và tải ngay bản đầy đủ của tài liệu tại đây (3.47 MB, 272 trang )
Unit 1, Pre-test Functions
Advanced
Mathematics
Pre-Calculus
Blackline Masters, Advanced Math – Pre-Calculus
Louisiana Comprehensive Curriculum, Revised 2008
Page 1
®
Most of the math symbols in this document were made with Math Type
software. Specific fonts must be installed on the user’s computer for the
symbols to be read. It is best to use the pdf format of a document if a printed
copy is needed.
To copy and paste from the Word document, download and install the Math
®
Type for Windows Font from />on each computer on which the document will be used.
Unit 1, Pre-test Functions
Pre-test Functions
Name_________________________________
1. Given f(x) = x2 – x
a)
Find f(3)
_________
b) Find f(x + 1)___ ________________
2. Find the domain and range for each of the following:
a) f(x) =
x
b) g(x) = x – 3
c) h(x) =
1
x
___________________
Domain
________________
Range
________________
Domain
_________________
Range
________________
_______________
Domain
Range
3. Write a linear equation in standard form if
a) the slope of the line is – ½ and the line passes through (4, -2)
______________________
Blackline Masters, Advanced Math – Pre-Calculus
Louisiana Comprehensive Curriculum, Revised 2008
Page 1
Unit 1, Pre-test Functions
b) the line passes through the points (5, 4) and (6, 3).
____________________
3
x−4
a) Find f(x) + g(x). Write your answer in simplest form.
4. Given f(x) = 2x – 5 and g(x) =
________________________
b) Find f ( x ) ÷ g ( x )
________________________
5. Given f(x) = x + 3 find f-1(x)
________________________
Blackline Masters, Advanced Math – Pre-Calculus
Louisiana Comprehensive Curriculum, Revised 2008
Page 2
Unit 1, Pre-test Functions
6. Find the zeroes of each of the following functions:
a) f ( x ) = x 2 − x − 2
_________________
b) f ( x ) =
7. Solve:
x−3
3x 3 7 x
+ =
5 2 10
_________________
________________________
8. Solve x − 2 ≤ 3 Write your answer in interval notation.
Blackline Masters, Advanced Math – Pre-Calculus
Louisiana Comprehensive Curriculum, Revised 2008
_________________
Page 3
Unit 1, Pre-test Functions
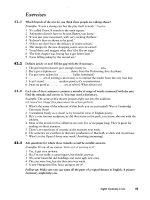
9. Given the graph of y = f(x) below. Over what interval/s is the graph
increasing?___________________________ decreasing?________________________
10. Given the graph of y = f(x) below. Using the same coordinate system sketch
y = f(x – 1) + 2
Blackline Masters, Advanced Math – Pre-Calculus
Louisiana Comprehensive Curriculum, Revised 2008
Page 4
Unit 1, Pre-test Functions with Answers
Name_____Key_____________
1. Given f(x) = x2 – x
a)
find f(3)
b) find f(x + 1)___x2+x________________
___6_______
2. Find the domain and range for each of the following:
a) f(x) =
x
b) g(x) = x – 3
c) h(x) =
1
x
____{x:x≥0}____
Domain
___D:_all reals_______
Domain
__{x: x ≠ 0}_______
Domain
_{y: y ≥ 0}_____
Range
R: all reals__
Range
__{y: y ≠ 0 }______
Range
3. Write a linear equation in standard form if
a) the slope of the line is – ½ and the line passes through (4, -2)
x + 2y = 0
b) the line passes through the points (5, 4) and (6, 3).
x+y=9
3
x−4
a) Find f(x) + g(x). Write your answer in simplest form.
4. Given f(x) = 2x – 5 and g(x) =
2 x 2 − 13x + 23
x−4
b) Find f ( x ) ÷ g ( x )
2 x 2 − 13x + 20
3
Blackline Masters, Advanced Math – Pre-Calculus
Louisiana Comprehensive Curriculum, Revised 2008
Page 5
Unit 1, Pre-test Functions with Answers
5. Given f(x) = x + 3 find f-1(x)
f-1(x) = x – 3
6. Find the zeroes of each of the following functions:
a) f ( x ) = x 2 − x − 2
_{2, -1}_______
b) f ( x ) =
_{3}_________
7. Solve:
x−3
3x 3 7 x
+ =
5 2 10
___{15}_____
8. Solve x − 2 ≤ 3 Write your answer in interval notation.
____[-1, 5]___
9. Given the graph of y = f(x) below. Over what interval/s is the graph
b g
increasing? ( −∞,−3) and 0, ∞
decreasing? __(-3, 0)______
10. Given the graph of y = f(x) below. Using the same coordinate system sketch
y = f(x – 1) + 2
Blackline Masters, Advanced Math – Pre-Calculus
Louisiana Comprehensive Curriculum, Revised 2008
Page 6
Unit 1, What Do You Know about Functions?
Word
function
+ ? -
What do I know about this topic?
domain
range
independent variable
dependent variable
open intervals
closed intervals
function notation
vertical line test
implied domain
increasing intervals
Blackline Masters, Advanced Math – Pre-Calculus
Louisiana Comprehensive Curriculum, Revised 2008
Page 7
Unit 1, What Do You Know about Functions?
decreasing intervals
relative maximum
relative minimum
local extrema
even function
odd function
translations
zeros
reflections
dilations
one-to-one
Blackline Masters, Advanced Math – Pre-Calculus
Louisiana Comprehensive Curriculum, Revised 2008
Page 8
Unit 1, What Do You Know about Functions?
composition
inverse function
horizontal line test
piecewise defined
function
continuous function
function with
discontinuities
Blackline Masters, Advanced Math – Pre-Calculus
Louisiana Comprehensive Curriculum, Revised 2008
Page 9
Unit 1, Activity 1, Finding Functions in Situations
Name_______________________________
Date_______________________________
In each of the following identify the independent variable, the dependent variable, and
sketch a possible graph of each.
1. The distance required to stop a car depends on how fast it is going when the
brakes are applied.
2. The height of a punted football and the number of seconds since it was kicked.
3. The volume of a sphere is a function of its radius.
4. The amount of daylight in Shreveport depends on the time of year.
5. If you blow up a balloon, its diameter and the number of breaths blown into it are
related.
Blackline Masters, Advanced Math – Pre-Calculus
Louisiana Comprehensive Curriculum, Revised 2008
Page 10
Unit 1, Activity 1, Finding Functions in Situations with Answers
1. The distance required to stop a car depends on how fast it is going when the brakes are
applied.
independent variable is speed; dependent variable is distance
s2
There is a formula d =
+ s where s > 0. Students should realize that the graph
20
will be found in the first quadrant and should be a curve that is concave up since it
takes more distance to sto, the faster one is going. More information can be found at
/>2.The height of a punted football and the number of seconds since it was kicked.
The independent variable is time in seconds and the dependent variable is height in
feet. The graph should be a parabola opening down and found in the first quadrant.
3. The volume of a sphere is a function of its radius.
The independent variable is the radius r and the dependent variable is the volume
V. This again is a curve (cubic polynomial) found in the first quadrant only,
4
corresponding to the formula V = πr 3 , r > 0.
3
4. The amount of daylight in Shreveport depends on the time of year.
The independent variable is time and the dependent variable is the number of hours
of daylight. This is a periodic function and will be studied in Unit 5. Students could
use the following points to sketch a graph:
For the northern hemisphere• vernal equinox in March has 12 hours of daylight and 12 hours of dark
• summer solstice in June has the largest amount of daylight; the amount
depends on the latitude
• autumnal equinox in September has 12 hours of daylight and 12 hours of dark
• winter solstice in December has the smallest amount of daylight; the amount
depends on the latitude
5. If you blow up a balloon, its diameter and the number of breaths blown into it are
related.
The independent variable is the number of breaths and the dependent variable is the
diameter of the balloon. The graph should be linear. This makes an excellent activity.
Let the students collect data by giving each group a balloon, having one person blow into
the balloon and measuring the diameter after every 4 to 5 blows.
Blackline Masters, Advanced Math – Pre-Calculus
Louisiana Comprehensive Curriculum, Revised 2008
Page 11
Unit 1, Activity 1, Solving Problems Using Mathematical Modeling
Directions: Use the procedure below to solve the following problems.
1.
2.
3.
4.
5.
6.
7.
8.
9.
Procedure for Developing a Mathematical Model
Set up a table using data that appear to be related.
Set up a coordinate system, label axes, and choose appropriate scales.
Plot data points as ordered pairs on the coordinate system.
Sketch a curve that passes through the points.
Describe the functional relationship (or an approximation of it) with a symbolic
formula.
Use the curve and the equation to predict other outcomes.
Consider the reasonableness of your results.
Consider any limitations of the model.
Consider the appropriateness of the scales.
Problems:
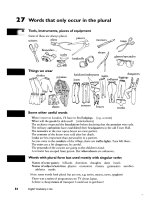
1. Stairs are designed according to the following principle:
The normal pace length is 60 cm. This must be decreased
by 2 cm for every 1 cm that a person’s foot is raised when
climbing stairs. According to this design, how should the
“tread length” (see diagram) depend upon the height of
each “riser”?
a) Set up a table to show the relationship.
b) Graph the points.
c) What equation models this relationship?
2. Amy needs to buy a new gas water heater and has narrowed her choice down to two
different models. One model has a purchase price of $278.00 and will cost $17.00
per month to operate. The initial cost of the second model is $413.00, but because of
the higher energy factor rating, it will cost an average of $11.00 a month to operate.
a. Set up a table to compare the two heaters.
b. Write an equation for each of the two models.
c. Construct a graph for each using the same coordinate system.
d. Explain which model would be a better buy.
3. A craftsman making decorative bird houses has invested $350.00 in materials. He
plans to sell his houses at craft and garden shows for $14.99.
a. Set up a model, draw a graph, and determine an equation to calculate his profit.
b. Use the graph to estimate how many bird houses he would have to sell to break
even.
c. Use the equation to determine how many bird houses he would have to sell to
break even.
d. How many birdhouses would he have to sell in order to make a profit of
$250.00?
4. Suppose a dump truck, purchased new for $150,000 by the ABC construction
company, has an expected useful life of 10 years and has an expected salvage value of
Blackline Masters, Advanced Math – Pre-Calculus
Louisiana Comprehensive Curriculum, Revised 2008
Page 12
Unit 1, Activity 1, Solving Problems Using Mathematical Modeling
$30,000 at the end of that time. IRS allows the loss in value of the truck as a deductible
expense of doing business. Although there are a number of methods for determining the
annual amount of depreciation, the simplest is the straight-line method. Using this
model, the company assumes that the value V, at any time, t, can be represented by a
straight line that contains the two ordered pairs, (0, 150,000) and (10, 30,000).
a. Describe how to interpret the two ordered pairs.
b. Determine the equation of the line that passes through the two ordered pairs
and draw the graph.
c. Interpret the slope within the context of the problem. What does the y-intercept
stand for?
d. What are the domain and range of the linear function in (b)? How does this
differ from the domain and range within context of problem?
5. Writing exercise: In problem #3 you obtained the equation of a line to model the
profit from selling bird houses. What is the difference between the domain of the
linear function obtained and the domain within the context of the problem?
Blackline Masters, Advanced Math – Pre-Calculus
Louisiana Comprehensive Curriculum, Revised 2008
Page 13
Unit 1, Activity 1, Solving Problems Using Mathematical Modeling with
Answers
1. Stairs are designed according to the following principle:
The normal pace length is 60 cm. This must be decreased by 2 cm for every 1 cm
that a person’s foot is raised when climbing stairs. According to this design, how
should the “tread length” (see diagram) depend upon the height of each “riser”?
Students should recognize that the table shows a constant rate of change so the equation
will be linear in nature. A carefully constructed graph will show a linear set of points.
Riser
(R)
0
1
2
3
Tread
(T)
60
58
56
54
equation: T = -2R + 60
2. Amy needs to buy a new gas water heater and has narrowed her choice down to two
different models. One model has a purchase price of $278.00 and will cost $17.00
per month to operate. The initial cost of the second model is $413.00 but because of
the higher energy factor rating, it will cost an average of $11.00 a month to operate.
a. Set up a table to compare the two heaters.
Month
0
1
2
3
Heater 1
$278.
$295.
$312.
$329.
Heater 2
$413.
$424.
$435.
$446.
b ) Use the table to write equations for the two models.
Heater 1has the equation c = 17m + 278 and Heater 2 has the equation
c = 11m + 413, where c is the cost per month and m is the number of months
c. Graph the equations. What do you see?
)
Blackline Masters, Advanced Math – Pre-Calculus
Louisiana Comprehensive Curriculum, Revised 2008
Page 14
Unit 1, Activity 1, Solving Problems Using Mathematical Modeling with
Answers
d. Explain which model would be a better buy.
A graph of the two lines on the same coordinate system show that by the 23rd month
heater 1 becomes the more expensive buy. Since water heaters last for quite a few years,
the second heater with its higher energy efficiency is the better buy.
3
A craftsman making decorative bird houses has invested $350.00 in materials. He
plans to sell his houses at craft and garden shows for $14.99.
a. Set up a model, determine the equation, and draw a graph that can be used to
calculate his profit.
The model needed is Profit = Revenue – Cost
P = 14.99n – 350
b. Graph that equation and use it to estimate how many bird houses he would have
to sell to break even.
On the graph the break even point is the x-intercept ≈ 24 bird houses. The graph
is really a series of points with the domain the whole numbers.
c. Use the equation to determine how many bird houses he would have to sell to
break even.
Setting the equation = to 0 and rounding up gives 24 bird houses.
d. How many birdhouses would he have to sell in order to make a profit of
$250.00?
He would have to sell 41 bird houses to make a profit of $250.00
4. Suppose a dump truck, purchased new for $150,000 by the ABC construction
company, has an expected useful life of 10 years and has an expected salvage value of
$30,000 at the end of that time. IRS allows the loss in value of the truck as a
deductible expense of doing business. Although there are a number of methods for
determining the annual amount of depreciation, the simplest is the straight-line
method. Using this model, the company assumes that the value V, at any time, t, can
be represented by a straight line that contains the two ordered pairs, (0, 150,000) and
(10, 30,000).
a. Describe how to interpret the two ordered pairs.
(0, 150,000) represents the initial cost of the dump truck and (10, 30,000)
represents what the truck is worth at the end of 10 years
b. Determine the equation of the line that passes through the two ordered pairs
and draw the graph.
V = -12,000n + 150,000, where V is the value of the truck at n years
Blackline Masters, Advanced Math – Pre-Calculus
Louisiana Comprehensive Curriculum, Revised 2008
Page 15
Unit 1, Activity 1, Solving Problems Using Mathematical Modeling with
Answers
c. Interpret the slope within the context of the problem.
$12,000 is depreciation per year
d. What does the y-intercept stand for?
The y-intercept is the initial cost of the truck.
e. What are the domain and range of the linear function in (b)? How does this
differ from the domain and range within context of problem?
The domain and range of any linear function is the set of reals. In this case the
domain is a set of whole numbers 0 ≤ n ≤ 10 and the range
30,000 ≤ c ≤ 150,000.
5. Writing exercise: In problem #3 you obtained the equation of a line to model the
profit from selling bird houses. What is the difference between the domain of the
linear function obtained and the domain within the context of the problem?
The domain of a linear function is the set of real numbers. However, within the
context of this problem, the domain is a subset of whole numbers with the largest
value of n depending on the number of bird houses that can be built from the $350.00
worth of materials.
Blackline Masters, Advanced Math – Pre-Calculus
Louisiana Comprehensive Curriculum, Revised 2008
Page 16
Unit 1, Activity 2, Functions and their Graphs
Name_____________________________
Date______________________________
1. Find the domain and range of each of the following functions. Support your answer
with a graphing utility. Show a sketch of the graph beside each answer.
a. f ( x ) = 2 + x − 1
b. g ( x ) = x − 3 − 4
c. h( x ) = x 2 − 4
d. f ( x ) =
2
x−3
2. Find the domain and range of each of the graphs below.
b.
a
Domain:__________________
Domain:_______________________
Range: __________________
Range: _______________________
Blackline Masters, Advanced Math – Pre-Calculus
Louisiana Comprehensive Curriculum, Revised 2008
Page 17
Unit 1, Activity 2, Functions and their Graphs
3. Using graph paper complete the graph below so that
a) the finished graph represents an even function and
b) the finished graph represents an odd function.
4. Below is the graph of y = f(x)
a) What is the domain of f(x)?
b) What is the range?
c) On which intervals is f(x) increasing?
d) On which intervals is f(x) decreasing?
e) On which intervals is f(x) negative?
Blackline Masters, Advanced Math – Pre-Calculus
Louisiana Comprehensive Curriculum, Revised 2008
Page 18
Unit 1, Activity 2, Functions and their Graphs
f) On which intervals is f(x) positive?
g) Describe the end-behavior of f(x).
5.The sketch below shows part of the graph of y = f(x) which passes through the points
A(-1,3), B(0, 2), C(1,0), D(2, 1), and E(3, 5).
a) On which intervals is f(x) increasing?
b) On which intervals is f(x) decreasing?
c) What are the zeros?
d) Identify the location of the relative
maximum. What is its value?
e) Identify the location of the relative
minimum. What is its value?
f) A second function is defined by
g(x) = f(x – 1) + 2.
i) Calculate g(0), and g(3).
ii) On the same set of axes sketch a graph of the function g(x).
6. Writing activity: Compare the domain and ranges of the functions defined by
y = x 2 and y =
d x i . Explain any differences you might see
2
Blackline Masters, Advanced Math – Pre-Calculus
Louisiana Comprehensive Curriculum, Revised 2008
Page 19
Unit 1, Activity 2, Functions and their Graphs with Answers
1. Find the domain and range of each of the following functions. Support your answer
with a graphing utility. Show a sketch of the graph beside each answer.
b. g ( x ) = x − 3 − 4
a. f ( x ) = 2 + x − 1
a) domain {x: x ≥ 1} range {y: y≥ 2}
The endpoint is (1,2)
b) domain {x : x ≥ 3} range {y : y ≥ -4}
The endpoint is (3, -4)
2
x−3
c) domain {x: x ≤ -2 or x ≥ 2} range {y: y ≥ 0} d) domain {x : all reals except 3}
range {y: all reals except 0}
c. h( x ) = x 2 − 4
d. f ( x ) =
2. Find the domain and range of each of the graphs below.
a
b.
2. a) domain {x: -3 ≤ x ≤ 3} and range {y: -1 ≤ y ≤ 1, y = 2}
b) domain {x: reals except 2}and range {y: y > 1}
Blackline Masters, Advanced Math – Pre-Calculus
Louisiana Comprehensive Curriculum, Revised 2008
Page 20
Unit 1, Activity 2, Functions and their Graphs with Answers
3. Using graph paper complete the graph below so that
a) the finished graph represents an even function and
b) the finished graph represents an odd function
3. a) For an even function reflect the
graph over the y-axis.
b) For an odd function reflect the
graph around the origin
4. To the right is the graph of y = f(x)
4.
a)What is the domain of f (x)?
domain {x: x reals except -2}
b) What is the range?
{y: y < -5 or y ≥ 0}
c) On which intervals is f (x) increasing?
increasing for x < -2 or x > 0
d) On which intervals is f (x) decreasing?
decreasing for -2 < x ≤ 0
e) On which intervals is f (x) negative?
Negative for x > 0
f) On which intervals is f (x) positive?
Positive for x < 0
g) Describe the end-behavior of f (x).
When x → −∞ f(x) → 2 and when x → ∞ f ( x ) → −5
Blackline Masters, Advanced Math – Pre-Calculus
Louisiana Comprehensive Curriculum, Revised 2008
Page 21
Unit 1, Activity 2, Functions and their Graphs with Answers
5. The sketch below shows part of the graph of y = f(x) which passes through the points
A(-1,3), B(0, 2), C(1,0), D(2, 1), and E(3, 5).
a) On which intervals is f (x) increasing?
increasing -3 < x < -1 and 1 < x < 3
b) On which intervals is f (x) decreasing?
decreasing -1 < x < 1
c) What are the zeros?
f(-3) = 0 and f(1) = 0
d) Identify the location of the relative
maximum. What is its value?
Relative maximum is located at x = -1. Its
value is 3.
e) Identify the location of the relative
minimum. What is its value?
The relative minimum is located at x = 1. Its value is 0.
f) A second function is defined by
g(x) = f(x – 1) + 2.
i) Calculate g(0), and g(3).
g(0) = 5 and g(3) = 3
ii) On the same set of axes sketch a graph of the function g(x).
(ii) The new graph should pass through the points (0, 5), (1, 4), (2, 2) (3, 3) and
(4, 7) as shown below.
Blackline Masters, Advanced Math – Pre-Calculus
Louisiana Comprehensive Curriculum, Revised 2008
Page 22
Unit 1, Activity 2, Functions and their Graphs with Answers
6.
Writing activity: Compare the domain and ranges of the functions defined by
y = x 2 and y =
d x i . Explain any difference you might see.
2
Students should graph both y1 and y2 using their graphing calculators. Both have the
same range but the domain of y1 is the set of reals and the domain of y2 is {x: x ≥ 0}. In
y1 the input is squared before the square root is taken so the number is always positive.
In y2 the square root is taken before the result is squared. This problem can also be used
with composition of functions.
y1 =
x2
Blackline Masters, Advanced Math – Pre-Calculus
Louisiana Comprehensive Curriculum, Revised 2008
y2 =
d xi
2
Page 23