Private Tutoring in Vietnam A Review of Current Issues and Its Major Correlates
Bạn đang xem bản rút gọn của tài liệu. Xem và tải ngay bản đầy đủ của tài liệu tại đây (511.31 KB, 40 trang )
Public Disclosure Authorized
Public Disclosure Authorized
WPS6618
Policy Research Working Paper
Private Tutoring in Vietnam
A Review of Current Issues and Its Major Correlates
Public Disclosure Authorized
Hai-Anh H. Dang
Public Disclosure Authorized
6618
The World Bank
Development Research Group
Poverty and Inequality Team
September 2013
Policy Research Working Paper 6618
Abstract
Building on the earlier work, this paper provides an
updated review of the private tutoring phenomenon
in Vietnam in several aspects, including the reasons,
scale, intensity, form, cost, and legality of these classes.
In particular, the paper offers a comparative analysis of
the trends in private tutoring between 1998 and 2006
where data are available. Several (micro-) correlates are
examined that are found to be strongly correlated with
student attendance at tutoring, including household
income, household head education and residence area,
student current grade level, ethnicity, and household
size. In particular, the analysis focuses on the last three
variables, which have received little attention in the
previous literature on the determinants of tutoring.
This paper is a product of the Poverty and Inequality Team, Development Research Group. It is part of a larger effort by
the World Bank to provide open access to its research and make a contribution to development policy discussions around
the world. Policy Research Working Papers are also posted on the Web at . The author may be
contacted at
The Policy Research Working Paper Series disseminates the findings of work in progress to encourage the exchange of ideas about development
issues. An objective of the series is to get the findings out quickly, even if the presentations are less than fully polished. The papers carry the
names of the authors and should be cited accordingly. The findings, interpretations, and conclusions expressed in this paper are entirely those
of the authors. They do not necessarily represent the views of the International Bank for Reconstruction and Development/World Bank and
its affiliated organizations, or those of the Executive Directors of the World Bank or the governments they represent.
Produced by the Research Support Team
Private Tutoring in Vietnam: A Review of Current Issues and Its Major Correlates
Hai-Anh H. Dang *
World Bank
JEL: I2, O1
Keywords: private tutoring, supplementary education, ethnicity, household size, Vietnam
Sector Board: POV
*
Dang () is Economist with the Poverty and Inequality Unit, Development Research Group,
World Bank. I would like to thank Janice Aurini, Kim Goyette, and Peter Lanjouw for helpful comments on earlier
drafts of this paper, which is a forthcoming book chapter in Janice Aurini, Julian Dierkes and Scott Davis. (Eds.)
"Out of the Shadows: The Global Intensification of Supplementary Education." Emerald Press. All errors are mine.
The findings and interpretations in this paper do not necessarily reflect the views of the World Bank, its affiliated
institutions, or its Executive Directors.
Introduction
Starting with the “doi moi” (renovation) process in 1986, Vietnam’s economy has made
impressive progress in recent years. Between 1986 and 2011, the average annual growth rate per
capita for Vietnam was 5.4 percent (World Bank, 2013); and poverty rates have been steadily
falling from 58 percent in 1993 to 37 percent in 1998, and 15 percent in 2008 1 (World Bank,
2003 and 2012). Together with recent economic growth, the total number of schools in the
country rose from around 21,000 in the 1995-1996 school year to around 28,593 in the 20102011 school year, amounting to a growth rate of 36 percent (GSO, 2003 and 2012). The
education system has also undergone major institutional changes, with new laws and regulations
being issued.
One recent and growing feature of the Vietnamese education system is the “shadow”
education system. Shadow education exists alongside the mainstream education system, and
includes providing students with extra classes (“di hoc them”) to acquire the knowledge that they
do not appear to obtain during their hours at school. These extra classes or private tutoring
sessions have become widespread throughout Vietnam and account for a considerable share of
the amount of household budgets spent on education. To be consistent with the terminology, in
this paper I will mostly use the term “supplementary education” in addition to the term “private
tutoring” to refer to these extra classes; however, note that in the context of Vietnam (or in my
other studies on this topic) these two terms are interchangeable. 2
There has been much public debate about supplementary education in Vietnam. 3 While some
policymakers and parents think that supplementary education negatively affects students, in
terms of their academic performance and their childhood, others believe that supplementary
1
A household is considered to be poor if they cannot afford a consumption basket consisting of food and non-food
items, where the food can secure 2100 calories per person per day (World Bank, 2003).
2
Private tutoring is defined in this paper as any private lesson purchased by households to provide supplementary
instruction to children in subjects that they study in the mainstream education system, which is also the definition
used by many other researchers. While this definition is straightforward and functional, it has much room for
improvement. Dang (2013) argues that defining private tutoring in different ways can lead to potentially vastly
different policy implications.
3
Supplementary education exists not only in Vietnam but can be found in countries as diverse economically and
geographically as Cambodia, the Arab Republic of Egypt, Japan, Kenya, Morocco, Romania, Singapore, the United
States, and the United Kingdom (Bray, 1999, 2009, 2012). In a recent survey of the prevalence of tutoring in 22
developed and developing countries, Dang and Rogers (2008) find that in most of these countries, 25–90 percent of
students at various levels of education are receiving or recently received supplementary education. In some
countries, such as the Republic of Korea and Turkey, spending by households on supplementary education even
rivals public sector education expenditures. Dang and Rogers also find ample evidence suggesting that
supplementary education can enhance student academic performance in various ways in a number of countries,
including Vietnam
2
education can improve the quality of education.
4
Therefore, while some argue that
supplementary education should be banned altogether, others think that supplementary education
should be encouraged, at least to some extent. The debates on supplementary education have
been ongoing and heated, and they have been heard not just in the media, including newspapers
and television, but also during the Minister of Education’s presentations to the National
Assembly. 5
The contribution of this paper is twofold. First, building on my earlier work (Dang, 2007 and
2008), this paper provides an updated review of the major current issues on tutoring facing
policy makers in Vietnam. In particular, this paper offers a comparative analysis of the trends in
supplementary education between 1998 and 2006 wherever data are available. Second, this paper
examines several (micro-) correlates that are found to be strongly correlated with student
attendance at tutoring but have received little attention in the literature. These correlates include
the current grade attended by students, student ethnicity, and household size and composition.
As discussed later, this paper is limited to investigating the correlational, rather than causal,
relationship between individual and household characteristics and student attendance at tutoring.
In most cases, it is not easy to correctly identify a causal relationship, partly because of the lack
of reliable instruments in available data. Still, while such instruments are yet to be found, it is
arguably useful to examine this correlational relationship for two main reasons: first, we should
aim to push the limits of what we know about the determinants of tutoring attendance, and
second, taken with the appropriate caution, this correlational relationship can also offer some
useful guidelines to policy makers.
The paper begins by briefly reviewing the education system in Vietnam, both past and
present, and in Section 2, I discuss its connection to supplementary education. Section 3
describes the data. Section 4 investigates the different aspects of supplementary education in
4
These measures of student academic performance include student test scores in India (Banerjee et al., 2007), mean
pass rates on the baccalaureate exams in Israel (Lavy and Schlosser, 2005), the quality of universities students attend
in Japan (Ono, 2007), mathematics test scores in Taiwan, China (Kuan, 2011), Scholastic Aptitude Test (SAT) and
ACT test scores and academic performance in the United States (Becker, 1990; Briggs, 2001; Jacob and Lefgren,
2004; Powers and Rock, 1999), and student grade point averages (GPA) ranking in Vietnam (Dang, 2007, 2008).
However, Zhang (2013) finds mixed impacts for students in the province of Jinan, China. See also Dang and Rogers
(2008) for a discussion of other studies that do not find statistically significant impacts of private tutoring on student
performance, and Dang (2008) for a discussion of other undesirable effects of tutoring.
5
It is our observation that supplementary education has become such an integrated part of the education system in
Vietnam that local newspapers regularly print stories on various aspects of supplementary education to attract a
larger readership.
3
Vietnam, further quantitative analysis of supplementary education is provided in Section 5, and
Section 6 concludes.
Vietnam’s Education Structure and Private Tutoring
This section discusses both the historical and modern factors underlying the growth of
supplementary education in Vietnam, with the former including cultural influence and rigidity of
the tertiary sector, and the latter the imbalance between demand and supply in education, most
noticeably at higher education levels.
A Brief Sketch of History
While Vietnam’s education system has been exposed to diverse cultural influences, 6 there are
still some common threads that can shed light on the supplementary education sector. First, in
the distant past, for almost one millennium under the Chinese occupation and almost one
hundred years under the French occupation, the education system had been mostly an elitist
system where only a privileged minority was given the opportunity to access education. 7 Once in
the education system, advancement was determined by high-stakes exams, where a student’s
success or failure depended on their examination performance. This cultural heritage seems to
have clearly left its mark on today’s current attitudes and aspirations towards good performance
on examinations in Vietnam.
Second, the education system was modeled after the ‘inflexible system’ created by the former
Soviet Union. Until very recently, for example, only a few universities were multi-disciplinary,
while the majority was devoted to a single discipline (Tran et al., 1995). Once admitted to a
university, it was not easy for students to transfer to another school or even to change majors
within the same school. Thus, practically speaking, students had limited choice. In combination,
the culture of high stakes exams and rigidity of the tertiary system has contributed to the
popularly of supplementary education lessons; they are seen as a way to enhance students’ scores
on university entrance examinations and improve their chances of getting into their preferred
schools and programs.
6
See Dang (2008) for more details on different periods of these cultural influences.
For example, under the French rule, only 3% of the population enjoyed access to schooling. The major purpose of
the education system was to train foremen, secretaries and low-level officials for the French colonist regime (Pham,
1998). With such a small part of the population educated, it is understandable that in this period, more education was
strongly associated with better economic opportunities and social status.
7
4
Current Structure and Policy Context
The current education system in Vietnam has three levels: primary, secondary, and tertiary
(post-secondary). Primary education consists of grade 1 to grade 5, which is for children age 6
to 10. Secondary education is divided into lower secondary education, which consists of grades
6 to 9 (for children age 11 to 14), and upper secondary education, which consists of grades 10 to
12 (for children age 15 to 17). Tertiary education is divided into undergraduate education and
graduate education. The two major legal documents governing education in Vietnam are the
Law on Universalization of Primary Education (1991) and the Education Law (2005 and 2009).
Current Vietnamese law (in particular, the first article of the Law on Universalization of Primary
Education) stipulates that the government ensure that all Vietnamese children complete grades 1
to 5. Indeed, estimates from the 2006 Vietnam Household Living Standards Survey data indicate
that 94 percent of Vietnamese children age 15-19 have completed primary education.
Vietnam’s education system is administered by the Ministry of Education and Training
(MOET). Under MOET, each province and district has a Department of Education and Training
(DOET) 8. Each district level DOET manages preschools, primary schools and lower secondary
schools, while each provincial DOET is in charge of upper secondary schools, secondary
teacher-training schools and some vocational schools. For these schools to run at the district and
provincial levels, the Ministry of Education and Training (MOET) provides only guidelines and
general programs to be carried out by provincial and district DOETs. MOET also directly
manages some teacher-training schools and some colleges and universities.
Relative to its low income level, Vietnam has achieved remarkable success in terms of its
basic education outcomes. While its GDP per capita in 2004 was US$ 502, less than one-half the
average of East Asian and Pacific countries and one-fourth the average of middle-income
countries, it has similar literacy rates to these two groups of countries (see Dang, 2008, for
details). The primary school completion rate for Vietnam is 92 percent, even slightly higher than
those for the above-mentioned groups of countries; gross enrolment rates in in 2006 were 90
8
There are now 63 provinces, 47 urban districts and 548 rural districts in Vietnam (GSO, 2012).
5
percent, 76 percent and 16 percent at the primary, secondary and tertiary levels, respectively
(World Bank, 2010). 9
Government support for education in Vietnam has increased in recent years. The share of
education in the national budget grew from 7 percent in 1986 (Pham and Sloper, 1995) to 15
percent in 2010 (GSO, 2012). The vast majority of Vietnam’s schools are public (government
operated) schools. The most privatized area of Vietnam’s education system is at the tertiary
level, yet even at this level the public system accounts for about 80 percent of the schools and 85
percent of the students (GSO, 2012).
At the end of the upper secondary level (grade 12), students must obtain a satisfactory score
on an examination to receive the upper secondary (high school) degree. Examinations are also
used to gain admission to some specialized upper secondary schools and to universities and other
post-secondary educational institutions. The exam to gain entrance into colleges and universities
is of particular importance to many Vietnamese students and their parents. Until 1987, there
was a single national entrance examination for colleges and universities operated by MOET.
Starting in 1988, each higher education institution implemented its own admission process (Tran
et al, 1995). However, the single national entrance examination was reintroduced in 2002
(MOET, 2002).
The education system in Vietnam currently appears typical of those in developing countries
in two respects. First, the public education system can fail to satisfy the needs of many
students. 10 Indeed, the demand for education appears to exceed the supply in Vietnam: between
1991 and 2004, gross enrollment rates more than doubled from 32 percent to 73 percent at the
secondary level, and increased fivefold from 2 percent to 10 percent at the tertiary level (World
Bank, 2006), while the growth rate of schools averaged only 3 percent during this same period.
While increasing enrollment rates at all levels is still one of Vietnam’s goals, there is particularly
heavy demand for higher education in Vietnam, and the current education system appears unable
to effectively meet that demand. Thus there is strict rationing at the tertiary level: over the school
years 1993-1994 to 2000-2001, only about 1 in 6 students who took the university/college
entrance examinations was admitted (MOET, 2006a).
9
The school enrolment rate at the tertiary level is for 2005.
But note this is the case not just in most developing countries (Glewwe and Kremer, 2006) but in some other
developed countries as well (see, for example, Kim and Lee, 2010 or Davies, 2004)
10
6
Although the number of private institutions in higher education has increased in recent years,
they are subject to close government control and must abide by rigid regulations. The
government still decides the enrollment numbers at private universities. This results in some
cases to disequilibrium in the education market. For example, the government decided to limit
enrollment at private universities to between 800 and 1500 students per year per university; yet
at Van Lang University, the largest private university in Vietnam, the number of students
wanting to matriculate reached 20,000. Other private universities, however, struggle to meet their
quota (Pham and Fry, 2004, p. 320). The quality of Vietnam’s private universities is also
generally viewed as lower than that of public universities. This imbalance between demand and
supply can be argued to drive the demand for supplementary education among parents to provide
their children with stronger competitive advantage to further advance their education at the best
universities.
Second, a weak monitoring system has given rise to corruption. Teachers, for example, can
force tutoring lessons on their own students to supplement their income. Anecdotal evidence
indicates that students—even first graders—can suffer from low exam scores if they refuse to
attend these ‘compulsory’ tutoring lessons (VnExpress, 2008, 2011a).
Data
To examine the characteristics associated with supplementary education use in Vietnam, I
use data from four sources i) the 2006 Vietnam Household Living Standards Measurement
Survey (VHLSS), ii) the 1997- 1998 Vietnam Living Standards Measurement Survey (VLSS),
iii) the 2008 Vietnam Household Testing Survey, and iv) local press in Vietnam.
The first two data sources are among the LSMS-type (Living Standards Measurement
Survey) surveys which are implemented with technical assistance from the World Bank in a
number of developing countries. These surveys provide rich information on student individual,
household, school and community characteristics and are nationally representative. While the
1997-1998 VLSS covers 6,000 households, the 2006 VHLSS covers 9,189 households across
Vietnam.
In addition to providing information regarding each individual’s schooling, the education
section in the household questionnaire provides detailed and separate components of expenditure
on education such as tuition fees, contribution to parent associations, cost of books,
7
transportation costs, and supplementary education expenditure for each student in the past 12
months. Compared to other rounds of the VHLSSs, the 2006 round has an expanded module on
supplementary education and collects data on the different types of tutoring classes such as
tutoring during school year time or tutoring during school breaks or one-on-one tutoring. Data on
the time students spent on tutoring are also collected by the 2006 VHLSS. The commune and
school questionnaires in both surveys collect information such as community infrastructure,
school facilities, and school finances and fees including fees for the tutoring classes organized by
schools. 11
The third source of data, the 2008 Household Testing Survey (VHTS) is a follow-up survey
that collects mathematics and reading test scores for a subsample of household members in the
2006 VHLSS. This survey interviews in total 1,384 households and 3,533 individuals. In this
survey, several questions were asked concerning supplementary education classes, including the
reasons for taking these classes. 12
Supplementary Education in Vietnam: General Description
Using the most recent survey data available, this section provides an updated discussion of
some major issues related to supplementary education in Vietnam. These include the reasons for
attendance at supplementary education as perceived by students themselves, the scale, cost, form,
intensity, and legality of supplementary education. Interested readers are referred to Dang (2008)
for a more detailed discussion, which is however based on data for previous years.
Reasons for Supplementary Education
Results from a recent survey by Mac (2002) (cited by Dang, 2008) indicates that the top three
reasons (40 percent to 70 percent of the responses) that parents, teachers, and students offer to
explain why students take supplementary education classes are: i) making up for poor ability and
keeping up with the class, ii) studying to pass the examinations and bettering one’s education,
and iii) not understanding the lessons. Other reasons for tutoring include gaining knowledge not
taught at school, and even daycare for students when parents are busy. And it is worrisome that
11
See Vietnam Living Standards Survey 1997-1998 (World Bank, 2000) and Vietnam Household Living Standards
Measurement Survey 2006 (GSO, 2006) for further details.
12
This is joint work with Halsey Rogers (World Bank), Paul Glewwe (University of Minnesota), Seema
Jayachandran (Stanford University), and Jeffrey Waite (World Bank). The survey was administered by Vietnam’s
Government Statistics Office, using funding from the World Bank’s Research Support Budget and the Hewlett
Foundation. For more details on the 2008 VHTS, see Dang and Glewwe (2009).
8
as high as 26 percent of the teachers and administrators think that students have to attend extra
lessons to please teachers, and even a higher number (36 percent) say that teachers create
demand for supplementary education because of their low salary. While very informative, this
survey has a small sample size and collects data from three major cities in Vietnam (and only
one city for students); thus results may not be nationally representative.
More recent and nationally representative data (VHTS) on the reasons student take
supplementary education classes is provided in Table 1. Tutoring classes are divided into two
categories based on their types of organization, the first category for tutoring classes organized
by students’ own school and the second category for other tutoring classes. Results are in fact not
very different from the figures provided by Mac (2002). Across the two types of tutoring, the
most important reason for taking tutoring is to prepare for examinations, which accounts for
almost half of all responses (42 percent- 47 percent). This is then followed by catching up with
the class (about 13 percent), acquiring better skills for future employment (13 percent) and
enjoying the subject matter (6 percent- 11 percent). Other reasons such as childcare, poor quality
lessons in school, or subjects not taught in mainstream classes account for only less than 3
percent of all responses for tutoring classes organized by schools. But understandably, a higher
percentage of students (6 percent) go to tutoring classes that are not organized by schools to
make up for the poor quality of lessons taught in schools.
The large difference between taking tutoring classes to prepare for examinations and other
reasons indicates again the importance of examinations in the school system in Vietnam, as
discussed earlier in Section 2.
Scale of Supplementary Education
The percentage of students taking tutoring classes at different levels of schooling is provided
in Table 2. An increasing number of students attend supplementary education classes at higher
school levels. In 2006, the proportion of students in supplementary education steadily increases
from 32 percent at primary schools to 46 percent at lower secondary schools and 63 percent at
upper secondary schools. There is a large difference in supplementary education attendance for
students in urban and rural areas, with the gaps ranging from 4 percent at the preschool level to
23 percent at the primary level.
Compared to 1998, the proportion of students in supplementary education increases slightly
(by 3 percent) at the preschool level, and remains practically unchanged at the primary level, but
9
decreases considerably (by 10 percent or more) at the secondary level. While this may appear
contradictory, the slight increase at the preschool level is in fact consistent with anecdotal
evidence about the recent trend to send children to tutoring classes from an early age. 13 And the
decrease at the secondary level can be associated with the recent education reforms in Vietnam,
which include, among other things, the abolition of end-of-school-level graduation examinations
for primary students in 2005 (NASRV, 2005) and lower secondary students in 2006 (MOET,
2006b), and the (re)introduction of a single national university entrance examination in 2002
(MOET, 2002).
Intensity of Supplementary Education
Richer households in Vietnam spend more on supplementary education than do poorer
households as seen in Table 3. Currently about 27 percent (= 100 percent- 73 percent) of
households in Vietnam send their children to private lessons and the majority of them (90
percent) spend between 1 percent and 5 percent of household expenditure on supplementary
education. The percentage of households with positive expenditures on supplementary education
is only 15 percent in the poorest (1st) consumption quintile, but nearly doubles to 27 percent in
the next richer quintile (2nd) and hovers around 30 percent in the remaining richer consumption
quintile (3rd to 5th). In terms of actual expenditure, the mean expenditure on supplementary
education for the wealthiest 20 percent of households is almost 14 times higher than that for the
poorest 20 percent of households. While this difference is most striking, it represents a dramatic
decrease from the 30-times difference in average expenditure on tutoring between the wealthiest
quintile and the poorest quintile in 1998.
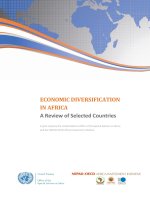
Figure 1 provides another look at the intensity of supplementary education in terms of
numbers of hours spent on this form of education, broken down by schooling levels and urbanrural areas. On average, students across Vietnam spend 89 hours attending supplementary
education classes—which is represented by the dashed line in Figure 1—and students spend
more time at higher schooling levels. There is a large urban-rural divide in the numbers of hours
attending tutoring classes, with urban students spending around twice more than rural students do
at all levels of schooling. In particular, while rural students at all schooling levels spend less than
the national average except for the upper secondary school level, urban students at all schooling
13
See Dang (2008) for more details.
10
levels spend more than this amount. I will come back to more discussion of this issue in Section
5.
Forms of Supplementary Education
There are many forms of supplementary education in Vietnam. Supplementary education can
be organized by students’ parents, by teachers, by schools or by supplementary education
centers. Supplementary education can range from selective classes of just one student at either
the student’s or the teacher’s home to very large classes of 200-300 students in supplementary
education centers (Chu and An, 2001a). Teachers teach such large classes by using a microphone
in large theaters (Nguyen, 2002). This model of supplementary education classes resembles
college classes.
Our calculation using data from the 2006 VHLSS shows that across the country, most
students attend tutoring classes organized at their own schools. During the school year, as many
as 70 percent of all tutees attend these classes at school, 26 percent attend these classes at the
tutors’ homes, with the rest attending these classes at their own homes or other places. During
the break, the share of students who attend tutoring classes at school is lower while the share of
students who attend tutoring classes at the tutors’ home is higher. The former group still accounts
for the majority of tutees at 53 percent, and the latter 42 percent.
In major cities in Vietnam, however, a very popular form of supplementary education seems
to be supplementary education centers, which are usually concentrated in neighborhoods near
universities. Bach (1999) reports that there were around 50 such centers in 1999 in just one
district in Hanoi where a large university is located. One possible reason there are so many of
these centers is that it is easy to set up the infrastructure for these centers. Bach (1999) observes
that:
“Investing in establishing supplementary education centers is becoming a lucrative business
for business owners; with a room 18-25m2, and about US$75 for blackboard and desks, it is
possible to set up a supplementary education center, which can accommodate dozens of
students.” 14
14
In this paper, all figures in Vietnamese Dong are converted to US currency using the exchange rates of US$ 1 for
D 13268, D 14725 and D 15994 respectively for 1998, 2001, and 2006 (World Bank, 2010).
11
At some centers, the number of students in a class is rarely under 100 (Phi, 1999). 15 However,
students are still attracted to these centers. One extreme case was reported that because the
classroom was too crowded, a group of seven female students agreed to pay half of that session
fee and sit on the classroom verandah; one student had her ear to the window to listen to the
lessons then she repeated what she heard for the other six students to write down (Nam Viet,
2002).
Cost of Supplementary Education
Table 4 shows the weekly fees for tutoring classes organized by schools across Vietnam, 16
which are divided into two categories, one for tutoring classes taken during the school year and
the other for tutoring classes taken during the school break/ holiday. On average, primary
students have to pay US$ 0.34 per week to attend tutoring classes during the school year, and the
corresponding figures for lower secondary and upper secondary schools are respectively $0.4
and $0.73. The fees sharply increase with the level of education: they increase by 20 percent
from primary school to lower secondary school and by 80 percent from lower secondary school
to upper secondary school. Fees for tutoring classes during the break/ holiday are higher than
those for tutoring classes during the school year and range from 5 percent to 38 percent higher
respectively at the primary and lower (or upper) secondary level.
At supplementary education centers, students can pay for supplementary education either by
session or by month. The supplementary education fees at supplementary education centers in
Hanoi are usually from $0.27 to $0.48 per session, of which teachers receive 65 percent-70
percent (Chu and An, 2001a). However, when there is more demand, the fee can increase to
$0.54- $0.68 per session (Chu, 2002). A crash supplementary education course for one subject
for one month costs from around $24 to $136 in Ho Chi Minh City (Dinh, 2001).
The fees for individual supplementary education sessions at either the students’ or the
teachers’ home may vary depending on the specific circumstances. This is perhaps the most
expensive form of supplementary education because of the personalized attention received by
15
It is reported that some students were even hospitalized because of lack of space in these overcrowded classrooms (Bach, 1999).
16
Most of (96%) these schools are public schools.
12
students. On average, the fees for such classes are between $60 and $75 per student per course
(Dinh, 1999). 17
Legality of Supplementary Education and Public Opinions
There has been much public debate about the high prevalence of supplementary education in
Vietnam. The topic has come up not just in the media, including television broadcasts,
newspapers and journals, but also in the National Assembly’s question and answer sessions for
the Minister of Education. Indeed, supplementary education has become so serious a concern
that the Vietnamese government has issued several legal documents at the ministerial levels
prohibiting compulsory and mass-scale extra classes at school (Decree No. 242/Prime Minister,
1993), and stipulating the ranges for extra class fees that schools can charge students (Circular
No. 16/Prime Minister-Interministerial, 1993). However, after the promulgation of these
regulations, supplementary education classes still developed so much so that the Ministry of
Education had to issue more legal documents regulating it. Most notably among them was
Circular No. 15/MOET, a document that outlined urgent measures to be taken to control
supplementary education. Punishments for breaking these regulations can be severe; three lower
secondary school principals were even fired because of supplementary education (MOET, 2001).
The latest regulation at the ministerial level on supplementary education was issued by the
MOET in mid-2012. This document appears to be stricter and provide more specific guidelines
than an earlier one drafted in early 2007. According to this legal document, organizations and
individuals can provide supplementary education only if they are granted a permit by the local
authority, and it is forbidden to teach supplementary education to students who already study two
sessions (two shifts) of formal schooling per day. Private tutoring is banned at the primary school
level, and teachers are forbidden either to cut the materials in regular school hours to teach in
their private tutoring sessions or to teach these materials in their private tutoring sessions in
advance of the regular school hours. Teachers are also forbidden to provide tutoring sessions to
their own students except where they are allowed to do so by their supervisors. Most remarkably,
it is also stipulated that violators of the regulation can be prosecuted (MOET, 2007, 2012). These
actions show the Vietnamese government’s determination to control supplementary education. It
can be seen that the Vietnamese government does not completely ban supplementary education,
17
The length of a private tutoring course varies, but it usually lasts from at least three months to one full year.
13
but it does not encourage supplementary education either. The Vietnamese government seems to
recognize that supplementary education can have both beneficial and undesirable impacts, thus
the government prefers to control and manage supplementary education as much as it can.
At the provincial level, measures to control supplementary education vary. Before the
stipulation of the regulations on supplementary education discussed above, some provinces were
reported to come up with their own guidelines which includes making teachers promise not to
teach supplementary education classes (Huynh, 2005).
While the efforts at regulating supplementary education by the government enjoy popular
support, they are not satisfactory to all stakeholders. Some school administrators believe that the
government is doing too much by micro-managing teachers with these too specific regulations;
some government officials and parents think that it is inappropriate to ban supplementary
education at the primary school level despite the current existing demands, and that a ban is not
an effective regulatory measure (Hoai Nam, 2013). Concerns were also raised by teachers and
school administrators that the causes of tutoring run deep (and are due to, for example,
demanding school curricula and low teacher salaries); without addressing these underlying
factors, a ban on tutoring may only be skin-deep (Khanh Binh, 2013). It thus appears that a
public opinion poll or nationally representation survey on all stakeholders’ viewpoints on
supplementary education is much called for and would provide useful inputs into the
government’s development of regulations on tutoring. 18
Further Quantitative Analysis
In a recent review of the literature on the determinants of supplementary education, Dang and
Rogers (2008) find that standard economic theory predicts that certain factors play an important
role in determining household expenditure on tutoring, which are supported by empirical
evidence from a number of different countries at different income levels and in different
geographical locations (e.g., Egypt, South Korea, Turkey, Vietnam). These factors include
household income, parental education, and urban location. In addition, other factors that may
matter across countries are student current grade level and household size. While the former is
found to be positively correlated with spending on tutoring the closer students are to the last
18
Silova, Budiene and Bray (2006) provide an informative review of student attitudes toward supplementary
education in several countries in Central Asia. Similar work can perhaps be developed to look at parents’, teachers’,
and school administrator’s viewpoints on supplementary education.
14
grade in their current school level, the latter is negatively correlated with tutoring expenditure.
These same results are found for Vietnam using data in 1998 in my earlier studies (Dang, 2007,
2008).
In this section I will examine the correlation between these factors and household investment
in tutoring using more recent data from Vietnam. I pay attention to both the common factors (i.e.,
household income, parental education, and urban location) and the factors that may be particular
to Vietnam (i.e., student current grade level, ethnicity, and household size). In particular, I look
at the impacts of ethnicity on tutoring attendance and expenditure, which appears to have
received little attention in the literature. 19 Even though their living standards are increasing with
the country’s economic growth, ethnic minority households are still lagging behind their ethnic
majority peers on a multitude of welfare outcomes including consumption, education and
health. 20
I begin first by examining in a graphical format the bivariate relationship between tutoring
expenditure and some major correlates such as student grade level, ethnicity, and household size.
Some Major Correlates
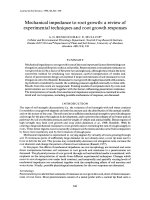
Figure 2 plots yearly tutoring expenditure against student current grade level using both data
in 1998 and 2006 for Vietnam. Three remarks are in order for this figure. First, it can be seen that
expenditure on tutoring steadily rises with the grade level children are enrolled in. For example,
in 2006 an average urban household spends around $19 on tutoring if their child is in the 2nd
grade, but spends twice more at $41 and more than three times more at $67 if their child is in the
5th grade and the 12th grade, respectively.
Second, there is, again, a noticeably large gap between tutoring expenditure for urban and
rural areas, with urban households spending much more than their rural counterparts. This
confirms the similar results I discussed on Figure 1 in an earlier section. Third, despite the
shrinking relative gaps in spending between urban and rural households—which are calculated to
19
Notable exceptions are Buchmann, Condron, and Roscigno (2010) and Byun and Park (2012) who analyze data
from the US. The former finds that Asian and black students are more likely to take private tutoring classes than
their white peers, and the latter finds that East Asian American students are most likely to take a commercial SAT
test preparation course for enrichment purposes, while black students were most likely to utilize private tutoring for
remedial purposes.
20
See, Baulch et al. (2010) and Dang (2012) for more details on the welfare between different ethnic groups in
Vietnam. The ethnic gaps in living standards and human development outcomes do not exist in Vietnam alone, but
are also found in other countries across the world. See, for example, Hall and Patrinos (2012) for a recent study.
15
range from 2.4 to 56.4 times in 1998, but range from 1.9 to 4.5 times in 2006—the absolute gaps
in spending in fact widen over time. For example, this absolute urban-rural difference in
spending for a 9th-grader increases from $27 in 1998 to $44 in 2006. 21
The disparities between ethnic minority and majority groups in attendance at tutoring classes
have been observed in my earlier study (Dang, 2007). Figure 3 provides an update by plotting
supplementary education attendance rates for the two ethnic groups by schooling levels for 1998
and 2006. As discussed earlier, overall supplementary education attendance for the whole
country decreased from 1998 to 2006 for both groups, which is confirmed by the decreases for
both ethnic groups in Figure 3. However, it is worrisome that the gaps in attendance rates for the
two groups become larger over time, especially at higher schooling levels. For example, during
1998- 2006 while the ethnic gap increases from 2 percent to 5 percent at the primary school level,
it jumps from 22 percent to 41 percent at the upper secondary school level. Even more
worrisome is that this happens despite the fact that the ethnic minority group mostly live in rural
areas and that the gaps between urban and rural areas converge at higher levels of schooling
(Table 2). A possible explanation for this reverse trend may be due to the widening disparities in
living standards between the different ethnic groups in Vietnam in recent years.
Another factor that was found to be negatively correlated with household expenditure on
tutoring is household sizes or the number of children in the household. 22 This same result holds
for Vietnam in 2006. Household sizes are negatively correlated with both expenditure and hours
spent on tutoring as depicted in Figure 4, which are steadily lower for children as their sibsize
grows larger. One more sibling is associated with decreases in annual spending on tutoring
ranging from $3 to $5; the corresponding decreases in annual hours spent on tutoring ranges
from 6 hours to 33 hours. In addition, tutoring expenditures in 2006 are generally lower than
21
The deflator for the Vietnamese currency between 1998 and 2006 can be calculated to be around 36% (World
Bank, 2010). Even after applying this deflator, the urban-rural absolute gap in spending still increases significantly
over this period.
22
It is a well-known empirical fact that larger household sizes are negatively correlated with the household
investment in their children, which is supported by the economic theory developed by the Nobel prize winner
Becker and his colleagues (Becker, 1993; Becker and Lewis, 1973). According to this theory, parents make the
simultaneous choice of how many children to bear and how much to invest in their children. Thus, more children
would mean fewer resources invested per child and vice versa, which is usually referred to in the economic literature
as the “quantity-quality” trade-off issue. One important implication from this theory is that the simple (bivariate)
relationship between household sizes and household investment in children should be considered as correlational
rather than causal. Further analysis of the causal relationship between household sizes and investment in children
tutoring is provided in Dang and Rogers (2013).
16
those in 1998 at any given number of siblings, which is consistent with the trend discussed
earlier that fewer children attend tutoring in 2006 compared with 1998.
Multivariate Regression Analysis
Since household expenditures on tutoring can be regarded as the observed level of their
unobserved propensity to spend on tutoring, and we do not observe negative values of household
expenditures, household expenditures are a left-censored variable. Thus the appropriate model to
evaluate the determinants of household expenditure on tutoring is a Tobit model. 23 I will then
estimate a Tobit model where the dependent variable is log of household expenditures on
tutoring 24 and the explanatory variables include several sets of variables. These variables are
added in a sequential manner to highlight the differential impacts of model specification. The
estimated (marginal) impacts are presented in Table 5, and the full estimated coefficients with tstatistics are presented in Table 1.1 in the Appendix.
It should be noted that there are two main ways to interpret the marginal impacts of the
explanatory variables in a Tobit model depending on the outcomes of interest. If we are
interested in looking at the marginal impacts of the explanatory variables on household
propensity to spend on tutoring classes, we can just look at the estimated coefficients in Table
1.1 in the Appendix. However, if we want to know the marginal impacts on households’
observed spending, we should look at the coefficients in Table 5. 25 In other words, while the first
way of interpretation offers a look at household potential spending on tutoring, the second way
provides estimates on household actual spending. Perhaps both ways would be of interest to
policy makers who may want to design educational intervention programs not just for the present
(i.e., based on actual spending) but for the future (i.e., based on potential spending) as well. For
23
This is a popular statistical model invented by another Nobel prize-winning economist, James Tobin. Consider the
latent variable 𝑦𝑖∗ that represents household potential spending on tutoring. We only observe household tutoring
spending 𝑦𝑖 when this potential spending is larger than 0, and observe zero spending when this potential spending is
negative. The Tobit model has this general form 𝑦𝑖∗ = 𝑥′𝑖 𝛽 + 𝜀𝑖 where 𝑦𝑖 = 0 if 𝑦𝑖∗ ≤ 0 and 𝑦𝑖 = 𝑦𝑖∗ if 𝑦𝑖∗ > 0. 𝑥′𝑖
represents the explanatory variables, and 𝜀𝑖 the error terms. For more details on the Tobit model, see Greene (2012)
or Long (1997). This model is estimated using the software Stata (StataCorp, 2009). Standard errors are clustered at
the household level to account for household heterogeneity. As a robustness check, Tobit estimates using household
random-effects (not shown) provide very similar results.
24
To minimize the number of missing values due to this logarithmic transformation, this variable is set to 0 for
households with zero expenditure on tutoring.
25
The marginal impacts for household propensity to spend is calculated using the formula
marginal impacts for household actual spending is calculated using the formula
(2012) or Long (1997) for more details.
17
𝜕𝐸(𝑦𝑖 |𝑥𝑖 )
𝜕𝑥𝑖
𝜕𝐸(𝑦𝑖∗ |𝑥𝑖 )
𝜕𝑥𝑖
𝑥′𝑖 𝛽
= 𝛽Φ(
𝜎
= 𝛽, and the
). See Greene
our purposes, I will focus on the marginal impacts for household actual spending in Table 5, and
similar observations can be made about the estimates in Table 1.1.
I consider the directions of impacts for estimate results using four different sets of
explanatory variables sequentially, which corresponds to our above discussion about the major
correlates of household spending on tutoring, before discussing the specific impacts of these
variables. Children in the age range 6- 17 are considered since this is the school age range.
The first set or the basic set of variables include children’s age, gender, and household head’s
years of schooling completed, household living standards (as measured by household
expenditures net of expenditure on tutoring), a dummy variable indicating household residence
area (urban or rural), and dummy regional variables. 26 As discussed earlier, these are the
variables that have been found to be important determinants of expenditure on tutoring across
different countries (Dang and Rogers, 2008), thus they are included in all regressions. Estimates
using this first set of explanatory variables are provided in Model 1, Table 5.
As expected, estimation results in Model 1 in Table 5 show that household head’s years of
schooling, household living standards, and residence areas have strong and positive impacts on
household expenditure on tutoring. Controlling for other factors, households spend more on older
children and girls.
The second set of explanatory variables includes all the variables in the first set and adds a
dummy variable indicating children ethnicity. Estimates using the second set of explanatory
variables are provided in Model 2, Table 5. All the coefficients in Model 1 are still significant
and change very little in magnitude. The coefficient on ethnicity is positive and highly
statistically significant, confirming the earlier result that ethnic majority groups spend more on
tutoring than ethnic minority groups.
The third set of explanatory variables adds to the second set a count variable for the years
before the last grade in students’ current school level and two dummy variables indicating lower
secondary school and upper secondary school. These variables are supposed to tease out the
impacts of schooling levels and end-of-level grades on tutoring expenditures as we see earlier in
our descriptive tables and graphs. Estimates using the second set of explanatory variables are
26
These dummy regional variables are for the six regions, North East and West, North Central, South Central Coast,
Central Highlands, South East, and Mekong River Delta. The reference region is the Red River Delta (that houses
the country’s capital Hanoi). These dummy variables are negative in all the regressions, indicating these regions
have lower expenditures on tutoring than the Red River Delta.
18
provided in Model 3, Table 5. All these new variables are strongly significant while all the
variables in Model 2 remain significant, except for age. This confirms the pattern of more
tutoring expenditure at higher schooling levels, especially as students get closer to the end-oflevel grade in their current school level. The variable age now becomes insignificant which
shows that the significant impact we saw earlier with this variable is in fact not caused by student
age itself but rather student progression to higher grades in school.
Finally, the fourth set of explanatory variables is the most comprehensive and adds each one
of three different groups of variables on household sizes to the third set. The first group adds a
count variable for the number of siblings in the age range 0- 17, while the second group adds
count variables for the number of siblings in the sub-age ranges 0- 5, 6- 10, 11- 14, and 15- 17.
These age ranges respectively correspond to the four schooling levels including preschool,
primary school, lower secondary school, and upper secondary school. And the third group adds
count variables for the number of brothers and sisters in the sub-age ranges 0- 5, 6- 10, 11- 14,
and 15- 17. These count variables for the number of siblings are expected to be negative because
of the negative association between household sizes and expenditures on tutoring. Estimates
using the fourth set of explanatory variables are provided in Models 4, 5, and 6, Table 5. Indeed,
most of these variables are negative and highly significant, which confirms the negative
association between household sizes and investment in children tutoring as I discussed earlier.
To quantify the impacts of each variable, we can then turn to interpreting the marginal
impacts (for observed household tutoring spending) provided in Table 5. I focus on interpreting
results from Models 3, 4, 5, and 6 since these Models include the most explanatory variables.
Again, estimation results on household size coefficients (Models 4, 5, and 6) should be
considered to have a correlational rather than causal relationship with household expenditure on
tutoring.
It is rather straightforward to interpret the impacts in Table 5, which are expressed in
percentage terms. For example, controlling for other factors, one additional year of schooling
completed by the household head will result in a 7- 8 percent increase in household expenditure
on tutoring. Ethnic majority households spend 1.7- 1.8 times more on tutoring than ethnic
minority households, as do urban households which spend 0.5- 0.6 times more than rural
19
households. A one percent increase in household expenditures can bring up expenditure on
tutoring by around 0.5 percent.
Controlling for other factors, households spend 40 percent more on tutoring when their child
progresses from primary school to lower secondary school and 83 percent more when their child
progresses to upper secondary school (Model 3). At the same time, one year closer to the end-oflevel grade induces households to spend 15 percent more. These increases in spending are rather
large compared to the reduction of 23 percent if the household has one more child in the school
age range (Model 4). Notably, one more child in the age ranges 11- 14 or 15- 17 has larger
negative impact on household spending than one more children in the age ranges 0- 5 or 6- 10,
which can reflect household larger investment in their children as they progress further in school.
However, the coefficients on the number of brothers and sisters are rather comparable and do not
appear to indicate any strong pattern of gender bias (Models 5 and 6).
Conclusion
This paper provides an update of the supplementary education phenomenon in Vietnam using
the latest data available from household surveys, government statistics, and the local media. I
find that at the macro level, factors that drive the growth of private tutoring in Vietnam include
cultural influence, rigidity of the tertiary education level, and the imbalance between demand and
supply in education. The three most popular reasons for tutoring attendance are preparing for
examinations, catching up the class, and acquiring better skills for future employment. The
proportion of students attending private tutoring goes up steadily from 32 percent at the primary
school level to 46 percent and 63 percent respectively at the lower secondary level and upper
secondary level in 2006. Richer households spend much more than poorer households, with the
wealthiest quintile spending 14 times more than the poorest quintiles; however compared to
1998, this gap has narrowed significantly.
I examine the major correlates in the determination of tutoring at the micro level such as
household income, household heads’ education and residence areas, student current grade level,
ethnicity, and household sizes. I focus on the last three variables since they are not often
discussed in the previous literature on the determinants of tutoring, and find them to be strongly
associated with household expenditure on tutoring. In particular, controlling for other factors,
ethnic majority households spend 1.7- 1.8 times more on tutoring than ethnic minority
households; households spend 40 percent and 83 percent more on tutoring when their child
20
progresses respectively from primary school to lower secondary school and from lower
secondary school to upper secondary school; households also reduce tutoring expenditure by 23
percent if there is one more child in the school age range.
Supplementary education can be argued to be an educational service that helps enhance
student learning and should be well-regulated and encouraged by the government. At the same
time, given the disparities in attendance at tutoring classes between rich and poor, urban and
rural, and ethnic majority groups and minority groups, the concern about inequalities in access to
tutoring seems to be indeed justified. Apart from access issues, the latter groups may suffer
compound disadvantages since rural households are also poorer (Nguyen et al., 2007), more
likely to belong to ethnic minority groups (Dang, 2012), and live in larger-size households (Dang
and Rogers, 2013). Thus, while it is clearly not simple to find the best policies to address these
inequalities, these results point to the fact that educational policies should be combined with
other, say economic, policies for the most effective and efficient impacts. Seen in this light, there
are multiple returns, economic and non-economic, to welfare programs in areas such as poverty
reduction or road construction to better serve rural communities.
This paper focuses on the tutee (i.e., students in tutoring classes) and does not discuss the
profile of the tutor (i.e., teachers in tutoring classes) in Vietnam. In fact, scanty quantitative
evidence currently exists on the supply side of supplementary education for other countries as
well. The few existing studies point to the role that incentives—both monetary and nonmonetary—play in motivating teachers to provide tutoring to their students in Lao PDR (Dang,
King and Waite, 2013), and even suggest that teachers in Nepal may teach less during the regular
school day when their school offer tutoring for fees (Jayachandran, 2013). In the context of
Vietnam, the diverse forms of supplementary education classes seem to be equally matched by
the various types of private tutors, who can include both full-time tutors and part-time tutors such
as college students, retired school teachers, university professors, poets, and writers.
Understanding these tutors’ profiles, motivations, and tutoring methods can be a fruitful topic for
further research.
More generally, supplementary education evolves with changing education supply and
demand in society. As such, richer data obtained through nationally representative samples can
be collected on a periodic basis either in special surveys or as additional modules in household
expenditure surveys (for example, with the VHLSSs). This information is always useful for
21
policymakers to develop guidelines that are relevant to the regulation of supplementary
education.
22
References
Bach, Ngoc Du. (1999). “Ha Noi: Chan Chinh Cac Co So Luyen Thi Dai Hoc” (Hanoi: Rectifying
Supplementary education Centers for University Entrance Examinations). Education and Times, vol.
71, p. 5.
Banerjee, Abhijit V., Shawn Cole, Esther Duflo, and Leigh Linden. 2007. “Remedying Education:
Evidence from Two Randomized Experiments in India.” Quarterly Journal of Economics 122
(3): 1235–64.
Baulch, Bob, Hoa Thi Minh Nguyen Phuong Thu Thi Phuong Hung Thai Pham (2010). “ Ethnic
minority poverty in Vietnam” . Chronic Poverty Research Center Working paper # 169.
Becker, Betsy Jane. (1990). “Coaching for the Scholastic Aptitude Test: Further Synthesis and
Appraisal.” Review of Educational Research 60 (3): 373–417.
Becker, Gary. (1993). “Human Capital- A Theoretical and Empirical Analysis with Special Reference to
Education- 3rd edition”. Chicago: University of Chicago Press.
Becker, Gary, and H. G. Lewis. (1973). “On the Interaction between the Quantity and Quality of
Children.” Journal of Political Economy 81: S279-288.
Bray, Mark (1999). “The Shadow Education System: Supplementary education and Its Implications for
Planners.” Fundamentals of Educational Planning No.61. Paris: UNESCO International Institute for
Educational Planning (IIEP).
---. (2009). “Confronting the Shadow Education System. What Government Policies for What
Supplementary education.” Paris: United Nations Education, Scientific and Cultural Organization,
International Institute for Educational Planning.
Bray, Mark and Chad Lykins. (2012). Shadow Education: Private Supplementary Tutoring and Its
Implications for Policy Makers in Asia. Hong Kong: Asian Development Bank and University of
Hong Kong.
Briggs, Derek C. (2001). “The Effect of Admissions Test Preparation: Evidence from NELS: 88.” Chance
14 (1): 10–18.
Buchmann, Claudia, Dennis Condron, and Vincent Roscigno. (2010). ‘‘Shadow Education, American
Style: Test Preparation, the SAT and College Enrollment.’’ Social Forces, 89(2): 435-61.
Byun, Soo-yong and Hyunjoon Park. (2012). “The Academic Success of East Asian American Youth:
The Role of Shadow Education”. Sociology of Education, 85(1) 40–60.
Chu, Hong Van and An Kien. (2001a). “Thay Gi O Cac Lo Luyen” (What We See in Supplementary
education Centers). Education and Times, Issue 73, p. 6.
Chu, Hong Van. (2002). “Luyen Thi Cap Toc O Ha Noi: Nhung Chuyen Chi Co O Thang 6” (Cramming
in Hanoi: Things That Only Happen in June). Education and Times, Issue 73, p. 2.
23