RESEARCH ON THE FIRST ORDER GAMMA AUTOREGRESSIVE GAR(1) MODEL TO APPLY IN THE FIELD OF HYDROLOGY
Bạn đang xem bản rút gọn của tài liệu. Xem và tải ngay bản đầy đủ của tài liệu tại đây (726.51 KB, 27 trang )
1
MINISTRY OF EDUCATION AND TRAINING
DANANG UNIVERSITY
NGUYEN VAN HUNG
RESEARCH ON THE FIRST ORDER GAMMA
AUTOREGRESSIVE [GAR(1)] MODEL
TO APPLY IN THE FIELD OF HYDROLOGY
SPECIALIZATION: COMPUTER SCIENCE
CODE: 62.48.01.01
SUMMARY OF DOCTORAL DISSERTATION
DA NANG - 2016
2
The doctoral dissertation has been fulfilled at
Danang University
Science Advisors:
1. Associate Professor, Dr. Sc. Tran Quoc Chien
2. Professor, Dr. Huynh Ngoc Phien
Reviewer 1: Professor, Dr. Nguyen Thanh Thuy,
Hanoi University of Technology.
Reviewer 2: Associate Professor, Dr. Nguyen Mau Han,
Hue University of Science.
Reviewer 3: Dr. Pham Minh Tuan,
DaNang University.of Technology.
The dissertation is defended at the Examination Committee at the level of
Danang University on June 24, 2016.
The dissertation can be referred at:
- Vietnam National Library;
- The Center of Information and Documentation of Danang University.
1
INTRODUCTION
Nowadays, computer science plays a very important role in the
development of worldwide, has deeply impact on most of the fields
of engineering, socio-economic. There were many works in the field
of computer science research on telecom-informatics, biomedicalinformatics already bringing tremendous efficiency to human life,
meanwhile, works research on hydrological-informatics are still
shortcomings. The purpose of this study aims to contribute to the
development of hydrological-informatics now and in the future. To
reach this purpose, the objectives of this study are as follow:
- Research on GAR(1) model, overview of works related to:
GAR(1) model, stochastic simulation method, methods for
generating random variates, models for simulating of streamflows
and reservoir capacity problem.
- Study of the algorithms for generating GAR(1) variables
includes: algorithms generate the random variables with the uniform
distribution, exponential distribution, normal distribution, Poisson
distribution and the gamma distribution.
- Study of the models for simulating of monthly and annual
streamflows and investigation on the mean range of reservoir storage
with infinite capacity.
CHATER 1
THE GENERAL PROBLEMS
To reach the objectives of the study: Research on The first order
gamma autoregressive [GAR(1)] model and to apply in the field of
hydrology, the author studies documents, works have been published
in local and abroad related to the following issues:
- Theoretically: The basic research on probability theory, study of
the algorithms to generate random variables, methods, models and
algorithms used to simulate the monthly and annual streamflows and
the reservoir problems.
2
- Reality: The results related to the experiments, simulating the
streamflows at the hydrological gauging stations and reservoir
capacity.
1.1. Several Basic Problems of Probability Theory
This section presents the basic theory of probability includes the
concept of random variable, distribution, probability density function
and the numerical characteristics of random variables such as: the
expectation, variance, skewness coefficient and the kurtosis
coefficient, and as a basis for further study.
1.2. The Gamma Distribution
1.2.1. The Probability Density Function
A continuous random variable X is said to have a threeparameter gamma distribution if its density can be expressed as:
(
)
(
)
( )
(1.1)
( )
where
are respectively the
shape, scale, and the location parameter. The gamma function ( ) is
defined by:
( )
∫
when c = 0 we have the two-parameter gamma distribution, and,
when c = 0 and b= 1 we have the one-parameter gamma distribution.
By transformation method, the gamma variables with two
parameters or three parameters can be converted into the gamma
variables with one parameter. For the three-parameter variables, the
transformed variables can be obtained by: y=(x-c)/b or x=c+by. For
two-parameter variables the transformation used is: y=x/b or x=by.
Hence, y follows the one-parameter gamma distribution.
1.2.2. The Statistical Descriptors
The statistical descriptors of the three-parameter gamma
distribution are given by the following formulas:
Expectation:
E(X) =
(1.2)
3
Variance:
Skewness:
Var(X) =
=
(1.3)
(1.4)
√
1.3. The First-order Autoregressive [GAR(1)] Model with
Gamma Variables
1.3.1. GAR(1)Model
The model by Lawrance and Lewis(1981) has the following
form:
(1.5)
where Xi is the random variable representing the dependent processes
at time i, Ф is autoregressive coefficient and ei is an independent
variable to be specified. Xi has a marginal distribution given by a
three-parameter gamma density function defined as Eq.(1.1). The
process defined by Eq.(1.5) is denoted as the GAR(1) model. To
simulate the process, the parameters of the model must be known and
ei can be generated by certain generators (unit uniform, exponential
and Poisson generator).
1.3.2. Estimation of GAR(1) Model Parameters
Fernandez and Salas(1990) have presented a procedure for bias
correction based on computer simulation studies, applicable for the
parameters of GAR(1) model. The stationary linear GAR(1) process
of eq.(1.5) has four parameters, namely a, b, c and Φ. By using the
method of moments, these parameters and the population moments of
the variable Xi have the following relationships:
(1.6)
(1.7)
(1.8)
√
Φ,
(1.9)
2
where M,S ,G,R are the mean, variance, skewness coefficient, and the
lag-one autocorrelation coefficient, respectively. These population
statisticals can be estimated based on a sample {X1, X2,…, XN} by:
∑
(1.10)
4
∑
(
)(
)
(
∑
)
(
(1.11)
)
(1.12)
)
∑
(
)(
(1.13)
(
)
where m, s, g and r are estimators of M, S, G and R respectively and N
is sample size. As the variables are dependent and nonnormal, some
of these estimators are biased. Hence some correction needs to be
made and after that we obtain the unbiased estimators of M, R, S and
G. Once all these values are computed, Eqs.(1.6)-(1.9) are used to
estimate the set of model parameters a, b, c and Φ, respectively.
1.4. Generating of GAR(1) Variables
To generate GAR(1) variables, the algorithms for generating of
random variables having unit uniform distribution, exponential
distribution, normal distribution, Poisson distribution and gamma
distribution need be used. Various algorithms have been suggested to
generate the random variables having gamma distribution and
divided into two cases: (1) For shape parameter a≤1, and, (2) For
shape parameter a>1. Several works suggested algorithms for
generating gamma variables with any value of shape parameter such
as the work of Marsaglia and Tsang (2000), and recently, as
remarked by Hong Liangjie (2012), the algorithm proposed by
Marsaglia and Tsang (2000) is ease coding and having fastest speed
and was installed in the GSL library and Matlab software "gamrnd".
1.5. Streamflow Simulation Problem
The problem of streamflow simulation is based on annual or
monthly historical data which were observed at hydrological stations,
using the model to generate sequences of data with length of n
having the same numerical characteristics, namely mean value,
standard deviation, skewness coefficient and correlation coefficient
of historical data. The parameters of the historical series of monthly
5
flows (i.e. mean value, standard deviation, skewness coefficient) are
computed by the following expressions:
∑
∑
(
)(
(
)
)
∑
(
)
The models using for streamflow simulation are classified into
parametric and nonparametric models. Parametric models are divided
into categories: independent and dependent of historical data.
Starting with the assumption that history data is independent and
having defined probability distribution, several models have been
proposed, and in which, the Thomas-Fiering model using for
streamflow simulation with any probability distribution type is
commonly used. With the diversity of climate, many works
determined the streamflows are often follow a dependent and skew
distribution, and for this case, Fernandez and Salas(1990) showed
that GAR(1) model is very effective in annual streamflow simulation.
1.6. Reservoir Capacity Problem
There are many problems in the study of reservoir such as
planning, designing, operating or multi-reservoir operating. For the
problems of planning, designing reservoirs, important issue is to
determine the capacity of reservoir based on the inflows and the
outflows of reservoir. Studies of reservoir capacity depending on the
cases, namely finite, semi-finite, and infinite. A finite capacity
reservoir allows both spillage and emptiness, while a semi-finite
capacity reservoir allows either spillage or emptiness only. An
infinite capacity reservoir allows neither spillage nor emptiness in the
sense that it will never spill or run dry throughout its life time of n
years and as shown in the work of Salas-La Cruz(1972), this
assumption is suitable for planning and design studies of large
6
capacity reservoirs. (hundred million
and up). However, with
climate change being recognized widely nowadays, extreme
conditions of rainfall and runoffs, resulting in long periods of
droughts and big floods, will occur. These conditions call for the
construction of reservoirs with big storage capacity for flood
protection and for adequate water supply during drought periods. As
such, range analysis becomes an appropriate method for use again.
CONCLUSION OF CHAPTER 1
From the systematic study of themed works published, the author
discovered the following shortcomings:
There is no study, evaluation, selection of the appropriate
algorithms to generate GAR(1) variables, no suggested model using
for monthly streamflow simulation with GAR(1) process and how to
determine the mean range of reservoir storage with GAR(1) inflows.
From the foregoing shortcomings, the research orientations are:
considers the effectiveness and selects the appropriate algorithms for
generating GAR(1) variables, studies the numerical characteristic of
the sum of GAR(1) variables, investigates the monthly and annual
streamflow simulations with GAR(1) variables and the mean range of
reservoir storage with GAR(1) inflows.
CHAPTER 2
ALGORITHMS FOR GENERATING GAR(1) VARIABLES
This chapter presents the algorithms for generating GAR(1)
variables. By means of theoretical and simulation methods, the basic
theory and the algorithms for generating GAR(1) variables are
studied, implemented and tested.
2.1. Investigation of Several Algorithms for Generating GAR(1)
Variables
To apply the GAR(1) model in practice, needs to generate the
GAR(1) variables based on the statistical sample. To generate
7
GAR(1) variables should incorporate random variable generators
with the unit uniform distribution, exponential distribution, normal
distribution, Poisson distribution and the gamma distribution.
2.2. Proposed Algorithm to Generate The Gamma Variates
The algorithm by Minh(1988) was used to generate variates
having a gamma distribution with shape parameter a>1 only. Based
on the result of Marsaglia and Tsang (2000), the method which is an
improvement of Minh’s algorithm to generate gamma random
variables for all values of shape parameter proposed by Hung, Trang
and Chien(2014) denoted IMGAG algorithm as follows:
(1) If a>1 using Minh’s algorithm with shape a to generate X, go
to step (3);
(2) If 1≥a>0 using Minh’s algorithm with shape a+1 to generate
compute X =
with U∼U(0,1);
(3) Deliver X;
(4) End.
2.3. Proposed Additional Criterion for Evaluating The
Effectiveness of Random Variable Generators
In practice, the evaluation of the effectiveness of a random
variable generator is mainly based on the following criteria: the
complexity and ease to implement of the algorithm. In addition to the
above criteria; Hung, Trang and Chien (2014) proposed additional
criterion to evaluate the effectiveness of different algorithms used to
generate random variables with a specific type of distribution as
follows: using the algorithm to generate the sequence of random
number and evaluating the randomness and the preservation of the
numerical characteristics of the distribution based on the mean,
variance and the skewness of the series of generated data.
2.4. Computer Simulation
2.4.1. Simulation Methods
To generate the gamma random variables, the algorithms were
used: Ahrens (1974) for the case of shape parameter a≤1,
8
Tadikamalla (1978) for the case of shape parameter a>1, IMGAG
(2014) and Marsaglia (2000) for all values of shape parameter a. The
algorithms were implemented in the C language and with the
different values of shape parameter (from 0.1 to 500), uses each
algorithm to generate series of 10,000 gamma random numbers.
Based on the series of generated random numbers, the statistical
parameters: mean value, variance and skewness coefficient computed
by using the formulas (1:10) - (1:12). The correlation coefficient
computed using the formula (1.13).
2.4.2. Experimental Results
From the simulation experiments, the results are given in tables
2.1 - 2.3 and showed in figures 2.1 - 2.3 as follow:
Table 2.1. Mean values of 10,000 generated gamma variables using
algorithms: IMGAG, Marsaglia and Ahrens
IMGAG
a
0.1
0.2
0.3
0.4
0.5
0.6
0.7
0.8
0.9
1.0
1.6
D.gen.
0.099
0.195
0.296
0.390
0.498
0.603
0.693
0.798
0.914
0.984
% Err.
0.78
2.39
1.27
2.57
0.41
0.58
1.04
0.30
1.55
1.60
Marsaglia
D.gen.
0.114
0.230
0.343
0.450
0.564
0.665
0.778
0.867
0.980
1.350
% Err.
14.32
15.02
14.38
12.67
12.79
10.90
11.14
8.43
8.94
35.03
Ahrens
D.gen.
0.098
0.199
0.297
0.394
0.502
0.592
0.700
0.794
0.886
0.995
% Err.
2.13
0.55
1.09
1.54
0.34
1.26
0.00
0.78
1.54
0.53
Eq.(1.2)
IMGAG
Marsaglia
Ahrens
1.1
0.6
𝑎
0.1
0.1 0.2 0.3 0.4 0.5 0.6 0.7 0.8 0.9
1
Figure 2.1: Mean values with shape parameters ≤1
9
Table 2.2. Variances of 10,000 generated gamma variables using
algorithms: IMGAG, Marsaglia and Ahrens
a
0.1
0.2
0.3
0.4
0.5
0.6
0.7
0.8
0.9
1.0
1.6
IMGAG
D.gen.
0.098
0.192
0.273
0.373
0.483
0.604
0.668
0.795
0.937
0.961
Marsaglia
% Err.
1.79
4.18
8.03
6.78
3.42
0.70
4.53
0.64
4.12
3.86
D.gen.
0.094
0.183
0.270
0.346
0.416
0.506
0.562
0.609
0.684
1.351
Ahrens
% Err.
6.44
8.54
10.08
14.89
16.71
15.59
19.74
23.92
23.99
35.06
D.gen.
0.102
0.196
0.290
0.396
0.502
0.578
0.696
0.763
0.872
0.991
% Err.
2.13
2.25
3.34
1.01
0.36
3.67
0.52
4.60
3.09
0.86
Eq. (1.3)
IMGAG
Marsaglia
Ahrens
1.1
0.6
𝑎
0.1
0.1
0.2
0.3
0.4
0.5
0.6
0.7
0.8
0.9
1
Figure 2.2: Variances with shape parameters ≤1
Table 2.3. Skewness coefficients of 10,000 generated gamma
variables using algorithms: IMGAG, Marsaglia and Ahrens
a
Skew
ness
0.1
0.2
0.3
0.4
0.5
0.6
0.7
0.8
0.9
1.0
6.235
4.472
3.651
3.162
2.828
2.582
2.390
2.236
2.108
2.000
IMGAG
S.gen.
6.752
4.633
3.530
3.187
2.898
2.480
2.422
2.283
2.048
2.046
% Err.
6.75
3.36
3.34
0.78
2.45
3.94
1.30
2.10
2.86
2.28
Marsaglia
S.gen.
4.524
2.938
2.429
2.235
1.912
1.872
1.653
1.525
1.393
1.698
% Err.
28.47
34.30
33.47
29.31
32.40
27.51
30.87
31.78
33.93
15.08
Ahrens
S.gen.
6.614
4.363
3.521
3.276
2.840
2.486
2.323
2.074
2.011
1.917
% Err.
4.57
2.44
3.58
3.59
0.42
3.73
2.82
7.24
4.59
4.13
10
8.1
Eq.(1.4)
IMGAG
Marsaglia
Ahrens
6.1
4.1
2.1
𝑎
0.1
0.1
0.2
0.3
0.4
0.5
0.6
0.7
0.8
0.9
1
Figure 2.3: Skewness coefficients with shape parameters ≤1
For shape parameter a>1, using algorithms: IMGAG, Marsaglia,
Tadikamalla and obtained the tables and figures corresponding.
CONCLUSION OF CHAPTER 2
In chapter 2, the author obtained the following results: study of
algorithms used to generate random variables having the unit uniform
distribution, normal distribution, exponential distribution, Poisson
distribution and the gamma distribution. Proposed IMGAG algorithm
to generate the gamma variables with any value of shape parameter
a> 0, and proposed additional criterion to evaluate the effectiveness
of the random variable generators by using computer simulation to
generate series of random numbers, based on the series of generated
data, test the randomness and evaluates the preservation of the
numerical characteristics of the distribution based on the mean,
variance and the skewness of the series of generated data. The details
will be discussed in the conclusions of the dissertation.
CHAPTER 3
COMPUTER SIMULATION OF STREAMFLOWS
WITH GAR(1) PROCESS
This chapter presents the research on the models and the
algorithms are used to simulate the streamflows. The author uses
GAR(1) model, studied Thomas-Fiering model, and, proposed two
models: GAR(1)-Monthly and GAR(1)-Fragments used to simulate
11
the monthly streamflows. By means of computer simulation, the
models and algorithms were tested and evaluated in terms of the
preservation of statistical parameters, including the mean value,
standard deviation and the skewness coefficient of historical data.
3.1. Problem of Streamflow Simulation
Based on historical streamflows observed in the gauging stations,
the streamflow simulation problem is to evaluate the preservation of
the four important descriptors, namely, the mean, standard deviation,
skewness coefficient and the correlation coefficient of each
streamflow sequence by using the model to generate the sequence of
streamflow (monthly or annual) with length of n large enough.
3.2. Thomas-Fiering Model (Th.Fiering)
Based on statistical sample of monthly streamflow of N years (Ncalled statistical sample size) at a gauge station, The basic model of
Thomas-Fiering used to describe the sequence of monthly
streamflow is written as:
(3.1)
(
)
(
)
where
is the monthly streamflow in month j of year i;
is the
regression coefficient for estimating the flow in month j from that in
month j-1;
and
are the mean and standard deviation of the
historical streamflow in month j, respectively; is the correlation
coefficient between historical streamflow sequences in months j and
j-1 and
is a random variable with zero mean and unit variance.
3.3. Method of Fragments
Svanidze [12] presented a method in which the monthly flows are
standardized year by year so that the sum of the monthly flows in any
year equals unity. This is done by dividing the monthly flows in a
year by the corresponding annual flow. By doing so, from a record of
N years, one will have N fragments of twelve monthly flows. The
annual flows obtained from an annual model can be disaggregated by
selecting the fragments at random. Since the monthly parameters
were not preserved well, Srikanthan and McMahon[11] suggested a
12
way to improve this preservation by selecting the appropriate
fragment for each flow in the annual flow series. This was done as
follows: The annual flows from the historical record were ranked
according to increasing magnitude, and N classes were formed. The
first class has the lower limit at zero while class N has no upper limit.
The intermediate class limits are obtained by averaging two
successive annual flows in the ranked series. The corresponding
fragments were then assigned to each class. The annual flows were
then checked one by one for the class to which they belong and
disaggregated using the corresponding fragment.
3.4. Proposed Models Using for Monthly Streamflow Simulation
with GAR(1) Process
3.4.1. Gar(1)-Monthly Model (GAR(1)-M)
The GAR(1) model has been found to be very good for the case
of annual data:
According to the results of Hung, Phien and Chien (2014), for the
case of historical monthly data of N years, each sequence of data of
the same month, say j, of N years long forms a sequence of data in
month j, and the GAR(1) model can be applied to simulate these
monthly data. So the GAR(1)-Monthly model is as follows:
, j = 1..12
(3.2)
where:
is the random variable representing the dependent
processes at time i of month j,
is autoregressive coefficient of
month j and ei is an independent variable to be specified. Each
sequence of dependent gamma variable represents a sequence of data
of same month over years. The system of equations in (3.2)
constitutes a model for use to simulate monthly streamflows.
As the result of Hung, Phien and Chien (2014), in reality, the
correlation coefficient ( ) between monthly flows into consecutive
years may be negative and this may give rise to a negative value of
the autoregressive coefficient ( ), therefore a modification of the
13
correlation coefficient of month j is needed to make the GAR(1)
model applicable:
if
.
Simulation Algorithm:
(1) Initialize and update the array of historical montly A[N][12], N
(the number of years of historical data), n (the number of years of
generated data);
(2) Initialize the array of generated monthly data [n][12];
(3) Using formulas (1.6 ) - (1.13) and biased adjusting of the
estimators to compute 12 sets of parameters a, b, c and of GAR(1)Monthly model (each the set of parameters a, b, c and
corresponding to one series of historical monthly data over the
years);
(4) For j = 1 to 12: if
compute
;
for i = 1 to n: compute
(using GAR(1) model to
generate and compute
);
(5) End.
3.4.2. GAR(1)-Fragments Model (GAR(1)-F)
Hung, Phien and Chien (2014) research and applied GAR(1)
model for monthly flows, the model is obtained by a combination of
the GAR(1) model with the fragments method. From the historical
record of monthly data (of N years long), the historical record of
annual flow with N years, the classes and the fragments are formed.
The annual flow obtained from the GAR(1) model will be
disaggregated to obtain the monthly flow by using the corresponding
fragments. Based on historical record of monthly flow, the GAR(1)fragments model generates monthly flows in the following algorithm:
Simulation Algorithm:
(1) Initialize and update the array of historical montly A[N][12], N
(the number of years of historical data), n (the number of years of
generated data);
(2) Initialize the array of generated monthly data [n][12];
14
(3) Seperate the historical series becomes N classes, each class is one
year of history;
(4) Sort N classes according to increasing magnitude of historical
annual streamflow Ai
(Ai=∑
Ai,j is the monthly streamflow in month j of year
i, after sorting A1 corresponding to smallest annual flow, AN
corresponding to largest annual flow;
(5) Compute the upper bound Ui of two successive classes:
Ui =
, i = 1,2,..N-1. UN has arbitrary large value;
(6) Compute parameters: shape, scale, location and autoregressive
coefficient of GAR(1) model based on the historical annual
streamflow;
(7) Generate a random number X1 has three-parameter gamma
distribution (the parameters were computed as in Step 6);
(8) Select the class has the smallest upper bound is greater than or
equal to X1 (so called ith class);
(9) Compute Q1,j = Mi,j * X1 ,Q1,j is the monthly streamflow in month j
of year 1; Mi,j = Ai,j /Ai , Mi,j is the fragment of historical monthly
streamflow in month j of year i;
(10) Compute Qk,j: k=2,…,n (n: number of years to genarate), use
GAR(1) model to generate ek and compute Xk, k=2,..,n. Select the
class having the smallest upper bound greater than or equal to Xk (so
called ith class), then Qk,,j = Mi,j * Xk;
(11) End.
3.5. Computer Simulation
3.5.1. The Data Used and Simulation Method
Based on the results of chapter 1, using the suitable algorithms
for generating the ramdom variables follow Thomas-Fiering model,
GAR(1)-Monthly model and GAR(1)-Fragments model. The
historical flows (m3/s) at Thanh My gauge station on Vu Gia river,
Nong Son gauge station on Thu Bon river in Quang Nam province
from 1980 to 2010 and Yen Bai gauge station on Thao river in Yen
15
Bai province from 1958 to 2011 were used. The algorithms were
coded in C language. For each model and at each station, a moderate
sample of 1000 years of data was generated on computer using the
referred algorithms.
3.5.2. Emperimental Results
Experimental results are given in tables 3.1 - 3.4 and showed as
figures 3.1 - 3.3:
Table 3.1. Mean values at Nong Son station
Month
History
GAR(1)-M GAR(1)-F
Th.Fiering
1
2
3
4
5
6
7
8
9
10
11
12
1500
248.96
138.21
94.05
76.45
107.30
94.54
70.33
85.02
195.59
697.19
1041.81
619.97
245.40
137.85
93.01
76.84
106.38
94.15
71.44
85.60
195.30
705.26
1039.30
622.19
220.25
136.53
94.06
66.42
97.66
93.68
74.95
91.32
174.61
778.81
1074.54
559.19
267.63
147.64
101.39
87.16
121.01
101.73
74.84
93.60
94.19
754.37
1116.12
659.08
m3/s
Historical Data
GAR(1)-M
1000
GAR(1)-F
THOMAS-FIERING
500
0
Month
1
2
3
4
5
6
7
8
9 10 11 12
Figure 3.1: Mean values at Nong Son station
Table 3.2. Standard deviations at Nong Son station
Month
History
GAR(1)-M
GAR(1)-F
Th.Fiering
1
2
110.97
46.07
104.54
45.50
87.42
37.07
79.22
34.23
16
3
4
5
6
7
8
9
10
11
12
m3/s
600
500
400
300
200
100
0
1 2
33.30
39.32
60.89
39.63
25.65
48.82
174.70
354.16
549.65
329.72
32.67
40.82
63.72
38.2
26.07
49.52
178.68
376.42
544.42
334.52
30.37
34.25
53.22
32.01
29.32
71.14
88.39
438.79
534.59
311.34
24.61
29.29
45.05
29.01
19.35
36.02
18.56
244.56
401.98
235.41
Historical Data
GAR(1)-M
GAR(1)-F
THOMAS-FIERING
Month
3
4
5
6
7
8
9 10 11 12
Figure 3.2: Standard deviations at Nong Son station
Table 3.3. Skewness coefficients at Nong Son station
Month
1
2
3
4
5
6
7
8
9
10
11
12
History
1.54
1.09
0.87
1.70
0.79
0.77
0.47
1.55
3.08
0.23
0.68
0.84
GAR(1)-M
1.53
1.23
1.20
1.98
1.00
0.80
0.64
1.76
5.17
-0.01
0.66
1.12
GAR(1)-F
1.51
0.95
0.73
2.18
0.78
0.93
1.32
3.44
2.32
-0.12
1.66
0.96
Th.Fiering
0.67
0.57
0.43
0.48
0.35
0.34
0.22
0.62
1.73
0.22
0.42
0.55
17
6
Historical Data
GAR(1)-M
4
GAR(1)-F
2
THOMAS-FIERING
0
Month
1
2
3
4
5
6
7
8
9
10 11 12
-2
Figure 3.3: Skewness coefficients at Nong Son station
Table 3.4. Statistical parameters of annual data at Nong Son station
Parameters
History
GAR(1)-M
GAR(1)-F
Th.Fiering
Mean
3469.72
3454.17
3467.92
3588.66
Stand. Deviation
1030.77
729.03
1025.29
664.64
0.76
0.32
0.78
0.08
Skewness
Similarly at the Thanh My and Yen Bai gauge stations, the author
obtained the tables and figures corresponding also.
CONCLUSION OF CHAPTER 3
In chapter 3, the author obtained the following results: proposed
the GAR(1)-Monthly and GAR(1)-Fragments models using for
computer simulation of monthly streamflows. By computer
simulation, the statistical descriptors such as the mean, standard
deviation and the skewness coefficient obtained from generated
monthly data by the GAR(1)-Monthly model are closer to their
historical values than those obtained by the GAR(1)-Fragments and
Thomas-Fiering models.
CHAPTER 4
THE MEAN RANGE OF RESERVOIR STORAGE
WITH GAR(1) PROCESS
The contents of this chapter presents the study of reservoir
storage problem. By theoretical analysis, the author obtained the
closed forms of the expectation and the variance of the sum of
GAR(1) variables. Combining the approximate formula of Phien
18
(1978) and the obtained closed form of the variance of the sum of
GAR(1) variables, and from that, the author proposed the
approximate expression for the mean range of reservoir storage with
GAR(1) inflows. By computer simulation of GAR(1) model to
generate the annual inflows, and the mean range of reservoir storage
were obtained with the different of parameters and were compared
with that results obtained from the approximate expression.
4.1. The Storage of Reservoir
4.1.1. General Storage Equation of Reservoir
Let { } be a sequence of random variables with ( ) = 0 then
the cumulative or partial sum, , the maximum partial sum or
surplus,
, the minimum partial sum or deficit,
, and the range,
, of the cumulative sums are defined respectively as
(4.1)
(
)
(4.2)
(
)
(4.3)
(4.4)
it is clear that
and ( )= 0.
4.1.2. The Mean Range with Independent Inflows
The range has been investigated with assuming that the inflows
( ) discharges to the reservoir are distributed as independent
variables. In order to avoid the dependent of range on each
distribution type, a new variable is introduced. This is done by
standardizing :
where
is the standard deviation of . It is clear that the
standardized variable has zero mean and unit variance.
19
With the introduction of this new variable , then if ( ) and
( ) are the expected values of range corresponding to z and ,
respectively, then
( )
( )
By using the multivariate normal distribution function, Salas-La
Cruz(1972) showed that the mean range of reservoir storage is as
follows:
(
)
√ ∑
( )
For the case of independent gamma variable , the skewness
coefficient should be taken into account as in the work of
Phien(1978), then the approximate formula of the mean range is
therefore expressed as a function of n and skewness :
(
)
√ ∑
( )
(
)
(4.5)
4.2. The Basic Numerical Characteristics of The Sum of GAR(1)
variables
The random variable
of GAR(1) model is expressed as
follows:
Then the sum of n GAR(1) variables is a random variable,
denoted
is computed by the equation in the following:
∑
where: , i = 1, 2, …, n are GAR(1) variables.
By theoretical analysis, Hung and Chien (2013) obtained the
closed forms of the basic numerical characteristics, namely the
expectation and the variance of the sum of GAR(1) variables with
one-parameter are as follow :
The expectation of the sum of GAR(1) variables denoted as
( ), and ( )
.
20
The variance of the sum of GAR(1) variables denoted as Var(Sn),
( )
∑ (
)
and
(4.6)
4.3. Approximate Expression for The Mean Range
The range to be investigated here is that of the cumulative sums:
∑
∑
(
)
in which is the fluctuation
of
around its long-term mean
, and
is a dependent gamma variable and follows the GAR(1)
model:
Following the work of Phien (1978), the skewness coefficient is
taken into account and the closed form of the variance of the sum of
GAR(1) variables obtained by Hung and Chien (2013). Substituting
Eq. (4.6) for the variance of the sum of GAR(1) variables into Eq.
(4.5) the following approximate expression for the mean range is
obtained for standardized variables:
(
)
√ ∑
[
∑
(
)
]
(
)
(4.7)
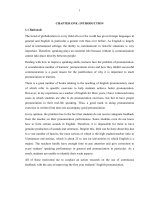
4.4. Computer Simulation
4.4.1. The Data Used and Simulation Method
For each value of the skewness coefficient of the gamma
distribution and each value of the autoregressive coefficient of the
GAR(1) model, a sample of 100,000 GAR(1) variables were
generated. Each generated sequence of 50 values is used to compute
the range of the reservoir with a life time of 50 years long. Similarly,
for reservoirs with shorter life time of N years (N<50), each sequence
of N values is used to compute the corresponding value of range.
These computed values of the range are then treated as generated
data for the range in the simulation study. In these experiments, the
skewness coefficient has values in the range [0.5, 3.0] which is valid
for most actual data. Using the approximate expression (Eq. 27) and
21
the generated data for the range, the mean ranges were then
computed at different values of n, and .
4.4.2. Experimental results
The results are given in table 4.1 and as figure 4.1:
Table 4.1. Values of the mean range with autoregressive coefficient
and skewness coefficient
l year
5
10
15
20
25
30
35
40
45
50
Mean range of reservoir storage computed by
Eq. (4.7)
Generated data
% Err.
3.225
3.197
0.875
5.663
5.624
0.693
7.688
7.635
0.694
9.452
9.380
0.767
11.034
10.945
0.813
12.482
12.392
0.726
13.823
13.727
0.699
15.079
14.979
0.667
16.264
16.152
0.693
17.389
17.265
0.718
16
14
12
10
8
6
4
2
0
Eq. (4.7)
Generated Data
Year
0
5 10 15 20 25 30 35 40 45 50
Figure 4.1: Autore. coeff.
and skew. coeff.
Similarly, the author obtained the tables and figures with
different autoregressive coefficients
in the range [0.5, 3.0] and
skewness coefficient in the range [ 0.2, 0.8] corresponding also.
22
CONCLUSION OF CHAPTER 4
In chapter 4, the obtained results are as follow: By theoretical
analysis, a closed form formula for the variance of the sum of
GAR(1) variables was derived. This formula is then used along with
the empirical formula of Phien (1978) to obtain an approximate
expression for the mean value of the reservoir storage. The results
computed from the approximate expression can be compared very
well with those obtained from generated data.
DISSERTATION CONCLUSIONS
1. The obtained results
From the study of the chapters: The general problems, algorithms
to generate GAR(1) variables, computer simulation of streamflows
with GAR(1) process and the mean range of reservoir storage with
GAR(1) ) process presented in the dissertation, the results are:
1.1. Theoretically
- Proposed a algorithm which is the improvement of the
algorithm of Minh (1988), namely IMGAG algorithm for generating
independent random variables having gamma distribution with all
values of shape parameter a>0. Proposed additional criterion to
evaluate the effectiveness of a random variable generator by using
computer simulation to generate the series of random numbers, and,
tests the randomness and considers the preservation of the numerical
characteristics of the distribution based on the mean, variance and the
skewness of the series of generated data.
- Proposed models: GAR(1)-Monthly and GAR(1)-Fragments
using for monthly streamflow simulation.
- Theoretical analysis and derived the closed forms of the
expectation and the variance of the sum of GAR(1) variables. Based
on the closed form of variance of the sum of GAR(1) variables,
23
combining with the closed form proposed by Salas-La Cruz (1972)
and the empirical formula suggested by Phien (1978), the author
obtained an approximate expression for the mean range of reservoir
storage with GAR(1) inflows.
1.2. Computer Simulation
- For the case of shape parameter a<1: The simulation study
showed that the numerical characteristics, namely the expectation,
variance and the skewness coefficient of the gamma distribution were
preserved very well by the IMGAG algorithm and the AHRENS
algorithm, much better than those by the MARSAGLIA algorithm.
For the case of shape a: 1
gamma distribution much better than those by the MARSAGLIA
algorithm.
- The mean value and the standard deviation of the historical
sequences were preserved very well by three models under
consideration (GAR(1)-Monthly, GAR(1)-Fragments, ThomasFiering), whereas the GAR(1)-Fragments and Thomas-Fiering
models do not preserve the skewness coefficient well.
- The mean, standard deviation and the skewness coefficient
obtained from generated monthly data by the GAR(1)-Monthly
model are closer to their historical values than those obtained by the
GAR(1)-Fragments and Thomas-Fiering models.
- In this study, annual data were obtained from generated
monthly data by taking the sum of twelve monthly values in a year.
Then the mean, standard deviation and the skewness coefficient can
be calculated. It was found that these statistical descriptors can be
reproduced very well by the GAR(1)-Fragments model, much better
than those by the GAR(1)-Monthly and Thomas-Fiering models.
- The mean range computed from the approximate expression is
very close to that obtained from the computer. Therefore, this