A kinetic study on extraction and transformation phenomena of phenolic compounds during red wine fermentation
Bạn đang xem bản rút gọn của tài liệu. Xem và tải ngay bản đầy đủ của tài liệu tại đây (6.73 MB, 244 trang )
International Journal of Food Science and Technology 2010, 45, 1965–1972
Original article
Development of a fortified peanut-based infant formula for
recovery of severely malnourished children
Nimsate Kane,1 Mohamed Ahmedna2* & Jianmei Yu2
1 Institut de Technologie Alimentaire, Route des Pe´res Maristes - Dakar Hann, Senegal
2 Food and Nutritional Sciences, North Carolina A&T State University, 1601 East Market Street, Greensboro, Greensboro, NC 27410, USA
(Received 3 December 2009; Accepted in revised form 4 June 2010)
Summary
A peanut milk-based infant formula was developed from peanuts. The effects of extraction pH and
temperature on the yield and protein content of spray-dried peanut milk were evaluated. Peanut-based infant
formulas (PBIF-75) was developed using spray-dried peanut milk and a premix of vitamins and minerals.
Physical properties, approximate composition, minerals, vitamins and amino acid composition, and caloric
value of PBIF-75 were evaluated and compared to those of soya-based infant formula (SBIF) and World
Health Organization (WHO) F-75. Spray-dried peanut milk yield was 15–18% with a protein content of
30–45%, depending on the extraction pH and temperature. PBIF-75 was nearly identical to WHO F-75 in
terms of amino acid profile, most vitamins and minerals, proximate composition, caloric value, and
physicochemical characteristics such as water activity and colour. However, few of the vitamins and minerals
in PBIF-75 will require further adjustment to fully meet WHO’s requirements of a recovery formula for
undernourished infants.
Keywords
Infant formula, malnutrition, nutritional composition, nutritional recovery, peanut milk.
Introduction
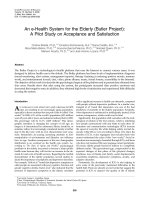
Malnutrition represents the direct cause of about
300 000 child deaths per year in developing countries
(Black et al., 2003; Muller et al., 2003). The incidence of
stunting in some African countries is very high among
children, reaching 50% in some areas (Enwonwo et al.,
2004). The most common form of malnutrition encountered in African countries is severe malnutrition (PEM),
which is attributed to the lack of protein rich foods such
as meat and dairy products, and the low buying power
of people. Internationally, the World Health Organization (WHO) has recommended the F-75 and F-100
(fortified-high-energy milk containing 75 or 100 Kcal,
respectively) formula for the treatment of severely
malnourished children. The F-75 and F-100 consists of
dried-skim milk, sugar, oil, as well as vitamins, and
mineral supplements. The F-75 differs from F-100 in
that it contains dextrin maltose and cooked rice or corn
flour. The F-75 is given to children at the beginning of
nutritional recovery regimen to cover their basic needs
in protein and energy. After the initial recovery using
F-75, F-100 is administrated for promotion of weight
gain (Briend, 2003). It is important to note that these
*Correspondent: Fax: +336 334 7239;
e-mail:
WHO-recommended formulas do not contain iron
because severely undernourished children are known
to have an excess of iron, which leads to a higher rate of
death in this group (Ramdath & Golden, 1989). Iron
supplementation is, therefore, only recommended after
the children have recovered from severe nutritional
deficiency. The F-75 and the F-100 formulas have been
tested in many areas in Senegal and around the world
and their efficacy in promoting weight gain has been
proven. F-75 and F-100 have, however, some limitations. They can be used only in recovery centres with
strict nutritional and medical supervision to control the
quality of the formula as to prevent microbial contamination that may harm the children (Briend, 2003). For
more convenience, F-100 formula has been replaced by
a solid formula made of peanut butter and skim milk.
The product is made up of 30% peanut butter, 20%
skim milk, 28% sugars, 20% vegetable oil, and 2%
vitamin and mineral supplement. This new formula has
been successfully tested in Senegal with a reported
weight gain significantly higher than that of F-100 (Diop
et al., 2003). Another advantage of this solid formula is
that it can be used at home without nutritional or
medical supervision. Furthermore, the risk of contamination is reduced because the product is dry enough to
prevent microorganism growth and the formulation is
consumed without mixing with water. Because of its
doi:10.1111/j.1365-2621.2010.02330.x
Ó 2010 The Authors. International Journal of Food Science and Technology Ó 2010 Institute of Food Science and Technology
1965
1966
Fortified peanut-based infant formula N. Kane et al.
convenience, this formulation has been produced commercially by Plumpynut, Nutriset, and Malaunay
France for emergency child nutritional recovery
throughout the world (Briend, 2003).
Peanut (Arachis hypogeae) is a legume widely grown
and is abundant in some African countries such as
Senegal. It contains 26% of protein, 49.5% of lipids,
and about 16% of carbohydrates of which 9% is dietary
fibre (Khalil & Chunghtai, 1983). Therefore, peanut is a
good source of protein and energy. Peanut protein
contains all essential amino acids that are indispensable
for health maintenance, although methionine, cystine,
and tryptophan are in relatively low amount (Kholief,
1987). Among plant proteins, the essential amino acids
content of peanut protein is relatively high (Ahmed &
Young, 1982; Andersen et al., 1998). Depending on the
variety, peanut oil contains 54–82% of monounsaturated fatty acid and 4.6–28.4% polyunsaturated fatty
acids, and a low level of saturated fats (Andersen et al.,
1998). Such a desirable fat profile is known to lowers
LDL cholesterol, total cholesterol, and triglycerides that
are associated with heart disease, diabetes, and obesity
(Kris-Etherton, 1999; The Peanut Institute, 2005).
The high nutritional value of peanut has made it one
of the most important crops in the developing world.
Peanut has the potential to be used as raw material for
peanut-based milk. While soya milk has gained increasing popularity worldwide, the consumption of peanut
milk is limited, particularly, in the developed countries,
because of peanut allergy issue and unpleasant beany
flavour (Lee & Beuchat, 1992). In developing countries,
however, peanut allergy is uncommon and consumers
are familiar with and actually like the beany flavour of
peanuts. Therefore, peanut milk may represent a nutritionally balanced beverage that can be used as a
substitute of milk in areas where dairy products are
scarce and ⁄ or prohibitively expensive (Schmidt et al.,
1980; Rubico et al., 1987; Lee & Beuchat, 1992). The
most recent body of knowledge on peanut milk includes
studies in the 1990s on the use of peanut milk as
buttermilk for the preparation of salad dressing (Lee &
Beuchat, 1991) and in the formulation of coffee whitener
(Abdullah et al., 1993). In other studies, chocolateflavoured and strawberry-flavoured peanut milk processed in a pilot plant was UHT-sterilised and studied
for shelf stability (Ismail et al., 1995, 1996).
Traditionally, oriental consumers have used mild
alkali such as sodium bicarbonate (NaHCO3) to
improve the flavour and mouth feel of common dry
beans (Bourne et al., 1976). Similar process (e.g. sodium
bicarbonate soaking) can be used in the preparation of
peanut milk with reduced beany flavour. The production
of spray-dried peanut milk may represent a new valueadded use of peanut while addressing the nutritional
needs of undernourished children. The objectives of this
study are to (i) investigate the combined effect of pH and
International Journal of Food Science and Technology 2010
temperature on the yield and protein content of dry
powdered peanut milk and, (ii) using powered peanut
milk to develop a shelf-stable infant formula that meets
the nutritional requirement of the WHO F-75 formula
for the recovery of malnourished children.
Materials and methods
Preparation of peanut milk
Peanut kernels (Virginia type) purchased from Good
Earth Peanuts, Inc. (Skippers, Virginia, USA) were used
in peanut milk production. Peanut milk was prepared
following a modified procedure of Lee & Beuchat
(1992). Peanuts were visually inspected to remove
discoloured kernels that might be moulded or potentially contaminated with aflatoxin. Screened peanut
kernels were then rinsed with water to remove any
aflatoxin residues on the surface of kernels. Peanut
kernels were then soaked overnight in a 0.5% NaHCO3
solution at a kernel to solution ratio of 1:2. Water was
then drained, and peanuts were washed with tap water
then mixed with water at a kernel to water ratio of 1:5 as
described by Abdullah et al. (1993). The kernel ⁄ water
mixtures were allowed to soak for 5 min at treatment
temperatures of 25, 50, and 100 °C before they were
ground using an Oster-14 speed blender (Blue Chill,
Inc., Boca Raton, FL, USA). The resulting slurry was
first filtered using a double layer of cheese cloth,
followed by filtration through a Whatman No. 1 filter
paper. The resulting peanut milk was then homogenised
for 10 min using a Brinkman PT 2100 Polytron
homogenizer (Westbury, NY, USA). The pH of peanut
milk was adjusted with NaOH (0.1N) or HCl (0.1N) to
the desired value (6, 7, and 8). A BU¨CHI Mini Spray
Dryer B-191 (Westbury, NY, USA) was used to dry
aqueous peanut milk. The spray drying parameters such
as temperature, aspiration, and flow rate were set at
130 °C, 84%, and 7%, respectively.
Formulation of peanut-based infant formula simulating
WHO F-75
Peanut-based infant formula (PBIF) was developed
using 5 ingredients: dry peanut milk extracted from
whole peanut kernels, confectionary sugar, vegetable oil
and corn starch, and a micronutrient premix (composed
of 9 water-soluble vitamins, 4 fat-soluble vitamins, and
seven minerals). The latter was custom-formulated by
Fortitech (Schenectady, New York, USA). The detailed
composition of the micronutrient premix used to fortify
peanut milk is shown in Table 1. An adequate amount
of spray-dried peanut milk was mixed with the appropriate amount of carbohydrates and micronutrient
premix to mimic the composition of WHO F-75.
Specifically, the PBIF-75 formula contained 24 g of
Ó 2010 The Authors
International Journal of Food Science and Technology Ó 2010 Institute of Food Science and Technology
Fortified peanut-based infant formula N. Kane et al.
Table 1 Composition of premix used in fortification of peanut-based
infant Formula*
Components
Level ⁄ 5.2 g Mix
% RDI
Vitamin A (as Palmitate, USP-FCC)
Vitamin D3 (as Cholecalciferol, USP-FCC)
Vitamin E (as acetate, USP-FCC)
Biotin (USP)
Folic Acid (USP)
Niacin (as Niacinamide, USP-FCC)
Pantothenic Acid (as D-Calcium
Pantothenate, USP)
Vitamin B1 (as Thiamin Mononitrate,
USP-FCC)
Vitamin B12 (as Cyanocobalamin, USP)
Vitamin B2 (as Riboflavin, USP-FCC)
Vitamin B6 (as Pyridoxine HCl, USP)
Vitamin C (as Ascorbic Acid, USP-FCC)
Vitamin K1 (as Phytonadione, USP)
Calcium (as Tricalcium Phosphate, FCC)
Copper (as Copper Amino Acid Chelate
(Cu 10%))
Iodine (as Potassium Iodide, USP-FCC)
Magnesium (as Magnesium Oxide, USP)
Phosphorous (as Dipotassium Phosphate,
anhy., FCC)
& (Tricalcium Phosphate, FCC)
Potassium (as Dipotassium Phosphate,
anhy., FCC)
Selenium (as Sodium Selenite)
Sodium (as Sodium Chloride, FCC)
Zinc (as Zinc Oxide, USP)
5000 IU
1200 IU
22 IU
0.1 mg
0.35 mg
10 mg
3 mg
15.0
15.0
15.0
20.0
20.0
15.0
15.0
0.7 mg
15.0
1 mcg
2 mg
0.7 mg
100 mg
40 mcg
317.4 mg
2.7 mg
20.0
15.0
15.0
15.0
15.0
7.0
10.0
77 mcg
90.7 mg
750 mg
10.0
7.0
7.0
1539 mg
7.0
47 mcg
42 mg
20.3 mg
10.0
7.0
10.0
PBIF-75 = Peanut-Based Infant Formula mimicking the World Health
Organization (WHO) F-75 formula for nutritional recovery of malnourished children.
*Values are actual specifications certified by Fortitech (Schenectady,
New York, USA), the manufacturer of the premix.
dry full fat peanut milk, 60 g of sucrose, 12.5 g of corn
starch, and 3.5 g of micronutrient premix. These ingredients were mixed thoroughly to ensure the uniformity
of ingredients within the dry powder matrix. The
peanut-based infant formula was analysed for physicochemical properties and proximate composition. Soyabased infant formula ‘‘Isomil’’ was used as reference for
the physicochemical characteristics, and F-75 formula
were used as references for the desired target nutritional
values.
Measurement of physical properties
The physical properties including water activity and
spectral properties (Hunter’s L-, a- and b-colour scale
value) of peanut milk powder and PBIF-75 were
determined using a Minolta CM-3500d Spectrophotometer (Ramsey, new Jersey, USA) and an Aqua Lab
Water activity-meter (Pullman, Washington, USA),
respectively. Nonfat dry cow milk (Nestle) and a soyabased infant formula (SBIF) were evaluated for the
same physical properties and used as references.
Proximate composition analysis of dry peanut milks and
PBIF-75
Crude protein was analysed using a Truspec CN
Elemental Analyzer (LECO Corporation, Warrendale,
PA, USA) and a conversion factor of 6. 25. The total
fat ⁄ lipid was determined using a Sotex Avanti 2050
automated fat analyzer (Foss, Hoganas, Sweden).
Briefly, 2 g of spray-dried PEANUT MILK were
extracted with 85 mL of petroleum ether (Fisher Scientific, New Jersey, USA) at 155 °C for 73 min. The
difference in weight of the extraction cups before and
after lipid extraction served as a measure of the lipid
content of each sample. The moisture was determined
using a HG63 Mettler-Toledo Moisture Analyzer (Greifensee, Switzerland). The ash content was determined
according to AOAC method 923.03 (AOAC, 2003)
using a 30400 Fisher Scientific Furnace, while the
carbohydrate contents of samples were determined by
difference.
Mineral quantification
The mineral content was determined using an Optima
3300 ICP (Perkin Elmer, Norwalk, CT, USA). Samples
of 0.25 g PBIF were digested in 10 mL of HNO3 and
2 mL of hydrogen peroxide in a Marsx microwave oven
(Matthews, NC, USA) for 25 min at 210 °C. The
digested samples were analysed by ICP along with
standard mineral references. The run time for the
quantification of minerals was 30 min, at an operating
temperature of 210 °C. Concentrations of minerals in
peanut milk samples were calculated using standard
curves developed using known concentrations of each
test mineral.
Determination of vitamins in peanut milk and PBIF-75
The extraction of water-soluble vitamins was performed
with distilled water and that of fat-soluble vitamins with
hexane. The low detection limit of certain vitamins did
not allow all the vitamins to appear in the same
chromatogram. Thus, different methods were used to
quantify vitamins in peanut-based infant formula,
separately. Specifically, Vitamins A and E were determined by the method of DeVries & Silvera (2002);
vitamin C was determined by method of Deutsch &
Weeks (1965); vitamin D was determined by AOAC
method 2002.05; vitamins B1, B2, B6, pantothenic acid,
and niacin were determined by AOAC methods 942.23,
970.65 ⁄ 981.15, 961.15, 945.74 ⁄ 960.46, and 944.13,
respectively (AOAC, 2000). Folic acid was determined
Ó 2010 The Authors
International Journal of Food Science and Technology Ó 2010 Institute of Food Science and Technology
International Journal of Food Science and Technology 2010
1967
Fortified peanut-based infant formula N. Kane et al.
Determination of amino acid profile of PBIF-75
Amino acids such as Alanine, Arginine, Aspartic
Acid, Cystine, Glutamic Acid, Glycine, Histidine,
Isoleucine, Leucine, Lysine, Methionine, Phenylalanine,
Proline, Serine, Threonine, and Valine were determination by AOAC method 994.12 (AOAC 2003). Tryptophan and Tyrosine were determined by AOAC method
982.30 (AOAC, 2000).
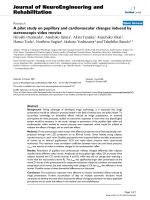
(a) 25
Dry milk yield (%)
by the method of Phillips et al. (2006); biotin was
determined by a microbiology method described by
Augustin et al. (1985).
25 °C
50 °C
100 °C
20
15
10
5
0
6
7
Extraction pH
8
(b) 60
25 °C
50 °C
100 °C
50
Statistical analysis
Data was analysed statistically using SAS software
Version 8 (SAS Institute; Cary, NC, USA). Means and
standard deviations of replicated data (3–5 replications)
were used in summary statistics. Analysis of variance
and t-test were used to evaluate significance of difference
between means for conditions used in peanut milk
extraction and between PBIF-75 and WHO F-75 infant
formula, respectively. Differences between means were
judged significant at the 5% significance level.
Results and discussions
Effect of extraction pH and temperature on peanut milk
yield and protein content
Figure 1 shows that the highest dry milk yield (17.49%
w ⁄ w) was obtained at room temperature and native pH
(pH 7.0). Statistical analysis indicated that there was no
significant difference in yield among dry milk extracted
at different pH–temperature conditions. Therefore, the
yield of dry peanut milk was not significantly affected by
the processing conditions used in this study. However,
room temperature extraction is advantageous given the
relatively high yield and saving of energy ⁄ time required
for heated extraction. Figure 1 also shows higher
extraction temperature and pH yielded peanut milk
powder with higher protein content (46.2%, at 100 °C
and pH 8). This is contrary to the results reported by
Lee & Beuchat (1992) who found that the protein
content in aqueous peanut milk decreased significantly
as the temperature increased. The high protein content
reported in this paper may be explained by discarding of
fat layer that formed in heated sample. The latter would
have reduced relative concentration of protein in the
extract prior to spray drying. Overall, peanut milk
powders produced at all temperature–pH combinations
used in this study had higher protein content than
nonfat dry milk (33.4%) and milk powder made from
cowpea (22.8–26.8%) as reported by Akinyele & Abudu
(1990). Considering yield and potential production cost,
International Journal of Food Science and Technology 2010
Protein (%)
1968
40
30
20
10
0
6
7
Extraction pH
8
Figure 1 Total yield (a) and protein content (b) of spray-dried peanut
milk from full fat peanuts as affected by extraction pH and
temperature. PBIF-75 = Peanut-Based Infant Formula mimicking the
World Health Organization (WHO) F-75 formula for nutritional
recovery of malnourished children.
room temperature and native pH were selected as the
potentially most cost effective conditions to prepare
peanut milk powder for use in infant formulas.
Physical properties of peanut milk and PBIF-75
The physical properties of dry peanut milk and peanutbased infant formula (PBIF-75) were evaluated and
compared to Nestle’s nonfat dry milk and soya-based
infant formula (SBIF), respectively (Table 2). As shown
in Table 2, the water activity of dry peanut-based milk
was slightly higher than that of Nestle’s nonfat dry milk.
However, change in spray drying parameters should
enable adjustment of the final moisture level in peanut
milk to the desired value. Peanut milk showed whiteness
(L-values) similar to that of the commercial cow milk
sample. Furthermore, there was no significant difference
in a-values between peanut-based milk and the references of dry cow milk. The negative a-values of peanutbased milk indicate a slight greenish colour of peanut
milk consistent with the study of Lee & Beuchat (1992).
The b-values indicated that the reference cow milk tend
to be more yellowish than peanut milk. These optical
characteristics indicate that the colour and appearance
of peanut-based milk would be highly acceptable given
its close similarity to that of dried cow milk.
Ó 2010 The Authors
International Journal of Food Science and Technology Ó 2010 Institute of Food Science and Technology
Fortified peanut-based infant formula N. Kane et al.
Table 2 Physical ⁄ spectral properties of peanut milk powder and
peanut-based infant formula (PBIF-75) in comparison with Nestle’s
nonfat dry milk and Soya-based Infant formula (SBIF)
Milk bases*
Physical
properties
Formulas*
Full fat
peanut
milk
Nestle
nonfat
dry milk
a
Water activity 0.61 ± 0.02
0.49 ±
L-value
85.15 ± 0.62a 87.7 ±
a-value
)0.64 ± 0.05a )1.95 ±
b-value
10.11 ± 0.74a 15.5 ±
PBIF-75
b
0.01
1.03a
0.2b
0.7b
0.382
82.58
)0.77
14.18
±
±
±
±
SBIF
a
0.005
0.352a
0.075a
0.176a
0.318
83.34
)0.40
18.47
±
±
±
±
0.007b
0.834a
0.032b
0.155b
*Product property means with different superscript are significantly
different at 5% significance level.
PBIF-75 = Peanut-Based Infant Formula mimicking the World Health
Organization (WHO) F-75 formula for nutritional recovery of malnourished children.
The physical properties of PBIF-75 were evaluated
and compared to those of commercial soya-based infant
formula (SBIF) used as reference (Table 2). The water
activity and L-value of PBIF-75 were identical to those
of SBIF. PBIF-75 had a slightly higher negative a-value
but a lower b-value than SBIF. This difference was
easily noticeable because of the pronounced yellow
colour of SBIF. Overall, the colour characteristics of
PBIF-75 compared favourably to those of SBIF and in
some cases PBIF displayed better colour (less yellowness) characteristics than the commercial SBIF.
Proximate composition of peanut milk powder and infant
formula PBIF
Peanut milk had similar protein and moisture contents
to nonfat dry milk, significantly higher fat content, and
lower ash and carbohydrate contents (Table 3). However, as expected, the fat and carbohydrate contents of
peanut milk were significantly higher and lower, respectively, than nonfat dry milk because of the defatting and
high lactose level in the latter. Powered peanut milk
exhibited lower ash content than nonfat dry milk
because of the richness of milk in minerals such as
calcium. However, the low mineral and carbohydrate
content of dry peanut milk can be easily compensated
through mineral and carbohydrate fortification. Peanutbased milk offers advantage of being both protein and
energy rich, and therefore, has the potential to respond
to the protein and energy needs of children in Senegal
and other areas where animal proteins and dairy
products are scarce. Following fortification, the protein
and ash contents of the peanut-based infant formula
(PBIF-75) were significantly higher than those of WHO75, while fat and moisture content were same as that of
WHO-75 (Table 3). Only carbohydrates were slightly
lower in PBIF-75, a deficiency that can be corrected
through adjustment of carbohydrates in the fortification
mix.
Mineral content of peanut-based infant formula (PBIF-75)
The mineral contents of dry full fat peanut milk,
PBIF-75 and reference WHO F-75 are included in
Table 4. Peanut milk base exhibited very low Ca, Cu,
and Zn contents but relatively high K, Mg, Na, and P
contents. Following fortification, minerals such as Ca,
Mg, and P were present in PBIF at levels higher than
those of WHO’s F-75, while K and Zn were lower than
the requirements of F-75. The Na levels in the two
formulas were identical. While potassium (K) was high
in the micronutrient premix (Table 1), it was low in
PBIF-75 (Table 4) where its final concentration in
PBIF-75 was lower than WHO’s target. This observed
deficiency might be caused by an incomplete extraction
of K from PBIF-75 and ⁄ or an analytical underestimation. Our data also shows that phosphate (P) content in
Table 3 Proximate composition of dry peanut milk powder and PBIF-75
Milk powders*
Infant formulas†
Components
Peanut milk
Nestle
Protein (%)
Moisture (%)
Fat (%)
Ash (%)
Carbohydrates (%)
33.8 ±
6.00 ±
33.5 ±
2.4 ±
24.00
0.07a
2.50a
2.17a
0.17a
33.5 ±
5.30 ±
2.1 ±
7.3 ±
51.00
PBIF-75§
0.2a
2.50a
1.2b
0a
8±
3.16 ±
13 ±
5.64 ±
70.20a
0.016a
0.069a
0.577a
0.07a
WHO F-75
Differenceà
5.53b
2.50b
12.3a
3.13b
82.00b
2.47
0.66
0.7
2.53
)11.80
PBIF-75 = Peanut-Based Infant Formula mimicking the World Health Organization (WHO) F-75 formula for nutritional recovery of malnourished
children.
*Means with different superscripts are significantly different at 5% significance level.
†
Values for WHO F-75 have no standard deviations as these are specification data.
à
PBIF-75 = peanut-based infant formula designed to simulate WHO therapeutic milk formula F-75 used for recovery of severely malnourished children.
§
The positive difference indicates excess of nutrients of PBIF-75, while the negative difference indicate deficit in PBIF-75 compared to WHO F-75.
Ó 2010 The Authors
International Journal of Food Science and Technology Ó 2010 Institute of Food Science and Technology
International Journal of Food Science and Technology 2010
1969
1970
Fortified peanut-based infant formula N. Kane et al.
Table 4 Mineral contents of peanut milk, PBIF-75 compared to that of
WHO F-75
Table 5 Vitamin content of peanut milk and PBIF-75 compared to
that of WHO F-75*
Samples*
Infant formula
Vitamins content ⁄ 100 g
Peanut
milk
PBIF-75
WHO F-75
Difference†
(PBIF-75
–WHO F-75)
Vitamin A Retinol (IU)
Vitamin C (mg)
Vitamin E (IU)
Vitamin B1 (mg)
Vitamin B2 (mg)
Vitamin B6 (mg)
Folic acid (lg)
Vitamin B12 (lg)
Biotin (lg)
Panthotenic acid (mg)
Niacin (mg)
Vitamin D3 (IU)
Vitamin K1 (lg)
<100
<1.00
<0.100
0.270
0.130
0.140
29.10
<0.100
38.90
0.880
7.60
99.10
<10.0
1530
57.0
14.9
0.69
1.27
1.02
287
0.42
75.2
3.19
26.9
730
<10.0
3125
62.5
13.75
0.437
1.25
0.437
218
0.625
22
1.875
6.25
750
25
)1595
)5.5
1.15
0.253
0.02
0.583
69
)0.205
53.2
1.315
20.65
)20
15
†
Minerals
(mg ⁄ 100 g)
Peanut
milk
PBIF-75à
WHO
F-75à
Difference
(PBIF-75 – F75)
Ca
Cu
K
Mg
Na
P
Zn
38.6
0.733
559.3
217.7
122.6
444.4
3.2
300a
2.22a
120a
130a
80a
170a
13.1a
198b
1.72b
966b
64b
80a
147s
40.6b
102
0.5
)846
66
0
23
)27.5
PBIF-75 = Peanut-Based Infant Formula mimicking the World Health
Organization (WHO) F-75 formula for nutritional recovery of malnourished children.
*
Data are means concentrations of minerals with standard deviation
<10% mean values. Values for WHO F-75 are single values obtained from
specification sheet.
†
The positive differences indicate excess of mineral in PBIF-75, while
negative difference indicate deficit in PBIF-75 compared to WHO F-75.
à
Means with different superscript are significantly different at 5%
significance level.
the peanut milk base was as high as 444.4 mg ⁄ 100 g
powder. This content yielded a P level of 170 mg ⁄ 100 g
in the formula PBIF-75, still higher than the WHO
requirement (147 mg ⁄ 100 g). Hence, no P fortification
was needed. It is noteworthy to point out that F-75
micronutrient supplement did not contain Fe because
severely undernourished children tend to have an excess
of Fe and are at risk of death from excess of Fe (Briend,
2003). Likewise, PBIF-75 was not fortified with Fe. Zinc
and potassium content, however, should be maintained
high because these two elements are essential for muscle
building. Therefore, the mineral composition of the
premix used to fortify peanut milk needs to be
reformulated to incorporate higher levels of Zn and K
to meet the WHO requirements for F-75.
Vitamin content of peanut-based infant formulas (PBIF)
Table 5 shows that peanut milk contained much less
vitamins than F-75 except for Biotin and Niacin. After
fortification with the vitamin–mineral premix, all of the
vitamins required in therapeutic milk ⁄ formula were
present in PBIF-75 at significantly higher concentrations.
Vitamins A, C, D3, and K1 were present in PBIF-75 at
lower than the recommended levels as indicated by the
negative differences on the right column of Table 5.
These vitamins need to be added at higher level in the
fortifying premix used to formulate PBIF-75. The
negative differences indicate deficits that might be
because of losses during processing as these vitamins
are unstable. On the other hands, vitamins B6, Biotin,
International Journal of Food Science and Technology 2010
PBIF-75 = Peanut-Based Infant Formula mimicking the World Health
Organization (WHO) F-75 formula for nutritional recovery of malnourished children.
*
Data shown are means with standard deviations <5% of the mean
values as certified by Medallion Labs, Minneapolis MN, USA.
†
The negative differences indicate vitamin deficit in PBIF, and positive
differences indicate vitamin excess in PBI compared to WHO F-75.
and Niacin were present in PBIF-75 at the levels
130–300% higher than those recommended in F-75. This
excess may be caused by higher level of these vitamins in
peanut milk used as base ingredient, which was not
considered when the premix was formulated. Therefore,
the vitamin composition of the premix needs to be
adjusted to account for the native B6, biotin, and niacin
contents of dry peanut milk base. Reformulation should
also boost the levels of vitamin A, C, D, K1, and B12.
Amino acid profile of peanut milk and peanut-based infant
formula (PBIF-75)
The amino acid profile in Table 6 reveals that peanut
milk contained all amino acids at levels higher than the
WHO-recommended levels for F-75. Mixing of peanut
milk with other ingredients resulted in PBIF-75 with a
majority of amino acids at or above the desired levels for
WHO F-75 primarily because of the high protein
content of peanut milk. Among the 18 amino acids
analysed, 10 (aspartic acid, threonine, serine, glutamic
acid, glycine, alanine, leucine, phenylalanine, histidine,
and cystine) were present in PBIF-75 at levels higher
than the reference F-75, while four (valine, isoleucine,
arginine, and tryptophan) were slightly below the
recommended levels and 4 amino acids including proline, lysine, tyrosine, and methionine were significantly
low in PBIF-75. Therefore, the limiting amino acids in
PBIF-75 are lysine, tyrosine, and methionine. This is
Ó 2010 The Authors
International Journal of Food Science and Technology Ó 2010 Institute of Food Science and Technology
Fortified peanut-based infant formula N. Kane et al.
Table 6 Amino acid profile of peanut milk and PBIF-75 compared to
that of WHO F-75*
Amino acid
(g ⁄ 100 g)
Peanut Milk
(g ⁄ 100 g)
PBIF-75
(g ⁄ 100 g)
WHO
F-75
Difference†
(PBIF-75
– WHO F-75)
Aspartic acid
Threonine
Serine
Glutamic acid
Proline
Glycine
Alanine
Valine
Methionine
Isoleucine
Leucine
Tyrosine
Phenylalanine
Histidine
Lysine
Arginine
Cystine
Tryptophan
2.79
0.756
1.11
4.31
0.703
1.03
0.973
0.829
0.216
0.808
1.60
0.955
1.10
0.729
0.437
0.486
0.270
0.180
1.06
0.28
0.422
1.64
0.267
0.392
0.37
0.315
0.082
0.307
0.609
0.18
0.419
0.277
0.166
0.185
0.102
0.068
0.428
0.254
0.30
1.18
0.546
0.11
0.19
0.378
0.141
0.341
0.553
0.272
0.272
0.153
0.435
0.204
0.051
0.079
0.632
0.026
0.122
0.46
)0.279
0.282
0.18
)0.063
)0.059
)0.034
0.056
)0.092
0.124
0.124
)0.269
)0.019
0.051
)0.011
*
Data shown are means with standard deviations <5% of the mean
values as certified by Medallion Labs, Minneapolis MN, USA.
†
The negative differences indicate that the amino acid of PBIF-75 is
deficient compared to WHO F-75, while positive differences indicate that
PBIF-75 has excess amino acids.
PBIF-75 = Peanut-Based Infant Formula mimicking the World Health
Organization (WHO) F-75 formula for nutritional recovery of malnourished children.
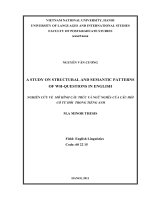
Energy (kcal 100 mL–1)
Infant formula
90.00
80.00
70.00
60.00
50.00
40.00
30.00
20.00
10.00
0.00
Protein
Fat
Carb
Total
Components of PBIF-75
Figure 2 Caloric values of peanut-based infant formula PBIF75*-* Compare to 75 Kcal ⁄ 100 mL in the WHO F-75 infant recovery
formula. PBIF-75 = Peanut-Based Infant Formula mimicking the
World Health Organization (WHO) F-75 formula for nutritional
recovery of malnourished children.
recommends that the beginning of the treatment be
hypoproteinic because starting with a high protein
treatment in children who have kwashiorkor may induce
anorexia because of disturbance of hepatic metabolism
and urea synthesis. Treatment with F-75 provides low
sodium for feeding children who have oedema (Briend,
2003). The second treatment consists of administering a
high protein and high calorie diet to promote rapid
weight gain for a rapid recovery of protein-energy
deficient children.
Conclusion
expected because these essential amino acids are scarce
in plant proteins. It is noteworthy, however, that the
amino acid profile of PBIF-75 does not reflect any
amino acid fortification. A reformulated PBIF-75 could
be easily fortified by including lysine, tyrosine, and
methionine in the fortification premix as to meet or
exceed the WHO recommendation for F-75.
Evaluation of the caloric value of peanut-based infant
formula (PBIF-75)
WHO protocol recommends that children suffering
from severely protein-energy deficiency be treated with
two different recovery formulas, F-75 and F-100. The
first treatment formula (F-75) provides 75 Kcal kg)1 of
body weight per day, while the second treatment
formula (F-100) provides 100 Kcal kg)1 day)1 for rapid
weight gain. Based on current formulations, 17.5 g
PBIF-75 formula is needed to yields 75 kcal (Fig. 2),
which is slightly higher than the 16.2 g of WHO F-75
formula needed to provide equivalent energy level. The
first step of treatment will cover the basic needs in
protein and energy at the lowest protein content. WHO
Peanuts were successfully used to develop spray-dried
full fat dried peanut milk powder with physicochemical
and nutritional properties that compare favourably to
those of commercially available dry cow milk, specifically, nonfat dry milk. Among nine combinations of
temperatures and pH, room temperature and native pH
were selected as the best condition to produce peanut
milk. Full fat peanut milk exhibited high nutritional
value because of the high protein and fat contents in
peanuts. Peanut-based infant formula (PBIF-75) developed by fortifying peanut milk according to the specifications of the World Health Organization for its F-75
nutritional recovery formula, was nearly identical to
WHO F-75 in terms of amino acid profile, vitamin–
mineral content, energy content, proximate composition, and physicochemical characteristics such as water
activity and colour. However, as formulated, the protein
content of PBIF-75 was higher than that of WHO-75,
which may be undesirable in the first phase of recovery
of severely malnourished children where excess protein
aggravates the metabolic imbalance (Bhan et al., 2003).
Hence, future reformulation of PBIF-75 should target
lower level of protein through addition of higher
Ó 2010 The Authors
International Journal of Food Science and Technology Ó 2010 Institute of Food Science and Technology
International Journal of Food Science and Technology 2010
1971
1972
Fortified peanut-based infant formula N. Kane et al.
amount of carbohydrates for energy. In addition, the
premix used for micronutrient fortification should be
adjusted to increase the contents of vitamins A, C, D, K,
and B12 in PBIF-75 to the levels in WHO-75 as well as
refinement of the levels of some of the minerals to
closely match WHO’s F-75. Therefore, future R&D
efforts will further optimise the protein content and
micronutrient composition of PBIF-75 and evaluate its
shelf-life and sensory quality.
The peanut-based infant formula (PBIF-75) proposed
in this study can be a competitive alternative to the milkbased WHO F-75 formula for recovery of malnourished
children. The optimised formulation will contain less
protein through the dilution effect from adding more
carbohydrates. The dry formula is designed to be shelf
stable for use in environment where refrigeration is
unavailable. However, to ensure safety, boiled water is
to be used for reconstitution of the formula. This should
further help reduce potential osmolarity effect. The
advantages of a peanut-based infant formula are (i)
shelf-stability as it is made of dried peanut milk; (ii) high
micronutrient contents as it is fortified with vitamins
and minerals to the levels of the WHO recommendations; (iii) potentially low cost because the base ingredient is a local crop.
Acknowledgment
This project was financially supported by USAID
Peanut CRSP NCA32U, and Agricultural Research
Program at North Carolina A&T State University.
References
Abdullah, A., Malundo, T.M.M., Rsurreccion, A.V.A. & Beuchat,
L.R. (1993). Descriptive sensory profiling for optimizing the formula
of a peanut milk based liquid coffee whitener. Journal of Food
Science, 58, 120–123.
Ahmed, E.M. & Young, C.T. (1982). Composition, quality and flavour
of peanuts. In: Peanut Science and Technology (edited by H.E. Pattee
& C.T. Young). Pp. 655–688. Yoakum, Texas 77995: American
Peanut Research and Education Society, Inc.
Akinyele, I.O. & Abudu, I.A. (1990). Acceptability and nutrient
content of milk substitutes from four cultivars of cowpeas (Vigna
unguiculata). Journal of Food Science, 55, 701–703.
Andersen, P.C., Hill, K., Gorbet, D.W. & Brodbeck, B.V. (1998).
Fatty acid and amino acid profiles of selected peanut cultivars and
breeding lines. Journal of Food Composition Analysis, 11, 100–111.
AOAC (2000). American Organization of Analytical Chemists
(AOAC) International Official Methods 942.23, 970.65 ⁄ 981.15,
961.15, 945.74 ⁄ 960.46, 944.12, 944.13 and 982.30.
AOAC (2003). American Organization of Analytical Chemists
(AOAC) International Official Methods 923.03 and 944.12.
Augustin, J., Klein, B.P., Becker, D. & Venugopal, P.B. (1985)
‘‘Methods of Vitamin Assay’’, 4th edn. New York: John Wiley and
Sons, Pp. 43, 50–58 and 541–549.
Bhan, M.K., Bhandari, N. & Bahl, R. (2003). Management of the
severely malnourished child: perspective from developing countries.
British Medical Journal, 326, 146–151.
International Journal of Food Science and Technology 2010
Black, R., Morriss, S. & Bryce, J. (2003). Where and why are 10
million children dying every year? Lancet, 361, 2226–2234.
Bourne, M.M., Escueta, E.E. & Banzon, J. (1976). Effect of sodium
alkalis and salts on pH and flavour of soy milk. Journal of Food
Science, 41, 62.
Briend, A. (2003). Prise en charge de la malnutrition severe de l’enfant
en milieu tropical. Medicine Tropicale, 63, 70.
Deutsch, M.J. & Weeks, C.E. (1965). Vitamin C (Total) in Vitamin
Preparations. Journal of AOAC, 48, 1248–1256.
DeVries, J.W. & Silvera, K.R. (2002). Determination of Vitamins A
(Retinol) and E (alpha-Tocopherol) in Foods by Liquid Chromatography: Collaborative Study. Journal of AOAC International, 85,
424–434.
Diop, H., Dossou, N., Ndour, M., Briend, A. & Wade, S. (2003).
Comparison of the efficacy of a solid ready to use food and a liquid
milk-based diet for the rehabilitation of severely malnourished
children: a randomized trial. American Journal of Clinical Nutrition,
78, 302–307.
Enwonwo, C., Phillips, R.S. & Ibrahim, C.D. (2004). Nutrition and
Oral Health in Africa. International Dental Journal, 54, 344–351.
Ismail, Y.S., Rustom, M.H., Lopez, L. & Baboo, M.N. (1995). UHTSterilized peanut beverages: changes in physicochemical properties
during storage. Journal of Food Science, 60, 378–383.
Ismail, Y.S., Rustom, M.H., Lopez-Leiva, M.M. & Nair, B.M. (1996).
UHT-Sterilized peanut beverages; kinetics of physicochemical
changes during storage and shelf-life prediction modeling. Journal
of Food Science, 61, 198–203.
Khalil, J.K. & Chunghtai, M.I.D. (1983). Chemical composition and
nutritional quality of five peanut cultivars grown in Pakistan. Plant
Foods for Human Nutrition, 33, 63–70.
Kholief, T.S. (1987). Chemical composition and protein properties of
peanuts. Zeitschrift fu¨r Erna¨hrungswissenschaft, 26, 56–61.
Kris-Etherton, P. (1999). High monounsaturated fatty acid diet lowers
both plasma cholesterol and triacyl glycerol concentrations. American Journal of Clinical Nutrition, 70, 1009–1015.
Lee, C. & Beuchat, L. (1991). Functional and sensory properties of
salad dressing containing fermented peanut milk. Journal of Food
Science, 56, 1665–1666.
Lee, C. & Beuchat, L. (1992). Chemical, physical, and sensory
characteristics of peanut milk as affected by processing conditions.
Journal of Food Science, 57, 401–405.
Muller, O., Gurrenne, M., Kouyate, B. & Becher, H. (2003). he
association between protein-energy malnutrition, malaria morbidity,
and all cause of mortality in West African children. Tropical
Medicine and International Health, 8, 507–511.
Phillips, K.M., Ruggio, D.V., Ashraf-Khorassani, M. & Haytowitz,
D.B. (2006). Difference in Folate Content of Green and Red Sweet
Peppers (Capsicum annuum) Determined by Liquid Chromatography-Mass Spectrometry. Journal of Agricultural and Food Chemistry,
54, 9998–10002.
Ramdath, D. & Golden, M. (1989). Non-haematological aspects of
iron nutrition. Nutrition Research Review, 2, 29–50.
Rubico, S.M., Resurreccion, A.V.A., Frank, J.F. & Beuchat, L.R.
(1987). Suspension stability texture and colour of high temperature
treated peanut beverage processed at different temperature and time
conditions. Journal of Food Science, 52, 1676–1679.
Schmidt, R.H., Sistrunk, C.P., Rchter, R.L. & Cornell, J.A. (1980).
Heat treatment and storage effects on texture characteristics of milk
and yogurt systems fortified with oil seed proteins. Journal of Food
Science, 45, 471.
The Peanut Institute (2005). Protein, good fats in peanuts reduce blood
pressure and heart disease. />111705_PR.htlm
Ó 2010 The Authors
International Journal of Food Science and Technology Ó 2010 Institute of Food Science and Technology
International Journal of Food Science and Technology 2010, 45, 1973–1979
Original article
Effect of different precooking methods on chemical composition
and lipid damage of silver carp (Hypophthalmichthys molitrix)
muscle
Mahmood Naseri,1 Masoud Rezaei,1* Sohrab Moieni,2 Hedayat Hosseni3 & Soheil Eskandari4
1
2
3
4
Department of Fisheries, Tarbiat Modares University, Noor, P.O. Box 46414-356, Mazandaran, Iran
Department of Food Science and Technology, School of Agriculture, Tehran University, Tehran, Iran
National Nutrition and Food Technology Research Institute, Shaheed Beheshti University, Tehran, Iran
Bureau of Food and Drug Laboratories, Tehran, Iran
(Received 3 March 2010; Accepted in revised form 11 June 2010)
Summary
The influence of three precooking methods (steaming, oven-baking and microwave-cooking) on the chemical
composition and lipid quality of silver carp fillets was evaluated. The changes in protein, fat and moisture
were found to be significant for all the treatments (P £ 0.05). The iron content in the samples subjected to
steam-cooking increased; however, the other precooking methods did not change the mineral contents
(P ‡ 0.05). The free fatty acid content of the fillets did not change by the different precooking methods, while
thiobarbituric acid (TBA) values increased for oven- and microwave-cooked fillets and remained constant in
the steam-cooked samples. Conjugated diene and browning colour formation levels significantly increased in
the oven-baked fillets. Oven-baking and microwave-cooking marginally affected the fatty acid composition
of the silver carp. On comparing the raw and precooked fillets, steam-cooking was found to be the best
precooking method on retaining nutritional constituents.
Keywords
Fatty acid composition, minerals, oxidation, precooking, proximate composition, silver carp.
Introduction
Seafood products have attracted considerable attention
as a source of high amounts of important nutritional
components to the human diet (Ackman, 1989). Seafoods have high protein content, low saturated fat and
also contain vitamins and minerals. Mineral components such as magnesium, calcium, zinc, iron and
phosphorus are essential for human nutrition (Erkan
& O¨zden, 2007).
However, in recent years, the fishing sector has
suffered from dwindling stocks of traditional species as
a result of dramatic changes in their availability. This
has prompted fish technologists and the fish trade to pay
more attention to aquaculture techniques as a source of
fish and other seafood products (Aubourg, 2001). Silver
carp (Hypophthalmichthys molitrix) is an extensively
cultured species. Aquaculture production of silver carp
is the highest of any finfish species in the world;
especially important in the Asia-Pacific region that has
an annual global production of nearly 4.2 million metric
tons. (Gheyas et al., 2009). Accordingly, the consump*Correspondent: Fax: +98 122 6253499;
e-mail:
tion of value-added products of this species has recently
increased.
Assurance of both the quality and safety of seafood
will be a major challenge faced by humans in this new
century (Aubourg et al., 2005). In this sense, wild and
farmed fish species are known to deteriorate after death
because of the action of different factors that can be
summarised as microbiological growth, endogenous
enzyme activity, nonenzymatic lipid oxidation and
browning. The relative incidence of each damage mechanism will depend on the kind of technological process
applied (Aubourg, 2001; Horner, 1997; Pigott & Tucker,
1987).
Canning belongs to the most important means of fish
preservation (Horner, 1997; Aitken & Connell, 1979).
As with any other treatment, canning should be
designed to retain as much as possible of all the
nutritional constituents present in the initial matter to
serve human nutrition (Aubourg, 2001). The extensive
heat treatment involved in canning steps substantially
alters the nature of the raw material so that, in effect, a
product with different characteristics is formed.
Precooking is a critical thermal process before retorting and designated to destroy pathogenic microorganisms, endogenous enzymes, secure certain
doi:10.1111/j.1365-2621.2010.02349.x
Ó 2010 The Authors. International Journal of Food Science and Technology Ó 2010 Institute of Food Science and Technology
1973
1974
Lipid changes during silver carp precooking M. Naseri et al.
sensory properties and product stability for canning
(Aubourg, 2001). In canneries, fish is usually precooked
by steam, but sometimes it is treated by other cooking
methods (FAO, 1988). The fish species and the cooking
method used may be determinant factors for the content
of nutritional constituents (lipids, proteins, minerals and
vitamins) in the final product. Some of the major
changes that occur during processing and final preparation of heated food are because of oxidation. The
polyunsaturated fatty acids (PUFA), such as eicosapentaenoic acid (EPA) and docosahexaenoic acid (DHA),
are considered to be especially susceptible to oxidation
during heating and other culinary treatments (Sant’Ana
& Mancini-Filho, 2000).
However, research concerning the quality changes
that might occur during canning and thermal treatment,
such as the mechanisms of damage taking place in silver
carp during precooking relatively unknown. In the light
of this situation, this study was conducted to determine
the influence of three precooking methods (steaming,
oven-baking and microwave-cooking) on the composition (proximate, mineral and fatty acid profile) and lipid
oxidation of silver carp.
Materials and methods
Sample procedures
Seventeen silver carp (H. molitrix) weighing between 2.3
and 3.0 kg were obtained from a local fish farm (Khuzestan, Iran) during the winter 2009. They were eviscerated,
washed and immediately transported to the laboratory in
ice-containing boxes. Fresh fish were washed with water
several times to remove adhering blood and slime, they
were then prepared using common household practices,
such as removing head, tail and fin yielding two fillets.
The fillets were randomly divided into thirty homogenous portions of 900 g, which were assigned to three
repetitions of each one of the three cooking methods and
to the raw group that was used as a reference.
Precooking methods
For purposes of this study, fillets were divided into three
equal lots representing the following precooking treatments: steam-cooked, oven-cooked and microwavecooked. For all precooking treatments, fillets were
placed belly-side down on perforated trays and heated.
At the time of processing, mean core temperature of
fillets were monitored by thermocouple (Aidin Scientific
trade mark, Tehran, Iran), when the mean core temperature of fillets reached almost to 65 °C, process was
complete and the equipments turned off (FAO, 1988).
To prepare oven-baked fillets, the oven temperature
was set at 175 °C for 60 min. Microwave-baked fillets
were prepared in a domestic microwave oven (LG.
International Journal of Food Science and Technology 2010
model Solar Dom, Seoul, Korea) at potency 900 w, for
7 min. Steam-cooked fillets were prepared in a horizontal retort at 102–103 °C for 48 min.
Samples of raw or cooked fish fillets were homogenised and used to determine proximate composition,
mineral and fatty acid profile as well as the level of free
fatty acids (FFAs), conjugated dienes, brown colour
formation, fluorescence shift and thiobarbituric acid
index (TBA-i).
Proximate composition
The moisture content of raw and cooked fillets were
determined by drying in an oven at 105 °C until a
constant weight was obtained (AOAC, 1995). Crude
protein content was calculated by converting the nitrogen content determined by Kjeldahl’s method
(6.25 · N). Fat was determined by the method described
by the Bligh & Dyer (1959). Ash content was determined
by dry ashing in a furnace at 525 °C for 24 h (AOAC,
1995).
Mineral analyses
Mineral contents of raw and precooked samples (calcium, copper, iron, zinc and sodium) were analysed by
means of atomic absorption spectrophotometer using a
Shimadzu Spectra atomic absorption (AAS) model AA680 by AOAC method (1995).
Analysis of lipid damage
The FFA content was determined by the method of
Egan et al. (1981). Results are expressed as percentage
of oleic acid. The TBA-i (mg malondialdehyde per kg
fish flesh) was determined by the method described in
the Pearson’s composition and analyses of food (1991).
Conjugated diene (CD) formation was measured at
233 nm (Kim & Labella, 1987). The results were
determined
according
to
following
formula.
CD = (B · V) ⁄ w, where B is the absorbance reading
at 233 nm, V denotes the volume (mL) of the sample,
and w is the mass (mg) of lipid extract measured.
Browning development was determined by spectrophotometer at 420 nm in the lipid extract of the edible flesh.
The results were calculated using the equation: Browning = A · V ⁄ w, where A is the absorbance reading at
420 nm, V is the volume (mL) of the sample, and w is
the amount (mg) of the lipid sample (Smith et al.,1990).
Formation of fluorescent compounds was determined
with a Perkin-Elmer LS 5B fluorimeter (Perkin-Elmer,
Norwalk, CT, USA) by measurements at 393 ⁄ 463 and
327 ⁄ 415 nm, as the method described by Aubourg et al.
(1998). Relative fluorescence (RF) was calculated as:
RF = F ⁄ Fst, where F is the fluorescence measured at
each excitations ⁄ emission maximum, and Fst is the
Ó 2010 The Authors
International Journal of Food Science and Technology Ó 2010 Institute of Food Science and Technology
Lipid changes during silver carp precooking M. Naseri et al.
)1
fluorescence intensity of a quinine sulphate solution
(1 lg mL)1 of 0.05 m H2SO4) at the corresponding
wavelength. The fluorescence ratio (FR) was calculated
as the ratio between both RF values: FR = RF393–
463 nm ⁄ RF327–415 nm. The aqueous phase resulting
from the lipid extraction (Bligh & Dyer, 1959) was used
to evaluate the FR value.
Table 2 Mineral composition of raw and cooked silver carp (mg kg )
Fatty acid composition
Results are means ± SD. Means within the same row that have no
common letters are significantly different (P £ 0.05).
Fatty acid methyl esters (FAME) were prepared by
methylation of the triacylglycerols, as described by
Cronin et al. (1991), and analysed using a Shimadzu
17A (Kyoto, Japan) gas chromatograph equipped with
flame ionisation detector and fused silica capillary
column (50 m – 0.32 mm and 0.20 mm of Carbowax
20M). The column temperature was programmed at
2 °C min)1 from 150 to 240 °C. The injection port and
detector were maintained at 220 and 245 °C, respectively. The carrier gas was hydrogen (1.2 mL min)1), the
make-up gas was nitrogen (30 mL min)1) and the split
used was 1:100. The identification of normal fatty acids
was carried out by comparing the relative retention
times of FAME peaks from samples with standards
from Restek and the main fatty acids, in order of
abundance, were confirmed using another Shimadzu
17A (Japan) gas chromatograph.
Statistical analysis
Data from the different chemical measurements were
subjected to one-way analysis of variance (P < 0.05).
Comparison of means was performed using Duncan
method.
Results and discussion
Proximate composition
The changes in moisture, ash, protein and fat content of
samples after precooking processes are shown in
Table 1. The proximate composition of raw fillets is
comparable to that of observed by Siddaiah et al. (2001)
and Ali et al. (2005) for silver carp.
Table 1 Proximate composition of raw and cooked silver carp
(g 100 g)1)
Raw
Steam-cooked Oven-baked Microwave-cooked
Moisture 74.15 ± 0.91a 70.84 ± 0.55c
Protein 17.06 ± 0.43b 18.81 ± 0.71a
Fat
10.97 ± 1.27a 8.32 ± 1.2b
Ash
1.27 ± 0.19a 1.25 ± 0.17a
67.57
18.66
7.95
0.99
±
±
±
±
0.78d 72.38 ± 0.22b
0.87a 18.37 ± 0.25a
0.62b 5.73 ± 0.40c
0.01b 0.92 ± 0.05b
Results are means ± SD. Means within the same row that have no
common letters are significantly different (P £ 0.05).
Raw
Cu
Zn
Fe
Na
Ca
3.21
82.85
32.55
528.8
534.75
Steam-cooked
±
±
±
±
±
a
0.53
3.99
46.37a 82.64
2.26b
32.18
221.80a 529.46
221.06a 459.85
±
±
±
±
±
a
Oven-baked
0.05
4.19
42.46a 71.45
1.67b
35.46
123.94a 460.8
329.90a 369.66
±
±
±
±
±
Microwave-cooked
a
1.65
3.05
31.73a 76.9
4.43ab 40.70
44.05a 425.6
92.13a 315.50
±
±
±
±
±
0.33a
27.24a
4.92a
50.7a
80.21a
The moisture content of the fish fillets ranged from
74% to 67%, which decreased after cooking (Table 1).
The ash content decreased after cooking, except for the
steam-cooked fillets, the protein content increased after
cooking in all evaluated methods and fat content
decreased after cooking processes (P £ 0.05) (Table 1).
The decrease in the moisture content has been described
as the most prominent factor that causes protein, fat and
ash contents alter significantly in cooked fish fillets
(Garcı¢a-Arias et al., 2003). Accordingly, the increase in
protein content of cooked silver carp fillets could be
explained by the reduction of moisture (Table 1).
Mineral composition
Table 2 shows the composition of the mineral elements
in raw and precooked fillets. The contents of investigated mineral elements in raw and precooked fish
samples were found to be in the range of 3.05–
4.19 mg kg)1 for copper, 32.18–40.70 mg kg)1 for iron,
71.45–82.85 mg kg)1 for zinc, 425.6–529.4 mg kg)1 for
sodium and 315.5–534.7 mg kg)1 for calcium. According to these data, calcium had the highest concentration,
followed by sodium, zinc, iron and copper. The high
concentration of calcium could be because of the bony
nature of silver carp. This result is in accordance with
the finding that was reported by Steiner-Asiedu et al.
(1991) for fresh water bony fish.
The applied precooking methods had little or no effect
on the concentration of sodium, zinc, calcium and copper
(P ‡ 0.05). In the previous studies, it was found that the
processing and cooking methods had no effect on the
mineral contents of fish (Gall et al., 1983; Steiner-Asiedu
et al., 1991). In this investigation, after processing the
iron values were the highest for microwave-cooked
samples when compared to the other precooking
methods. However, it might be because of the individual
difference of samples.
Lipid damage
Lipid hydrolysis
Comparison of the initial raw fish before and after
precooking (all methods) showed that the thermal
Ó 2010 The Authors
International Journal of Food Science and Technology Ó 2010 Institute of Food Science and Technology
International Journal of Food Science and Technology 2010
1975
1976
Lipid changes during silver carp precooking M. Naseri et al.
Table 3 Assessment of lipid damage and interaction compound for-
mation
Raw
Steam-cooked Oven-baked
a
a
0.87 ± 0.32
FFA 0.61 ± 0.14
TBA 0.018 ± 0.001c 0.017 ± 0.005c
CD
0.57 ± 0.06b
0.74 ± 0.10b
b
BFC 0.55 ± 0.08
0.85 ± 0.9b
dF
0.29 ± 0.024b 0.38 ± 0.05ab
1.03
0.020
2.21
2.25
0.33
±
±
±
±
±
Microwave-cooked
a
0.4
2.52 ± 2.05a
b
0.002 0.026 ± 0.002a
0.64a
1.30 ± 0.56b
a
0.41
1.28 ± 0.59b
0.09ab 0.41 ± 0.02a
Results are means ± standard deviation. Means within the same row that
have no common letters are significantly different (P £ 0.05).
FFA, free fatty acid (as g oleic acid ⁄ 100 g)1 lipid); TBA, thiobarbituric acid
(as mg MDA kg)1 muscle); CD, conjugated diene; BFC, browning colour
formation; dF, fluorescence shift were measured as expressed in
Materials and methods.
process did not lead to a significant variation in the FFA
content of the fish muscle (P ‡ 0.05). This result is in
agreement with those of Rodrı¢guez et al. (2008). FFA
formation often occurs as a result of catalysis by
endogenous enzymes, and only microbial effects would
be significant after the end of the lag phase (Whittle
et al., 1990). However, deactivation of enzymes, as a
result of the heating process, would prevent the release
of FFAs owing to lipase activity in the cooked samples
(Weber et al.,2008). Furthermore, during a thermal
treatment, breakdown of high-molecular weight (triglycerides and phospholipids, namely) lipids would be
likely to occur and be the source of new FFA formation
(Gallardo et al., 1989; Yamamoto & Imose, 1989). On
the one hand, Weber et al. (2008) reported that the loss
of volatile FFA occurred during heating, leading to a
decreased FFA content. Insignificant change in FFA in
this study can be explained by deactivation of enzymes
or FFA volatilisation.
The formation of FFA itself does not lead to
nutritional losses. However, accumulation of FFA has
been related to some extent to lack of acceptability,
because FFA is known to have detrimental effects on
protein solubility and causes texture deterioration by
interacting with proteins (Sikorski & Kolakowska, 1994)
and oxidises faster than higher-molecular weight lipid
classes by providing a greater accessibility (lower steric
hindrance) to oxygen and other pro-oxidant molecules
(Labuza, 1971).
Lipid oxidation
Results concerning the conjugated diene formation are
shown in Table 3. As a result of oven precooking,
significant increase in diene contents was detected
(P £ 0.05). However, this damage index did not show
significant difference between raw fish and steam- or
microwave-precooked fillets (P ‡ 0.05).
The measurement of the diene absorbance at 233 nm
is considered as a very sensitive method of detecting the
International Journal of Food Science and Technology 2010
beginning of lipid oxidation and has often been
employed (White, 1995). Conjugated diene levels in
oven-baked fillets increased. But this index did not show
significant difference between steam- and microwavecooked samples with raw fillets (P ‡ 0.05). However,
when a thermal treatment such as precooking is
involved, an important thermal breakdown of conjugated diene is likely to occur so that their assessment
would not allow an accurate tool for assessing lipid
damage progress (Aubourg et al., 1995; Lubis & Buckle,
1990).
The formation of secondary oxidation products was
measured by means of the TBA-i. Marked increases in
such compounds were obtained as a result of microwave
and oven precooking. No significant difference was
obtained between steam-precooked and raw fish
(P ‡ 0.05). The secondary oxidation compound formation resulted in an interesting tool to assess the chemical
changes produced as a result of the cooking process. In
this sense, previous research already accounts for
carbonyl formation during cooking in tuna, salmon
and sardine fishes (Aubourg et al., 1995; Rodrı¢guez
et al., 2008; Yamamoto & Imose, 1989).
Formation of interaction compounds
Interaction compound formation was measured by
means of the fluorescent compound and browning
development in the silver carp muscle before and after
precooking (Table 2). The browning measurement for
muscle lipid was increased after oven cooking
(P £ 0.05). The elevation of interaction compounds
could be explained by the obtained results of CD and
TBA. These results agree with previous work carried out
on cooking of salmon (Rodrı¢guez et al., 2008). No
development of browning colour was observed in silver
carp muscle as a result of cooking by steam or
microwave.
The formation of fluorescence compounds also called
tertiary oxidation compounds (Aubourg, 1999) is the
result of the interaction between lipid oxidation products (primary and secondary) and protein-like molecules
present in fish muscle. The detection of fluorescence
compounds (dF) in the silver carp muscle varied little as
result of steam and oven cooking. However, microwavecooking has increased in dF content (P £ 0.05). We did
not find studies evaluating the effect of oven- or
microwave-cooking on the dF content of fish fillets.
Although there is a report of significant increase in dF
content after steam-cooking of two tuna species (Aubourg et al., 1995).
Fatty acid composition
The profile of the most important fatty acids of the silver
carp and precooked fillets are shown in Table 4. The
Ó 2010 The Authors
International Journal of Food Science and Technology Ó 2010 Institute of Food Science and Technology
Lipid changes during silver carp precooking M. Naseri et al.
Table 4 Fatty acids composition of raw and precooked silver carp
Fatty acids
14:0
14:1 x7
16:0
16:1 x7
18:0
18:1 x9
18:1 x11
18:2 x6
18:3 x3
20:0
20:1 x11
20:2 x6
20:3 x6
20:4 x6
20:5 x3
22:0
22:1 x9
22:6 x3
P
SFA
P
MUFA
P
PUFA
P
x3
P
x6
P
x3 ⁄ x6
Raw
1.51
0.31
20.46
9.8
2.91
38.27
1.43
2.86
4.87
1.75
0.66
1.475
0.50
1.35
1.78
0.56
0.63
2.25
26.18
52.14
15.09
8.90
6.19
1.44
Steam-cooked
±
±
±
±
±
±
±
±
±
±
±
±
±
±
±
±
±
±
±
±
±
±
±
±
a
0.1
0. 05a
0.35a
0.02a
0.42a
0.84a
0.23b
0.11a
0.15a
0.03a
0.06a
0.06a
0.14a
0.18a
0.18a
0.12a
0.14a
0.05b
0.50a
1.18a
0.62a
0.16a
0.47a
0.08a
1.71
0.34
19.75
9.83
3.94
36.3
1.46
2.93
5.3
1.43
0.68
1.70
0.4
1.17
1.67
0.68
0.81
2.26
26.91
50.05
15.44
9.23
6.20
1.48
±
±
±
±
±
±
±
±
±
±
±
±
±
±
±
±
±
±
±
±
±
±
±
±
Oven-baked
a
0.49
0.81a
0.36a
0.12a
1.76a
1.98a
0.34b
0.02a
0.41a
0.32a
0.09a
0.03a
0.07a
0.28a
0.62a
0.17a
0.20a
0.29b
1.14a
2.77a
1.77a
1.33a
0.41a
0.11a
1.79
0.35
20.16
9.08
2.48
34.01
2.51
2.77
4.74
1.38
0.61
1.19
0.58
0.92
1.33
1.02
0.89
1.87
25.94
48.40
13.31
7.95
5.47
1.46
±
±
±
±
±
±
±
±
±
±
±
±
±
±
±
±
±
±
±
±
±
±
±
±
a
0.30
0.06a
0.03a
0.31b
0.19a
3.18a
0.19a
0.19ab
0.77a
0.35a
0.34a
0.52a
0.28a
0.55a
0.28a
0.44a
0.27a
0.47c
1.003a
2.17a
1.84a
1.09a
0.96a
0.11a
Microwave-cooked
1.35
0.28
20.3
8.72
2.36
37.66
1.930
2.63
4.62
1.32
0.58
1.81
0.37
1.075
1.81
0.74
0.89
2.76
25.53
50.65
15.09
9.20
5.88
1.56
±
±
±
±
±
±
±
±
±
±
±
±
±
±
±
±
±
±
±
±
±
±
±
±
0.04a
0.01a
0.25a
0.42b
0.22a
0.63a
0.08b
0.01b
0.17a
0.33a
0.04a
0.02a
0.01a
0.03a
0.03a
0.01a
0.01a
0.06a
0.16a
0.79a
0.29a
0.26a
0.02a
0.03a
Values are percentage of total fatty acid expressed as mean ± SD of three separate determinations.
Means within the same row that have no common letters differ significantly (P £ 0.05).
SFA, saturated fatty acid; MUFA, monounsaturated fatty acid; PUFA, polyunsaturated fatty acid.
most abundant fatty acids found in raw and precooked
silver carp fillets were oleic acid (C18:1 x9), palmitic
acid (C16:0) and palmitoleic acid (C16:1 x7). These
findings are in agreement with those obtained by Mieth
et al. (1989) and Vujkovic et al. (1999). Silver carp fillets
also showed considerable amounts of palmitoleic acid
(C16:1 x7), stearic acid (C18:0), linoleic acid (C18:2 x6)
and DHA (C22:6 x3).
Steam-cooking had no effect on the fatty acid content
of silver carp, although microwave- and oven-cooking
marginally affected some fatty acids content. The
changes were not homogeneous for the different fatty
acids because some fatty acids decreased, some increased, while the others had no change (Table 4). In
microwave-cooked samples, the content of palmitoleic
(C16:1 x7) and linoleic acid (C18:2 x6) was decreased
and DHA (C22:6 x3) was increased, likewise in ovencooked fillets the content of palmitoleic (C16:1x7) and
DHA (C22:6 x3) was decreased and the amount of oleic
acid (C18:1x9) was increased (P £ 0.05).
In all four groups (raw, steam-cooked, oven-cooked
and microwave-cooked samples) of silver carp fillets,
monounsaturated FAs were the dominant class of fatty
acids and PUFs were the least one. This result is similar
to the finding that was reported by Vujkovic et al.
(1999). Comparison of raw fillets with all groups of
precooked samples showed that the amounts of polyunsaturated and monounsaturated fatty acids did not
alter by processing. Similar results were obtained by
Garcı¢a-Arias et al. (1994) during steaming of white
tuna and Aubourg et al. (1990) during processing of
albacore.
The x3 ⁄ x6 ratio has been suggested to be a useful
indicator for comparing relative nutritional values of
fish oils. It was suggested that a ratio of 1:1–1:5 would
constitute a healthy human diet (Osman et al., 2001).
Raw and precooked silver carp had the x3 ⁄ x6 ratio
within the recommended ratio. However, this index
showed no significant difference between raw fish and
precooked samples (steam-, microwave- and ovencooked fillets).
Conclusions
All of the three evaluated precooking methods changed
proximate composition and lipid oxidation parameters
of silver carp (H. molitrix) fillets. Changes in proximate
composition were more prominent in oven- and microwave-cooked fillets. Oven- and microwave-cooked fillets
had increased levels of conjugated diene, TBA-i,
browning colour formation and fluorescence compound
indicating oxidative changes, but these indices in
Ó 2010 The Authors
International Journal of Food Science and Technology Ó 2010 Institute of Food Science and Technology
International Journal of Food Science and Technology 2010
1977
1978
Lipid changes during silver carp precooking M. Naseri et al.
samples subjected to steam-cooking were constant. The
changes in mineral contents of precooked samples (all
methods) were found to be insignificant with the
exception of increases in iron content of microwave
precooked samples. Steam precooking had no effect on
the fatty acid content of silver carp although microwave
and oven precooking marginally affected some fatty
acids content. Steaming appeared to be the best
precooking method concerning proximate composition,
oxidative stability and the fatty acid profile. It seems this
method retains as much as possible of all the nutritional
constituents present in the initial silver carp fillets.
Acknowledgments
The authors thank Ms Mahdiyeh Abbasi and Mrs
Masoumeh Fekri for their great assistance in chemical
testing. The help of Ms Farahnaz Gaffari is also greatly
appreciated.
References
Ackman, R.G. (1989). Fatty acids. In: Marine Biogenic Lipids, Fats
and Oils (edited by R. Ackman). Pp. 103–137. Boca Raton, USA:
CRC Press.
Aitken, A. & Connell, J. (1979). Fish. In: Effects of heating on food
stuffs (edited by R. Priestley). Pp. 219–254. London: Applied Science
Publishers Ltd.
Ali, M., Iqbal, F., Salam, A., Sial, F. & Athar, M. (2005). Comparative
study of body composition of four fish species in relation to pond
depth. Journal of Environmental Science and Technology, 2, 359–364.
AOAC. (1995). Official Methods of Analyses of Association of
Analytical Chemist, 15th edn.Washington, DC: AOAC.
Aubourg, S. (1999). Review: recent advances in assessment of marine
lipid oxidation by using fluorescence. Journal of the American Oil
Chemists Society, 76, 409–419.
Aubourg, S. (2001). Loss of quality during the manufacture of canned
fish products. Food Science and Technology International, 7, 199–
215.
Aubourg, S., Carmen, G.S. & Gallardo, J. (1990). Change in flesh
lipids and fill oils of albacore during canning and storage. Journal of
Agricultural and Food Chemistry, 38, 809–812.
Aubourg, S., Medina, I. & Perez-Martin, R. (1995). A comparison
between conventional and fluorescence detection methods of cooking-induced damage to tuna fish lipids. Zeitschrift fu¨r Lebensmitteluntersuchung und-Forschung A, 200, 252–255.
Aubourg, S., Medina, I. & Gallardo, J. (1998). Quality assessment of
blue whiting (Micromesistius poutassou) during chilled storage by
monitoring lipid damages. Journal of Agricultural and Food Chemistry, 46, 3662–3666.
Aubourg, S., Pineiro, C., Gallardo, J. & Barros-Velazquez, J. (2005).
Biochemical changes and quality loss during chilled storage of
farmed turbot (Psetta maxima). Food Chemistry, 90, 445–452.
Bligh, E.G. & Dyer, W.J. (1959). A rapid method of total lipid
extraction and purification. Canadian Journal of Biochemistry and
Physiology, 37, 911–917.
Cronin, D., Powell, A.R. & Gormley, R. (1991). An examination of the
(n-3) and (n-6) polyunsaturated fatty acid and status of wild and
farmed Atlantic salmon (Salmo salar). Irish Journal of Food Science
& Technology, 15, 53–62.
Egan, H., Kirk, R.S. & Sawyer, R. (1981). Oil and Fat in Pearsons
Chemical Analysis of Foods. New York: Longman Scientific and
Technical Press, 536 pp.
International Journal of Food Science and Technology 2010
Erkan, N. & O¨zden, O¨. (2007). Proximate composition and mineral
contents in aqua cultured sea bass (Dicentrarchus labrax), sea bream
(Sparus aurata) analyzed by ICP-MS. Food chemistry, 102, 721–725.
FAO. (1988). Manual on fish canning. Rome, Italy: FAO Technical paper. Available at: />t0007e00.htm.
Gall, K.L., Otwell, W.S., Koburger, J.A. & Appledorf, H. (1983).
Effects of four cooking methods on proximate, mineral and fatty
acid composition of fish fillets. Journal of Food Science, 48, 1068–
1074.
Gallardo, J.M., Aubourg, S. & Pe¢rez-Martı¢n, R. (1989). Lipid classes
and their fatty acids at different loci of albacore (Thunnus alalunga):
effects of the pre-cooking. Journal of Agricultural and Food
Chemistry, 37, 1060–1064.
Garcı¢a-Arias, T., Sa¢nchez-Muniz, F.J., Castrillo¢n, A. & Navarro, P.
(1994). White tuna canning, total fat, and fatty acid changes during
processing and storage. Journal of Food Composition and Analysis, 7,
119–130.
Garcı´ a-Arias, T., Pontes, E.A´., Garcı´ a-Linares, M.C., Garcı´ aFerna´ndez, M.C. & Sa´nchez-Muniz, F.J. (2003). Cooking-freezing
reheating (CFR) of sardine (Sardina pilchardus) fillets. Effect of
different cooking and reheating procedures on the proximate and
fatty acid compositions. Food Chemistry, 83, 349–356.
Gheyas, A.A., Woolliams, J.A., Taggart, J.B. et al. (2009). Heritability
estimation of silver carp (Hypophthalmichthys molitrix) harvest traits
using microsatellite based parentage assignment. Journal of Aquaculture, 294, 187–193.
Horner, W. (1997). Canning fish and fish products. In: Fish Processing
Technology (edited by G. Hall). Pp. 119–159. London: Blackie
Academic and Professional, Chapman and Hall.
Kim, R. & Labella, F. (1987). Comparison of analytical methods for
monitoring autoxidation profiles of authentic lipids. Journal of Lipid
Research, 28, 1110–1117.
Labuza, T. (1971). Kinetics of lipid oxidation in foods. CRC Critical
Reviews in Food Technology, 2, 355–405.
Lubis, Z. & Buckle, K. (1990). Rancidity and lipid oxidation of driedsalted sardines. International Journal of Food Science and Technology, 25, 295–303.
Mieth, G., Wirth, M., Friedrich, M., Steffens, W. & Lieder, U. (1989).
Cyprinida lipid content, 1st Report, lipid content and fatty acids
composition of silver carp (Hypophthalmichthys molitrix). Die
Nahrung, 33, 91–93.
Osman, H., Suriah, A.R. & Law, E.C. (2001). Fatty acid composition
and cholesterol content of selected marine fish in Malaysian waters.
Food Chemistry, 73, 55–60.
Pigott, G. & Tucker, B. (1987). Science opens new horizons for
marine lipids in human nutrition. Food Reviews International, 3,
105–138.
Rodrı¢guez, A., Carriles, N., Cruz, J.M. & Aubourg, S. (2008).
Changes in the flesh of cooked farmed salmon (Oncorhynchus
kisutch) with previous storage in slurry ice. Journal of Food Science
and Technology, 41, 1726–1732.
Sant’Ana, L.S. & Mancini-Filho, J. (2000). Influence of the addition of
antioxidants in vivo on the fatty acid composition of fish fillets. Food
Chemistry, 68, 175–178.
Siddaiah, D., Vidya Sagar Reddy, G., Raju, C.V. & Chandrasekhar,
T.C. (2001). Changes in lipids, proteins and kamaboko forming
ability of silver carp (Hypophthalmichthys molitrix) mince during
frozen storage. Food Research International, 34, 47–53.
Sikorski, Z. & Kolakowska, A. (1994). Changes in protein in frozen
stored fish. In: Seafood Proteins (edited by Z. Sikorski, B. Sun Pan &
F. Shahidi). Pp. 99–112. New York, USA: Chapman and Hall.
Smith, G., Hole, M. & Hanson, S. (1990). Assessment of lipid
oxidation in Indonesian salted –dried Marine catfish (Arius thalassinus). Journal of the Science of Food and Agriculture, 51, 193–205.
Steiner-Asiedu, M., Julshamn, K. & Lie, Q. (1991). Effect of local
processing methods (cooking, frying and smoking) on three fish
Ó 2010 The Authors
International Journal of Food Science and Technology Ó 2010 Institute of Food Science and Technology
Lipid changes during silver carp precooking M. Naseri et al.
species from Ghana: part I. Proximate composition, fatty acids,
minerals, trace elements and vitamins. Food Chemistry, 40, 309–
321.
Vujkovic, G., Karlovic, D., Vujkovic, I., Vorosbaranyi, I. & Jovanovic, B.
(1999). Composition of muscle tissue lipids of silver carp and
bighead carp. Journal of the American Oil Chemists’ Society, 6, 475–
480.
Weber, J., Bochi, V.C., Ribeiro, C.P., Victo¢rio, A.M. & Emanuelli, T.
(2008). Effect of different cooking methods on the oxidation,
proximate and fatty acid composition of silver catfish (Rhamdia
quelen) fillets. Food Chemistry, 106, 140–146.
White, P. (1995). Conjugated diene, anisidine value and carbonyl value
analyses. In: Method to Assess Quality and Stability of Oils and Fat
Containing Foods (edited by K. Warner & N.A.M. Eskin). Pp. 159–
178. Champaign, IL, USA: AOCS Press.
Whittle, K., Hardy, R. & Hobbs, G. (1990). Chilled fish and fishery
products. In: Chilled Foods (edited by T. Gormley). Pp. 87–116. The
State of the Art New York, USA: Elsevier Applied Science.
Yamamoto, Y. & Imose, K. (1989). Changes in fatty acid composition in sardines (Sardinops melanosticta) with cooking and
refrigerated storage. Journal of Nutritional Science and Vitaminology, 35, 39–47.
Ó 2010 The Authors
International Journal of Food Science and Technology Ó 2010 Institute of Food Science and Technology
International Journal of Food Science and Technology 2010
1979
International Journal of Food Science and Technology 2010, 45, 1980–1992
1980
Original article
Fat, wheat bran and salt effects on cooking properties of meat
patties studied by response surface methodology
Hasibe Tekin,1 Cemalettin Saricoban1* & Mustafa Tahsin Yilmaz2
1 Selcuk University, Agriculture Faculty, Food Engineering Department, Konya, 42049, Turkey
2 Erciyes University, Safiye Cikrikcioglu,Vocational College, Food Technology Division, Kayseri, 38039, Turkey
(Received 4 February 2010; Accepted in revised form 21 June 2010)
Summary
Response surface methodology was used to investigate the main effects and interactions of composition
(processing) variables such as fat (10–30%), wheat bran (5–15%) and NaCl (0–2%) on cooking properties of
beef patties. In addition, the ridge analysis was conducted to find the values of processing variables that
maximise and minimise the cooking parameters (moisture retention, fat retention, reduction in thickness,
reduction in diameter, cooking yield, shrinkage and water-holding capacity). It was found that the moisture
and fat retention, reduction in thickness and cooking yield values decreased; however, reduction in diameter
and shrinkage values increased, respectively, as the amount of fat increased. However, wheat bran addition
increased fat retention, moisture retention, cooking yield and water-holding capacity values of the patties.
Increasing NaCl levels decreased water-holding capacity value by its quadratic effect and moisture and fat
retention value by its interaction effect with wheat bran.
Keywords
Cooking parameters, fat, NaCl, optimisation, patty, wheat bran.
Introduction
Fat and salt have recently been partially replaced with
some non-meat ingredients in the formulations of
ground meat products because of their potential health
risks. However, such replacements for reducing the fat
and salt content result in some technological problems
such as increased cooking loses and purge because of
poor fat and water binding as well as undesired change
in colour, texture and flavour of the product (Girard
et al., 1990; Crehan et al., 2000; Yilmaz, 2004; Huang
et al., 2005).
The compositional change in the meat products by
means of incorporation of non-meat ingredients into
their formulations are among the solutions used to
minimise problems related to fat reduction (Claus &
Hunt, 1991; Gregg et al., 1993; Keeton, 1994) and salt
reduction (Ruusunen et al., 2003, 2005). Several dietetic
fibres are among these ingredients. Fibre has been
recently added into meat products and is on the increase
nowadays because of its functional properties and
benefits to human health (Vendrell-Pascuas et al.,
2000). Plant origin foods contain fibres; however, dairy
and animal foods do not contain fibre. Wheat bran is the
*Correspondent: Fax: +90 332 241 0108;
e-mail:
best known source of insoluble dietary fibre. In addition,
several dietetic fibres have been used in meat products to
determine their possible beneficial effects on cooking
properties of meat products (Yilmaz, 2004, 2005).
Because of these functional properties, several grain
fibres have been extensively used in the ground meat
products as a replacement of fat and some other main
constituents of these products.
The use of dietetic fibre in the meat products may not
be the only solution for the aforementioned problems
caused by fat and salt reduction. It should be incorporated into the meat products with other main ingredients
such as fat and salt at optimum levels, which could
achieve the best cooking performance. To overcome the
challenge and obtain ideal combination levels, the
importance of determining the optimum levels of these
replacements in these products comes into prominence.
It is well known that sensory properties of the ground
meat products are closely related with high fat and
moisture retention within the matrix of meat products
(Anderson & Berry, 2001), which could affect the
cooking performance of these products. Therefore,
finding optimum values of some processing variables
that optimise the cooking properties of product will
provide more qualified knowledge to obtain better
products that have desired technological properties. To
achieve this, finding the optimum critical values of the
doi:10.1111/j.1365-2621.2010.02357.x
Ó 2010 The Authors. International Journal of Food Science and Technology Ó 2010 Institute of Food Science and Technology
Cooking properties of patties H. Tekin et al.
processing variables that maximise sensory properties
should be a high priority process. Response surface
methodology (RSM) is an effective tool to find these
optimum levels of the processing variables for the
parameters studied (Hunter, 1959). Ridge analysis
involved with RSM computes the levels of these
processing variables that maximise and minimise the
values of textural and sensory parameters (Chwen-Jen
et al., 1996).
Previous researches have focused on the effects of
non-meat ingredients on sensory, cooking and compositional properties; however, they have not been dealt
with the effects of wheat bran as fat replacers and
extenders on these properties (Dzudie et al., 2004;
Serdaroglu & Degirmencioglu, 2004; Yilmaz, 2004,
2005; Serdaroglu et al., 2005; Serdaroglu, 2006). In
addition, the objectives of these studies were to
determine fat binding and retention ability of these
added ingredients; however, they did not address how
to increase fat and water retention, but still keeping a
satisfactory cooking quality. In other words, these
studies have focused on the effect of individual
processing factors with a one-at-a-time approach on
statistical analysis. Therefore, information on combined effects and interactions of the major processing
factors on cooking properties of the products is
unclear. In addition, no study has appeared to examine
the levels of the processing variables to maximise and
minimise the cooking parameters. Therefore, the objective of this research was to study the effect of
processing variables such as fat (10–30%), wheat bran
(5–15%) and NaCl (0–2%) on cooking properties of
cooked beef patties and to find the levels of processing
variables to maximise and minimise the cooking
parameters.
was kneaded for 15 min by hand to obtain patty dough
divided into fifteen experimental batches (Table 1) that
contained 120 g of ground beef each, with spice mix.
Relevant proportions of ground subcutaneous fat
(10%, 20% and 30%), wheat bran (5%, 10% and
15%) and NaCl (0%, 1% and 2%) were added into
each batch on the top of total weight (120 g) as
presented in Table 1. Each experimental batch was
separated into three equal parts to obtain three patty
samples (weighing approximately 40 g) to conduct
cooking measurements in three replicates for each
experimental batch. Each batch was mixed and
kneaded for additional 15 min to obtain homogeneous
dough batches. Patty dough batches were shaped into
patties with 62.5 mm diameter and 11 mm thickness
using a metal shaper. Then, they were placed on plastic
trays, wrapped with polyethylene film and frozen at
)18 °C until further analysis. For cooking procedure,
patties were thawed at 4 °C overnight in a refrigerator
and cooked in a preheated electric grill set at 170–
190 °C for 4 min on one side, turned over and cooked
for a further 3 min. During cooking, core temperature
of patty batches was monitored by a thermocouple.
The final internal temperature reached over all patty
batches was determined to change between 77 and
82 °C. After cooking, patty samples were allowed to
cool to 25 °C in the room conditions before being
placed in oxygen-permeable bags (low-density polyethylene) and cooking measurements were carried out
in these samples. Wheat bran (moisture 14.1%, protein
13.2%, fat 4.9%, dietary fibre 42.5%, carbohydrate
Table 1 Second-order design matrix used to evaluate the effects of
process variables on cooking properties of patties
Coded variables
Uncoded variables
Materials and methods
Patty preparation
Runs
X1
X2
X3
Subcutaneous
fat (%)
Wheat
bran (%)
NaCl
(%)
The beef samples were prepared as described (Saricoban et al., 2009). Beef was obtained from a local
market in Konya. The M. longissimus dorsi and
M. psoas major muscles were removed from the right
side of the carcass. Muscles were then vacuum-packed
and frozen at )20 °C and stored in dark for a week.
Then, the frozen muscles were placed in a refrigerator
at 4 ± 1 °C for 12 h to facilitate ease of cutting and
grinding. All subcutaneous fat was removed from the
muscles and used as a fat source in the patty
formulation prior to cutting the muscles into cubes
(approximately 2 cm3). The obtained beef cuts and
obtained fat were ground through a 3-mm plate
grinder. The spice mix (ground black pepper 0.1%,
red pepper 2% and cumin 0.4%) and onion (1.5%)
was prepared and added into the ground beef. The mix
1
2
3
4
5
6
7
8
9
10
11
12
13
14
15
0
)1
)1
0
)1
)1
0
1
0
1
0
0
0
1
1
)1
0
)1
1
1
0
0
0
0
)1
0
)1
1
0
1
1
)1
0
1
0
1
0
)1
0
0
0
)1
)1
1
0
20
10
10
20
10
10
20
30
20
30
20
20
20
30
30
5
10
5
15
15
10
10
10
10
5
10
5
15
10
15
2
0
1
2
1
2
1
0
1
1
1
0
0
2
1
X1, coded level of subcutaneous fat (%); X2, coded level of wheat bran
(%); X3, coded level NaCl (%).
Ó 2010 The Authors
International Journal of Food Science and Technology Ó 2010 Institute of Food Science and Technology
International Journal of Food Science and Technology 2010
1981
1982
Cooking properties of patties H. Tekin et al.
20.8% and ash 4.5%) was obtained from a local
market in Konya. The chemical composition of wheat
bran was determined by AOAC (2000) methods:
protein (920.152), fat (920.39), dietary fibre (985.29),
carbohydrate (997.08) and ash (940.26) and by AACC
(1998) method: moisture (44–40).
Cooking yieldð%Þ ¼
Cooked patty weight
Â100
Uncooked patty weight
Shrinkage
Dimensional shrinkage of the patty samples was determined using the following equation (El-Magoli et al.,
1996).
Cooking measurements
Moisture retention
Moisture retention value indicates the amount of
moisture retained in the cooked product per 100 g
Shrinkage (%) ¼
ðRaw thickness À Cooked thicknessÞ þ ðRaw diameter À Cooked diameterÞ
 100
ðRaw thickness þ Raw diameterÞ
of sample and was determined using an equation of
El-Magoli et al. (1996).
Moisture retention (%) ¼
ðPer cent Yield  % Moisture in cooked pattyÞ
100
Fat retention
Fat retention was calculated according to the following
equation by Murphy et al. (1975).
Fat retention (%) ¼
ðCooked weight Â% Fat in cooked patty)
Â100
ðRaw weight  %Fat in raw pattyÞ
Water-holding capacity
The method reported by Ockerman (1985) was used to
measure the water-holding capacity (WHC) of the raw
beef patties. Of patty sample, 0.5 g was placed on the
filter paper (Whatman no. 1, 90 mm Ø, stored over
saturated KCl), which was placed between two plexiglas
sheets and pressed for 20 min by a 1- kg weight. The
area of pressed meat and a spread juice was measured by
a polar planimeter (Placom, Koizumi, Digital Planimeter KP-90 N, Japan), and the WHC was calculated as
follows:
Free water (%) ¼
ðTotal surface area À meat film areaÞðmm2 Þð6:11Þ
Â100
Total moisture ðmgÞ in patty sample
WHC (%) = 100 – Free water
Reduction in thickness and diameter
The reduction in patty thickness and diameter was
determined with a digital calliper (Mitutoyo, Japan)
using the following equations, respectively, as indicated
(Serdaroglu & Degirmencioglu, 2004).
Reduction in thickness(%)¼
ðUncooked patty thicknessÀCooked patty thicknessÞ
Â100
Uncooked patty thickness
Reduction in diameter (%) ¼
ðUncooked patty diamaterÀCooked patty diameterÞ
Â100
Uncooked patty diameter
Cooking yield
Cooking yield of the patty samples were calculated using
the equation by Murphy et al. (1975).
International Journal of Food Science and Technology 2010
Experimental design and data analysis
A 3-factor-3-level Box–Behnken experimental design
(Box & Behnken, 1960) with three replicates at the
centre point was used to study the simultaneous effects
of three compositional variables namely, subcutaneous
fat (10–30%), wheat bran (5–15%) and NaCl (0–2%)
(Table 1). Three levels of each factor or processing
variable (subcutaneous fat, wheat bran and NaCl) were
provided in accordance with the principles of the Box–
Behnken design. Assessment of error was derived from
three replications of one treatment combination (20%
fat, 10% wheat bran and 1% of NaCl) as suggested by
the design (runs 7, 9 and 11, Table 1). Variance for each
factor assessed was partitioned into linear, quadratic
and interactive components to determine the suitability
of the second-order polynomial function and the relative
significance of these components (Lyons et al., 1999).
Ó 2010 The Authors
International Journal of Food Science and Technology Ó 2010 Institute of Food Science and Technology
Cooking properties of patties H. Tekin et al.
These components (processing variables), levels and
experimental design in terms of coded and uncoded are
presented in Table 1. The following second-order polynomial equation of function Xi was fitted for each factor
assessed:
Y ¼ b0 þ
3
X
i¼1
bi Xi þ
3
X
bii X2ii þ
i¼1
3 X
3
X
bij Xi Xj
i¼1 j¼1
i
where Y is the estimated response; B0, Bi, Bii, Bij are
constant coefficients. Xi, Xj, which are defined as the
coded independent variables, are the per cent concentrations of fat, wheat bran and NaCl. For each
parameter assessed, the compositional variables were
divided into linear, quadratic, interactive, lack of fit and
error components to determine the suitability of the
second-order polynomial function and the significance
of variables being assessed. The significance of the
equation parameters for each response variable was
assessed using the F test (Table 2). The analysis was
performed using uncoded units.
The majority of generated models adequately
explain the variation of the responses with satisfactory
R2 values (R2 > 0.90) and non-significant lack of fit,
which indicated that most variations could be well
explained by the quadratic models and can be
considered adequate, because the probability level of
F was P < 0.01 (Thompson, 1982). The computational work, including the surface and contour
graphical presentations of the response surface mod-
els, was performed using a Statistica for Windows
software package (Statsoft, Tulsa, OK, USA). JMP
statistical package software (Version 5.0.1.a; SAS
Institute. Inc., Cary, NC, USA) was used to plot the
bar graphs indicating the scaled estimates for cooking
parameters for representing direction of interaction
and quadratic effects of the processing variables and
to compute the estimated ridges of maximum and
minimum response for increasing radii from the centre
of the original design. Minitab (2000) was used to
analyse the Pearson correlations between cooking
parameters of patty samples.
Results and discussion
Table 2 shows the effects of added fat, wheat bran and
NaCl levels on the cooking properties of the cooked
patties. In addition, Figs 1–4 illustrate these effects as
three-dimensional graphs where direction of the effects
of the processing variables on cooking properties could
be seen. The second-order regression model equations
predicting effects of processing variables are also
included in the figures.
Moisture retention
Table 2 indicates that the linear effects of fat and wheat
bran were significant (P < 0.01 and 0.05, respectively).
Figure 1(a, b) indicates that increasing fat level
decreased (P < 0.01) moisture retention. Similar results
Table 2 Significance of the regression models (F-values) and the effects of processing variables on cooking properties of patties
Source of
variance
Linear
b1
b2
b3
Cross-product
b12
b13
b23
Quadratic
b11
b22
b33
Total error
Lack of fit
Pure error
Total model
R2
DF
Moisture
retention
Fat
retention
Reduction
in thickness
Reduction
in diameter
Cooking
yield
Shrinkage
Water-holding
capacity
1
1
1
14.032a
0.102b
2.943
16.708b
42.038a
0.239
4.099b
15.949
0.009
7.807a
0.367a
0.485
8.413b
0.252a
0.142
6.936b
0.105a
0.651
1.670
0.043a
1.211
1
1
1
27.789a
3.408
11.603b
98.460a
0.019
5.898c
3.625
0.001
1.688
3.188
0.097
1.624
6.655b
0.342
2.139
2.339
0.119
1.224
3.691
0.134
2.652
1
1
1
5
3
2
9
1.226
0.531
3.058
0.228
22.452a
3.006
0.876
23.946a
0.988
2.965
0.147
0.100
2.368
0.449
2.988
2.895
0.641
0.011
0.571
0.969
13.497b
0.956
0.704
1.634
5.970
0.253
2.675
5.684
11.576
0.954
23.583
0.977
5.021
0.900
5.682
0.911
6.004
0.915
5.624
0.910
4.887
0.898
a
Significant at P < 0.01.
Significant at P < 0.05.
c
Significant at P < 0.1.
Subscripts: 1, subcutaneous fat; 2, wheat bran; 3, NaCl.
b
Ó 2010 The Authors
International Journal of Food Science and Technology Ó 2010 Institute of Food Science and Technology
International Journal of Food Science and Technology 2010
1983
1984
Cooking properties of patties H. Tekin et al.
Moisture retention
(b)
(a)
(c)
Fat retention
(e)
(d)
(f)
Figure 1 Effect of (a) subcutaneous fat and
wheat bran, (b) subcutaneous fat and NaCl,
(c) wheat bran and NaCl on moisture retention; (d) subcutaneous fat and wheat bran,
(e) subcutaneous fat and NaCl, (f) wheat bran
and NaCl on fat retention along with the
second-order polynomial model equations
predicting effects of the variables.
International Journal of Food Science and Technology 2010
Ó 2010 The Authors
International Journal of Food Science and Technology Ó 2010 Institute of Food Science and Technology
Cooking properties of patties H. Tekin et al.
Reduction in thickness
(b)
(a)
(c)
Reduction in diameter
(d)
(e)
(f)
Figure 2 Effect of (a) subcutaneous fat and
wheat bran, (b) subcutaneous fat and NaCl,
(c) wheat bran and NaCl on reduction in
thickness; (d) subcutaneous fat and wheat
bran, (e) subcutaneous fat and NaCl,
(f) wheat bran and NaCl on reduction in
diameter along with the second-order polynomial model equations predicting effects of
the variables.
Ó 2010 The Authors
International Journal of Food Science and Technology Ó 2010 Institute of Food Science and Technology
International Journal of Food Science and Technology 2010
1985
1986
Cooking properties of patties H. Tekin et al.
Cooking yield
(b)
(a)
(c)
Shrinkage
(d)
(e)
(f)
Figure 3 Effect of (a) subcutaneous fat and
wheat bran, (b) subcutaneous fat and NaCl,
(c) wheat bran and NaCl on cooking yield, (d)
subcutaneous fat and wheat bran, (e) subcutaneous fat and NaCl, (f) wheat bran and
NaCl on shrinkage along with the
second-order polynomial model equations
predicting effects of the variables.
International Journal of Food Science and Technology 2010
Ó 2010 The Authors
International Journal of Food Science and Technology Ó 2010 Institute of Food Science and Technology
Cooking properties of patties H. Tekin et al.
Water-holding capacity
(a)
(b)
(c)
Figure 4 Effect of (a) subcutaneous fat and
wheat bran, (b) subcutaneous fat and
NaCl, (c) wheat bran and NaCl on waterholding capacity along with the second-order
polynomial model equations predicting
effects of the variables.
were found by Serdaroglu & Degirmencioglu (2004)
and Serdaroglu (2006) in cooked meatballs, who
determined that decreasing fat in meatball formulations
resulted in higher moisture retention. On the other
hand, wheat bran addition increased (P < 0.01) the
moisture retention values (Fig. 1a, c). Yilmaz (2005)
reported that the lowest weight loss, a partial indicator
of moisture loss during cooking, was obtained from
20% (the highest amount tested) wheat bran-added
meatball sample. No significant linear effect of NaCl
on the moisture retention values of the patty samples
was observed (Table 2). Although fat alone had a
decreasing effect on the moisture retention (Fig. 1a, b),
an inverse effect was observed by the interaction between fat and wheat bran, which increased
the moisture retention (Table 2, Fig. 5). However, the
interaction of wheat bran with NaCl decreased the
moisture retention (Fig. 5), which could be because of
the increasing salt levels in its interaction effect. At
higher salt concentration, the protein denaturised,
unfolded and exposure of hydrophobic areas in the
proteins increased, leading to aggregation and loss of
water from the muscle (Thorarinsdottir et al., 2004).
The levels of independent variables that minimise and
maximise the moisture retention were determined by
ridge analysis. Results from ridge analysis, which
computes the estimated ridge of optimum response
for increasing radii from the centre of the original
design (Chwen-Jen et al., 1996), indicated that minimum moisture retention (39.94%) would be at fat =
30.00%, wheat bran = 5.00% and NaCl = 0.77%
w ⁄ w at the distance of coded radius 1.0. Maximum
moisture retention (51.10%) would occur at fat =
10.00%, wheat bran = 15.00% and NaCl = 0.20%
w ⁄ w at the distance of coded radius 1.0. These results
indicate that maximum level of wheat bran but
minimum levels of fat and moderate levels of salt
should be used in the patty formulations to obtain
maximum moisture retention.
Fat retention
Similar results were also determined for fat retention.
Namely, the fat retention of patties decreased with
increases in fat level (P < 0.01) (Fig. 1d, e), which was
consistent with the literature. Serdaroglu & Degirmencioglu (2004) determined that fat retention increased
with decreased fat level in meatball formulation, and
Mansour & Khalil (1999) observed that low-fat patties
retained more fat than high-fat samples during cooking.
In addition, Tornberg et al. (1989) concluded that dense
protein matrix of low-fat ground beef prevented fat
migration. On the other hand, fat retention of patties
increased (P < 0.05) with wheat bran level (Fig. 1d, f).
Ó 2010 The Authors
International Journal of Food Science and Technology Ó 2010 Institute of Food Science and Technology
International Journal of Food Science and Technology 2010
1987
1988
Cooking properties of patties H. Tekin et al.
Figure 5 Scaled estimates for cooking parameters showing the direction of interaction and quadratic effects of the processing variables;
X1 = subcutaneous fat, X2 = wheat bran, X3 = NaCl. Positive- and negative-scaled estimates values indicate the direction of the effects,
increasing and decreasing, respectively.
Fat retention is a complex phenomenon and probably
the result of several chemical and physical mechanisms.
Proteins are considered to be excellent fat binders
International Journal of Food Science and Technology 2010
because they have dual functionality in respect of fat
interactions in which non-polar side chains of proteins
furnish sites for lipid–protein interactions and interfacial
Ó 2010 The Authors
International Journal of Food Science and Technology Ó 2010 Institute of Food Science and Technology