Allocation of optimal distributed generation using GA for minimum system losses in radial distribution networks
Bạn đang xem bản rút gọn của tài liệu. Xem và tải ngay bản đầy đủ của tài liệu tại đây (236.88 KB, 13 trang )
INTERNATIONAL
JOURNAL OF
ENGINEERING,
SCIENCE AND
TECHNOLOGY
www.ijest-ng.com
International Journal of Engineering, Science and Technology
Vol. 2, No. 3, 2010, pp. 94-106
MultiCraft
© 2010 MultiCraft Limited. All rights reserved
Allocation of optimal distributed generation using GA for minimum system
losses in radial distribution networks
T. N. Shukla 1*, S.P. Singh2, K. B. Naik3
*1
Department of Electrical Engineering, Kamla Nehru Institute of Technology, Sultanpur, (U. P.), INDIA
Department of Electrical Engineering, Institute of Technology, Banaras Hindu University, Varanasi (U. P.), INDIA
3
Director, College of Engineering Science and Technology, Lucknow (U. P.), INDIA
*
Corresponding Author: e-mail: , ,Tel. 05362-226278, Mob. +919415962452
2
Abstract
The distributed generation (DG) is one of the viable options for mitigation of problems of load growth, overloading of lines,
quality of supply and reliability in tern extending equipment maintenance intervals and to reduce line losses. However, the line
loss reduction is the obvious parameter easily expressible in terms of system parameters. Therefore, this paper aims to minimize
active power loss by placing DG strategically in a radial distribution system. The problem is formulated as an optimization
problem and solution is obtained using genetic algorithm (GA). The strategic locations are decided on the basis of loss
sensitivity to active power injection at various nodes. This approach helps in reducing the computational efforts of selecting
appropriate location(s). The performance of the method is tested on 33-bus test system and comparison of the results with a
reported method reveals that the proposed method yields superior results. In addition, long term economic benefit of optimal DG
placement is also demonstrated.
Keywords: distributed generation, line loss reduction, optimal location, radial distribution networks.
1. Introduction
Earlier the distribution networks had been designed to convey electrical energy from high voltage transmission networks,
whereby the majority of electrical generation plants were connected, to the customers (Jenkins, 1996). By the addition of
embedded generation plants to distribution networks, voltage profile of the network is improved and energy demand decreases
from the utility network. Also, passive distribution networks are transformed into active networks after embedded units have been
added to them (Ijumba et al., 1999; Milanovic and David, 2002).
Traditionally load growth is forecasted by distribution companies until a predetermined amount is reached, whereby a new
capacity must be added to the network. This new capacity is usually the addition of new substations or expanding existing
substations capacities and their associated new feeders or both. However, the flexibility, technologies, technical & monetary
benefits and concepts of DG planning is challenging this state of matter and gaining credibility as a solution to the distribution
planning problems with the prohibitively high cost of power curtailment in the changing regulatory and economic scenarios and
enhancing DG as an attractive distribution planning option that avoids causing degradation of power quality, reliability and control
of the utility systems (Dugan et al.,2001 and Rackliffe, 2000).
Quinta et al. (1993) and Khator and Leung (1997) reported that the distribution system planning problem is to identify a
combination of expansion projects for the least cost network investment that satisfies load growth requirements without violating
any system and operational constraints. The DG benefits (Daly and Morisson, 2001 and Chiradega and Ramkumar ,2004) are
numerous and the reasons (Jenkisin,2000) for implementing DGs are an energy efficiency or rational use of energy, deregulation
or competition policy, diversification of energy sources, availability of modular generating plant, ease of finding sites for smaller
generators, shorter construction time and lower capital costs of smaller plants and proximity of the generation plant to heavy loads,
which reduces transmission costs. Distributed generation (DG) can offer an alternative planning approach to utilities to satisfy
demand growth and distribution network security, planning and management issues. As DG may provide many benefits for
distribution network operators that can choose where to place it, as well as controlling its operating pattern through peak load
95
Shukla et al. / International Journal of Engineering, Science and Technology, Vol. 2, No. 3, 2010, pp. 94-106
operation, the recognition of DG deferment benefits [by Piccolo and Siano (2009)] may influence the optimal connection of new
generation within existing networks. Brown et al. (1997) suggested that proper siting of DG may defer T&D expansion. Also it is
accepted by many countries in Kyoto Protocol (1997) that the reduction in gaseous emissions (mainly CO2) offered by DGs is
major legal driver for DG implementation.
DG are increasingly becoming an attractive alternative to network reinforcement and expansion for their small size, low
investment cost, modularity and ability to exploit renewable energy sources and due to their high efficiency. Numerous studies
used different approaches to evaluate the benefits from DGs to a network in the form of loss reduction and loading level reduction.
In the optimization process, Díaz-Dorado et al. (2002) proposed to solve MV networks with ring, clasp, and inter-connective
configurations, considering investment and losses costs taking into account the constraints of conductor capacities and voltage
drop. The paper of Mardaneh and Gharehpetian (2004) deals with the task of finding the optimal siting and sizing of distributed
generation (DG) units for a given distribution network to minimize the cost of active and reactive power generation. Celli et al
(2005) proposed a multi-objective formulation based on the application of GA for the siting and sizing of DG resources into
existing distribution networks. They considered the power loss cost and the cost of service interruptions (i.e. number and duration)
as the master objective function. GA based optimization technique (which can give near optimal results), suitable for multiobjective problems like DG allocation with optimal power flow (OPF) calculations has been used by Silvestri et al. (1999). A
hybrid GA-OPF approach was proposed by Harrison et al. (2008) for finding optimal location for connecting a predefined numbers
of DGs in a distribution network. Jabr and Pal (2009) presented an ordinal optimization (OO) method for specifying the locations
and capacities of distributed generation (DG) such that a trade-off between loss minimization and DG capacity maximization is
achieved. Acharya et al (2006) suggested a heuristic method to select appropriate location and optimal value of DG capacity for
minimum real power losses of the system by calculating DG size at different buses. Though the method is effective in selecting
location, it requires more computational effort. The heuristic method used to calculate DG size is based on approximate loss
formula and it may lead to an inappropriate solution.
Size and location of DG are crucial factors in the application of DG for its maximum benefits. In the present work, GA based
technique has been proposed and an attempt has been made to determine optimal DG size for minimization of real power losses in
a radial distribution network and its monetary benefits. The number of candidate locations is decided from the results of loss
sensitivity obtained by injecting real power into the network.
2. Problem Formulation
The installation of DG units at non-optimal places may not result as beneficial as it could have been otherwise. Since the impacts
of distributed generation on system performance depend on system operating conditions and the characteristics of the distributed
generation, it is necessary to use some solutions in planning and operation to attain the best performance. In large distribution
systems to select best place(s) for installation of optimal size DG units is a complex combinatorial optimization problem.
2.1. Selection of Location
In order to reduce the efforts to select appropriate nodes for placement of distributed generation devices a priori, sensitiveness of
nodes towards the change in active power loss with respect to change in active power injection at various nodes are identified. The
loss sensitivity factors at different buses have been evaluated to select appropriate nodes for DG planning by using load flow
program suitable to radial networks suggested by Afsari et al. (2002). These sensitivity factors reflect how the feeder power losses
change if more real power is injected at a particular node and it also allows obtaining the candidate nodes to locate DG.
Loss sensitivity factors are evaluated for the base case first to decide the first appropriate location. In order to select next
candidate location(s), successive sensitivity analysis (computation of loss sensitivity of various buses taking into account the
previously selected location(s) at which DG could be placed) has been used. This process is repeated till optimum number of
locations is ascertained. The optimal number of locations is that number of buses which gives maximum benefits (saving) for
optimal size DGs placed at selected locations. The expression for line losses describe by Elgard (1971) has been used for the
purpose. The change in active power loss of the system due to change in active power injection at a node is expressed as
∂ PLoss
∂ Pi
=
2 ∑ (α ij Pi − β ij Q i )
n
(1)
j =1
2.2. Loss Minimization
Among the many benefits of distributed generation, reduction in system line losses is one of them. Nevertheless, reactive power
loss is obviously not less important. This is due to the fact that reactive power flow in the system needs to be maintained at a
certain amount for sufficient voltage level. Consequently, reactive power makes it possible to transfer real power through
transmission and distribution lines to customers. Normally, the real power loss draws more attention for the utilities, as it reduces
the efficiency of transmitting energy to customers. System loss reduction by strategically placed DG along the network feeder, can
be very useful if the decision maker is committed to reduce losses and to improve network performance (e.g. on the level of losses
and/or reliability) maintaining investments to a reasonable low level. This feature may be very useful in case of revenue recovered
96
Shukla et al. / International Journal of Engineering, Science and Technology, Vol. 2, No. 3, 2010, pp. 94-106
by distribution company (DISCO) which is not only based on the asset value but also on network performance. So in the present
work, real power injection at selected location(s) through DGs is considered to achieve the objective.
An established loss formula; Elgard (1971) based on loss coefficients α and β is represented in Eq. (2) and has been used for the
calculation of real power loss in the present work.
PLoss =∑∑ α ij (Pi Pj + Qi Q j ) + β ij (Qi Pj − Pi Q j )
n
n
(2)
i =1 j =1
The objective function is to minimize the active power loss using Equation (10) and formulated as to
Minimize
LN
∑ Loss
=
PLoss
k =1
(3)
k
Subject to
n
∑P
i =1
Gi
n
≤∑
i =1
(Pi
+ PLoss )
(4)
V i min ≤ V i ≤ V i max
(5)
≤ Ii
(6)
Ii
j
j
scheduled
2.3. Demand Curve
Energy losses are usually accounted per year. Since constant loading condition of a distribution system is not realistic and
variation of load demand can also not be predicted, load duration curve can be constructed using the demand curve data and can be
approximated in discrete levels. Day to day demand curves vary as per the demand of loads. Seasonal variations, social
commotion, economic and environmental aspects also dictate the changes in demand curve. Since the final solution depends on
proper choice of demand curve, a careful analysis is required. In order to achieve the objective, a steady demand curve is
considered in this work wherein annual demand curve is approximated by 360 daily demand variation curves and is used to
compute energy loss. The piecewise linear load duration curve is assumed to include the effect of varying loads () and is divided
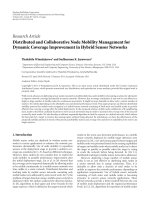
into three load levels as average (L1), base (L2) and peak load (L3) conditions of 62.5%, 100% and 125% of scheduled system
loads of duration 1000 hrs, 6760 hrs and 1000 hrs respectively as shown in Figure 1and the these description with the base case
loss and the lowest voltage are also shown in Table 1.
All the individual buses demand curves are considered identical to the demand curve taken at substation. This assumption is
really necessary because individual demand curves for each bus are rarely available. In addition, this assumption does not interfere
in the result significantly, especially when the feeder supplies many loads and the influence area is homogenous like a residential,
commercial, rural or industrial area.
Table1: Duration of various load levels and other details for the considered systems
Load Levels
Load level
Duration time(Hrs)
Loss without DG (kW)
Lowest voltage │V│
L1
0.625
1000
79.8824
0.9443
L2
1.00
6760
216.00
0.9078
L3
1.25
1000
351.506
0.8820
97
Shukla et al. / International Journal of Engineering, Science and Technology, Vol. 2, No. 3, 2010, pp. 94-106
Load
Le ve l
L3
L2
L1
T1
T2
T3
T im e
Figure 1: Approximated Load –Duration Curve
3. Genetic Algorithm
Genetic Algorithm simulates the biological processes that allows the consecutive generations in a population to adapt to their
environment. Genetic Algorithms are unconstrained optimization methods, which model the evolutionary adaptation in nature.
They work with a population of solutions and create new generations of solutions by appropriate genetic operators. In depth
description of the method is not provided here as GA has been applied in several problems and excellent texts; Goldenberg (1989)
and Kalyanmoy Deb (1995), are available. However, its implementation for DG allocation problem is delineated in following
sections.
GA is effective parameter search techniques. They are considered when conventional techniques have not achieved the desired
speed, accuracy or efficiency. GA is different from conventional optimization and search procedures in the following ways.
• GA work with coding of parameters rather than the parameters themselves.
• GA search from a population of points rather than a single point.
• GA use only objective functions rather than additional information such as their derivatives.
• GA use probabilistic transition rules, and not deterministic rules.
Following are the advantages of GA.
• They require no knowledge of gradient information about the response surface.
• They are resistant to becoming trapped in local optima therefore can be employed for a wide variety of optimization
problems.
• It can quickly scan a vast solution set.
• Bad proposals do not affect the end solution negatively as they are simply discarded.
• It doesn't have to know any rules of the problem - it works by its own internal rules.
For the advantages of parallel searching, robust searching, and searching mechanism based on the principle of natural evolution,
genetic algorithm has found applications in many areas and has become one of the most successful optimization algorithms. The
GA become particularly suitable for the problem posed here due to above mentioned features.
3.1. Coding Strategy
It is expected that the GA should produce optimal values of active power to be injected from the DG installed at appropriate
location(s) in the network. Since the solution variables are coded in binary form in GA implementation, it becomes imperative to
represent solution variables (i.e. DG values in present study) in binary coded form. The coding of active power to be injected in the
system at the candidate buses through DGs is done in binary form using 12 binary bits for single location to take care of real power
capacity of 4096 kW available at the source node (substation) of example test system discussed in section 5. These 12 bits would
get repeated as many times as the number of locations in case of more than one location.
3.2. Fitness Function
The fitness function in GA implementation plays a major role and generally expressed in terms of objective function to be
optimized. Since in the present work, objective function is to minimize active power loss, the fitness function is defined as the
inverse of objective function.
98
Shukla et al. / International Journal of Engineering, Science and Technology, Vol. 2, No. 3, 2010, pp. 94-106
3.3. Selection of GA parameters
Selection of appropriate GA parameters is crucial for its faster convergence. In absence of any guide line to choose these
parameters, some mechanism has to be devised. However, the types of crossover and mutation are based on user choice. In present
implementation, one point crossover and constant mutation types have been chosen. In order to quantify the values of crossover
and mutation probabilities, effect of variations in mutation probability at fixed value of crossover probability and crossover
probability at fixed value of mutation probability on convergence properties have been studied and demonstrated in Figure 2 and
Figure 3. The population size and number of generations for these studies have been chosen to be 100 and 50 respectively. It can
be observed from Figure 2 that the mutation probability of 0.001 appears to be the most suitable as objective function value
declines fast and attains lowest value at the earliest compared to other values of mutation. With this value of mutation probability,
convergence properties at various crossover probabilities were plotted as shown in Figure 3. The best performance was found at
0.85 crossover probability. Therefore the final value of crossover and mutation probabilities was chosen 0.85 and 0.001
respectively for the present studies. In order to confirm the suitability of chosen value of population size, the performance was
further studied at various values of population size at cross over and mutation probabilities 0.85 and 0.001 respectively and best
performance was observed at population size of 100. Therefore, this combination of 100, 50, 0.85 and 0.001 respectively for
population size, number of generations, crossover probability and mutation probability was taken as the final value for further
studies.
99
Shukla et al. / International Journal of Engineering, Science and Technology, Vol. 2, No. 3, 2010, pp. 94-106
3.4. GA Implementation
The GA technology is particularly suitable for the solution of combinatorial optimization problems. The advantages of using GA
are that they require no knowledge of gradient information about the response surface; they are resistant to becoming trapped in
local optima and can be employed for a wide variety of optimization problems. The GA methodology discussed above is
implemented using following steps.
Step 0: Initialized number of locations to unity.
Step 1: Determination of candidate locations:
•
•
•
•
Input the distribution system branch impedances and complex bus powers.
Determine the sensitivity factors.
Arrange the buses in descending order of their sensitivities.
Bus at the top is selected as the present location for DG placement.
Step 2: Input genetic algorithm control data.
Step 3: Initialize population with random strings and copy into mating pool.
Step 4: Do while generation number is less than maximum number of generation taken
•
Do while population number is less than population size
•
Pick up the string corresponding to population number from mating pool and decode it into test configuration
•
Apply load demand
•
Call distribution load flow solver
•
Check voltage constraints
•
Compute fitness function
•
Increment population number by one
•
Use mating pool to create new population for next generation
•
Carry out reproduction, cross over and mutation in mating pool
•
Increment generation number by one
Step5: Obtain desired solution i.e. optimal DG size, minimum system loss and savings
Step 6: If the saving is more than the previous value, increment number of locations by one. Otherwise go to step 7.
Step 7: Stop
4. Results and Discussion
4.1. System and other details
Effectiveness of the proposed methodology is tested on the widely used 33 bus-32 branch test system at different loading
conditions. The system data for this system has been taken from Kashem et al (2000). The active power (sum of total connected
load and the base system losses) at the source node in the beginning of the period is about 3936 kW. The entire algorithm has been
written in Visual C++ language and implemented on dual core 2.56 MHz, 1 GB PC. In order to demonstrate the long term impact
of DG, planning period of 10 years have been considered with a uniform load growth of 2.5% per year and maintaining same
configuration of the network. DG sources are assumed to be always available throughout the planning period.
The cost benefits of optimally allocated DG for a utility are explained by a reduction in the energy bought by the amount
produced by the DG units. This also implies a reduction in losses and saving in energy that the utility avoids buying from large
generators because of self production. The cost of DG generated power of US $30.00 per kW has been arbitrarily taken for this
study which includes capital cost of DG with installation, operation and maintenance cost. The generation cost may be low
however, it can be considered appropriate for demonstration of the effectiveness of the methodology in terms of energy savings.
The rate of energy cost has been considered equal to US $0.05 per kWh for the cost benefit analysis. It should be highlighted that
in presence of liberalized electricity market, different retail sales rate of the energy produced by a DG unit should be considered.
These retail sales depend on the technology adopted (mini gas turbine, CHP, wind turbine, etc.), the regulatory actions and the
willingness to harness renewable energy.
Energy saving cost (ESC) has been calculated as the difference of energy loss cost without DG and the energy loss cost with DG
for variable loads (ELC) and the monetary benefits are calculated as a difference of ESC and the DG cost which includes cost of
DG and its installation, and the expenditure incurred towards their operation & maintenance.
100
Shukla et al. / International Journal of Engineering, Science and Technology, Vol. 2, No. 3, 2010, pp. 94-106
The base case loss sensitivity results of six most sensitive buses arranged in descending order are shown in Table 2 for the
system studied. Although this paper aims to illustrate technical and economic benefits of DG allocation at multiple locations, the
demonstration deals with single location case also in order to compare it with results reported in literature by Acharya (2006).
4.2. Discussion
Bus no. 6 being the most sensitive mode as seen in Table 2, is selected as first candidate location for DG placement in this
system. The same node has also been selected as the most suited location by Acharya (2006) using heuristic method. Results of
DG capacity, loss reduction and energy savings are reported in Table 3 for proposed and heuristic methods. Acharya et al. (2006)
reported the base case system loss of 211.20 kW is based on an approximate load flow method “Distflow” used by the authors.
However, this value was found to be 216. 00 kW using backward sweep power flow method and the same is shown in Table 3 for
fair comparison. The optimal DG size of 2380 kW was obtained by proposed method whereas 2490 kW has been reported by
Acharya (2006). The system loss dropped from 216 kW to 132.83 kW in heuristic method and 132.64 kW in proposed method. It is
to be noted that the evaluated DG capacity is much less than the reported in heuristic method with higher loss reduction though
marginal. It can also be seen that the energy savings obtained for one year by proposed method is $36511.68 while it is $36428.46
by heuristic method.
Table 2: Sensitivity Analysis Results
Bus No.
Sensitivity values
6
0.06779
2
0.0670792
5
0.0664193
20
0.0573545
8
0.0537697
7
0.0476795
Table 3: Summary for 33 bus system with rated loads for Single location
Methodology
Heuristic 13]
Proposed GA
Optimal
location
6
6
DG size
(kW)
2490
2380
Power Loss(in KW)
Without
With
DG
DG
216.00
132.83
216.00
132.64
Loss
reduction
(kW)
83.17
83.36
Energy
Savings ($)
36428.46
36511.68
In order to study the effect of DG installation in radial network, an attempt has been made to place DG at more than one location
(multiple locations). The next location has been decided on the basis of successive sensitivity explained in section 2.1. Following
this procedure, bus no. 8 was found to be the next location for allocating DG at two locations. The GA produced DG value of 1718
kW and 840 kW at buses 6 and 8 respectively. Proceeding in this manner, analysis was carried out up-to four locations considering
the variable loads and results are shown in Table 4. It can be seen from this table that the line loss decreases as the number of
locations increases. However, amount of decrease in line loss reduces in successive locations. The saving in energy cost (ESC)
follows the reverse trend. It increases with increase in number of locations but at higher number of locations this increase is
marginal. Since marginal reduction in loss and marginal increase in energy saving cost was observed when the number of locations
was increased to four, further increase in number of locations were not considered.
Optimal values of DG to be placed for various loading conditions were obtained using proposed technique. Effect of variations
in number of locations on DG values for three considered loading conditions are also tabulated in Table 5. It is observed that the
losses reduce at all load levels with the improved voltage profile as the number of locations increase. The value of loss reduction
becomes smaller and smaller as the number of locations increase which can be seen from Table 5.
Table 4: Effect of no. of locations on DG size, losses, voltage profile and one year ELC, ESC
No. of
location
Losses (kW) at various
load levels
L1
L2
L3
Lowest Voltage (p. u.)
Cost of Energy Loss (ELC) in $
Cost of Energy Saving (ESC) in $
1
(6)
41.9792
132.64
177.863
0.934575
48500.00
46108.00
2
(6,8)
36.701
96.58
153.986
0.94195
42178.34
52429.66
3
(6,8,20)
28.4856
76.301
123.63
0.943189
33395.52
61212.48
4
(6,8,20,24)
27.8815
67.7772
113.667
0.945094
29986.119
64621.881
Another advantage of improvement in voltage profiles due to installation of DG (at the end of planning period of 10 years) has
also been demonstrated in Table 5. One can see the variation in voltage profile at various loading conditions with the variation in
101
Shukla et al. / International Journal of Engineering, Science and Technology, Vol. 2, No. 3, 2010, pp. 94-106
number of locations. It can be very well understood that the voltage profiles get improved as the number of locations increases.
This increase has been observed from 0.8820 p. u. (without DG) to 0.9451 p. u. (with DG placed at four locations) at peak load
level (L3).
It can further be observed that the values of loss reduction reduced by 0.381kW, 0.921kW and 1.550kW at load levels L1, L2 &
L3 respectively when number of locations was increased from three to four while the corresponding values of loss reduction when
number of locations was increased from one to three can be observed equal to 9.3952 kW, 46.889 kW and 41.294 kW respectively.
It suggests that the loss reduction reduces as the number of locations increases and beyond certain number of locations, the loss
reduction may cease. However, the limiting number is decided on the basis of economic benefits as discussed in the next section.
DGs installed ones will remain in system as long as their performance is satisfactory. Thus the money invested once on DG will
help investor to harness its benefit throughout its life. Although the systems losses reduce as the number of DG at various locations
increase, the investment on DG also increase. Thus the reduction in cost of energy loss is achieved at additional investment on DG
and investor can be only benefited as long as saving is more than investment. Therefore, there must be some limit on number of
DG beyond which it may be uneconomical.
In order to investigate this limit, economic analysis has been performed. The benefit achieved was obtained with varying loads
and varying number of DG locations. Considering the load growth of 2.5% per year, the loads at peak loading condition have risen
to about 1.5 times the base case loading of the considered system at the end of 10 year planning period. The results of energy loss
cost (ELC) and the benefits in US$ are shown in Figure 4. It can be seen that the benefit increases if the number of locations is
increased from one to three. However, the value of the benefit (compensation) gets reduced beyond three no. of locations.
To assess the speed of GA for the solution of present problem for the DG placed at multiple locations, computational time was
also recorded and has been plotted in Figure 5 for one year and ten year planning periods. It can be observed that the
computational time increases with increase in locations but there is marginal increase in time for ten years planning period
compared to one year period.
Table 5: Effect of optimally located DG on DG size, losses and voltage profile for different locations
No. of
locations
one
Two
Three
four
Load
Levels
L1
L2
L3
L1
L2
L3
L1
L2
L3
L1
L2
L3
6
1581
2380
3293
1060
1718
2047
897
1536
1882
889
1391
1839
DG Size (kW) at bus no.
8
20
511
840
1111
511
599
846
946
1023
1280
516
189
896
298
1057
373
28
593
956
1216
Losses
(kW)
41.979
132.64
177.86
36.695
96.58
153.99
32.584
85.751
136.57
32.203
84.830
135.02
Lowest
voltage (p .u)
0.964421
0.934575
0.908954
0.97167
0.96639
0.94195
0.972824
0.955147
0.943189
0.96981
0.95974
0.945094
102
Shukla et al. / International Journal of Engineering, Science and Technology, Vol. 2, No. 3, 2010, pp. 94-106
4. Conclusions
Placement of DG in radial distribution network has been demonstrated in this paper. The appropriate location of DG had been
decided on the basis of sensitivity of active power loss with respect to real power injection through DG. In case of multiple
locations, successive sensitivity had been made use of using same algorithm. The problem is formulated as an optimization
problem with minimization of real power loss (hence evaluation of monetary benefits) subject to equality and inequality
constraints and solved for optimal value of DG using GA. It is demonstrated that the benefit increases with increase number of
locations within certain locations beyond which it is uneconomical. Significant improvement in voltage profile as an additional
advantage of optimal DG placement has also been observed and demonstrated.
Nomenclature
r
R(= rL )
L
LN
Loss
k
LossSG
System resistance per unit length,
Total resistance of the line,
Total length of the line,
Number of line sections,
Real power loss in section k,
Line loss from source to DG location,
103
Shukla et al. / International Journal of Engineering, Science and Technology, Vol. 2, No. 3, 2010, pp. 94-106
Loss GL
Line loss from the location of DG to load
Pi and Qi
PGi and QGi
PLoss
N
Real and reactive power demands at i bus respectively,
Real and reactive power generation by DG placed at bus i respectively,
System real power loss,
Number of buses,
I ij
scheduled
th
Current carrying capacity of line section connected between nodes i and j .
V i And δ i
voltage magnitude and angle at ith bus respectively.
Vi min , Vi max
Acceptable voltage limit at bus i
System phase voltage,
VP
Z ij = rij + jx ij ; i j th Elements of [Z BUS ] matrix
α ij , β ij are the loss coefficients represented as
α ij = ri j cos(δ i − δ j ) / ViV j
β ij = ri j Sin (δ i − δ j ) / ViV j
Appendix
A.1 Loss Saving Analysis
Loss savings are classified as either capacity or energy loss savings. Capacity loss savings reduce load on T&D and generation
system equipment. This lessens the need for capital upgrades. They are calculated by developing feeder and transformer loss
savings equations and evaluating them during peak load conditions. Energy loss savings reduce electricity generation
requirements. Their value is the cost savings realized by reducing operation and maintenance expenses of existing plants.
A.2 System Modeling
This section focuses on line loss reduction analysis. In this study, one-concentrated load is assumed at the end of the line. With
the introduction of DG, line loss reduction can be expected. This factor is analyzed, quantified and presented in this paper for
multiple locations of the DG along the feeder.
Two simple radial systems are considered:
i) System without DG
ii) System with the inclusion of DG.
Both systems have a concentrated load at the line end. The total length of the line is assumed to be L km. Schematics of the two
cases are shown in Figure A.1 and Figure A.2.
Figure A.1: A simple radial distribution system without WTG.
For the system with DG, the location of DG is assumed to be G km from source.
104
Shukla et al. / International Journal of Engineering, Science and Technology, Vol. 2, No. 3, 2010, pp. 94-106
Figure A.2: Schematic of a radial system with the inclusion of DG.
The following assumptions are made in the study:
1) Load is Y-connected; line current is the same as phase current; IL = IP
2) Load absorbs real power at some specified power factor
3) DG produces real power at a lagging or leading or unity power factor
4) VP is the RMS load phase voltage. VP is the reference phasor.
The load complex power is SL = PL + jQL, therefore, the current absorbed by the load is
IL =
(P L
− jQ L
3V P
)
(A.1)
A.3 Line Loss Reduction Analysis
Electrical line loss occurs when current flows through transmission and distribution systems. The magnitude of the loss depends
on amount current flow and the line resistance. Therefore, line loss can be decreased by reducing either line current or resistance or
both. If DG is used to provide energy locally to the load, line loss can be reduced because of the decrease in current flow in some
part of the network.
The real power injection at a bus i, Pinj ,i considered here as the difference between real power generation and the real power
demand at that bus, and can be expressed as
P inj
= P Gi − P i
,i
(A.2)
From the schematic of the system shown in Figure 1, instantaneous base case losses for a three-phase system can be expressed as
Loss
(B )
=
(
r L Pi 2 + Q
3 V P2
2
i
)
(A.3)
Now in case of line loss with DG, assuming that the line is short, voltage drop along the line is neglected. Schematic of this
system is shown in Figure 2.
The output current of DG supplying complex power {SGi = PGi + jQGi} is given by
⎛ P − jQ Gi ⎞
(A.4)
⎟
I
= ⎜ Gi
G
⎜
⎝
3V
P
⎟
⎠
The line loss with the integration of DG is a combination (sum) of two parts:
i)
Line loss from source to the location of DG.
ii)
Line loss from DG location to the location of load.
In presence of DG (Figure A.2), the feeder current IS will be the difference of load current IL and DG output current IG. The line
loss from source to DG location can be expressed as
Loss SG = rG
rG ( P 2 + Q 2 + P 2 + Q 2 − 2 P P − 2 Q Q )
L
L
G
G
L G
L G
3V 2
P
(A.5)
Again, the line loss from the location of DG to load ( Loss GL ) will be
Loss
GL
=
r ( L − G ) ( P L2 + Q L2 )
3V P2
(A.6)
The total line loss ( Loss( AT ) ) in presence of DG placed at a ‘X’ distance from the source can be calculated by combining
Equations (A.5) and (A.6) and expressed as
105
Shukla et al. / International Journal of Engineering, Science and Technology, Vol. 2, No. 3, 2010, pp. 94-106
Loss ( AT ) =
R
2
3V P
⎡ 2
⎢ Pi
⎣
(
2
2
2
+ Q i + PGi + Q Gi − 2 Pi PGi − 2 Q i Q Gi
) ⎛⎜ X ⎞⎟⎤⎥
⎝ L ⎠⎦
(A.7)
Instantaneous loss savings (LS) at any point on a feeder can be represented as the difference between losses without DG and
losses with DG.
LS = Loss (B) - Loss (AT).
Hence,
LS =
(
RX
2 Pi PGi + 2 Q i Q Gi − PGi2 − Q Gi2
3V P2 L
)
(A.8)
The positive sign of LS indicates that system loss reduces with the integration of DG but the negative sign implies that DG
causes higher loss in the system.
References
Acharya N., Mahat P., Mithulanathan N., 2006. An analytical approach for DG allocation in primary distribution network, Electric
Power and Energy Systems, Vol. 28, pp. 669-678.
Afsari, M., Singh, S.P. , Raju, G.S. and Rao, G.K. 2002. A fast power flow solution of radial distribution networks, Electric
Power Components and Systems (USA), Vol. 30, No.10, 1065-1074.
Brown R.E., Pan J., Feng X., and Koutlev K., 1997. Siting distributed generation to defer T&D expansion, Proc. IEE. Generation,
Transmission and Distribution, Vol. 12, pp. 1151- 1159.
Chiradeja P., Ramakumar R. 2004. An approach to quantify the technical benefits of distributed generation, IEEE Transactions on
Energy Conversion, Vol. 19, No. 4, pp. 764-773.
Celli G., Ghiani E., Mocci S., and Pilo F., 2005. A multiobjective evolutionary algorithm for the sizing and siting of distributed
generation, IEEE Transactions on Power Systems, Vol. 20, No. 2, pp. 750-757.
Dugan R.C., McDermott T.E. and G.J. Ball 2001. Planning for distributed generation, IEEE Industrial Application Magazine, Vol.
7, pp. 80-88.
Daly P.A., Morrison J. 29 April – 1May 2001. Understanding the potential benefits of distributed generation on power delivery
systems, Rural Electric Power Conference, pp. A211 – A213.
Diaz-Dorado E., J. Cidras, E. Miguez 2002. Application of evolutionary algorithms for the planning of urban distribution networks
of medium voltage, IEEE Transaction on Power Systems, Vol. 17, No. 3, pp. 879-884.
Elgerd O.I., 1971. Electric energy system theory: an introduction, McGraw- Hill Inc.
Goldenberg D. E. 1989. Genetic Algorithm in Search, Optimization and Machine Learning: Addition-Wesley Publishing Co. Inc
Harrison G.P., Piccolo A., Siano P., Wallace A.R. 2008. Hybrid GA and OPF evaluation of network capacity for distribution
generation connections, Electrical Power Energy System, Vol. 78, pp. 392–398.
Ijumba NM, Jimoh AA, Nkabinde M (1999). Influence of Distribution Generation on Distribution Networks Performance,
Proceeding of AFRICON ’99, 2: 961-964.
Jenkins N (1996). Embedded Generation-Part 2, IEE Power Engine. J., pp. 233-239.
Jabr, R. A., Pal, B. C. 2009. Ordinal optimization approach for locating and sizing of distributed generation, IET proceedings
Generation, Transmission & Distribution, Vol. 3, No. 8, pp 713 – 723.
Khator K. and Leung, L.C. 1997. Power distribution planning: A review of models and issues, IEEE Transaction on Power
Systems, Vol. 12, No. 3, pp.1151-1159.
Kyoto Protocol to the United Nations Framework Convention on climate change, Dec.1997.
Kalyanmoy Deb, 1995. Optimization for engineering design: Algorithm and Examples: Prentice Hall of India Ltd., New Delhi.
Kashem M. A., Ganpathy, V., Jamson, G.B., Buhari, M. I. 2000. A novel method for loss minimization in distribution networks,
Proc. International Conference on Electric Utility Deregulation and Restructuring and Power Technologies, pp. 251-255.
Mardaneh, M., Gharehpetian G. B..2004, Siting and sizing of DG units using GA and OPF based technique, TENCON. IEEE
Region 10 Conference, Vol. 3, pp. 331-334, 21-24.
Milanovic JV, David TM (2002). Stability of Distribution Networks with Embedded Generators and Induction Motors,
Proceeding of the IEEE PES Winter Meeting, 2: 1023-1028.
Piccolo, A. Siano, P. 2009. Evaluating the impact of network investment deferral on distributed generation expansion, IEEE
Transactions on Power System, Vol. 24 No. 3, pp 1559 – 1567.
Quintana V.H., Temraz H.K., Hipel K.W. 1993. Two stage power system distribution planning algorithm, Proc. IEE Generation,
Transmission and Distribution, Vol. 140, No. 1, pp. 17-29.
Rackliffe G. 2000. Guidelines for planning distributed generation systems, Proc. of IEEE Power Engineering Society Summer
Meeting, vol. 3. Seattle (WA, USA): pp1666-1667.
Silvestri A., Berizzi, S., Buonanno, 1999. Distributed generation planning using genetic algorithms, Electric Power Engineering,
Power Tech Budapest 99, Inter. Conference, pp.257.
106
Shukla et al. / International Journal of Engineering, Science and Technology, Vol. 2, No. 3, 2010, pp. 94-106
Biographical notes:
T. N. Shukla was born in India in 1955. He received his B.E. and M.E. in Electrical Engineering from Allahabad University in 1976 and 1981 respectively.
Presently he is pursuing his Ph. D. from UP Technical University, Lucknow. He joined the Electrical Engineering Department at Kamla Nehru Institute of
Technology, Sultanpur, as lecturer in 1982 where he is presently serving as Professor. He is currently pursuing his Ph.D. from U.P. Technical University, Lucknow.
His main research interests are in optimal operation and AI applications to power distribution systems.
S. P. Singh was born in India in 1957. He received his B.E. and M.E. in Electrical Engineering from Allahabad University in 1978 and 1981 respectively. He
obtained his Ph.D. from Banaras Hindu University in 1990.He was Post Doctoral scholar at University of Calgary, Canada during 1993-94. He joined the Electrical
Engineering Department of Banaras Hindu University as faculty in 1981 where he is presently serving as Professor. His main research interests are in secure and
optimal operations of power systems, deregulation, distribution automation and AI applications to power systems. Dr. Singh is a Fellow of Institution of Engineers
(India), Senior Member of IEEE and life member of Systems Society of India.
K.B.Naik was born in India in 1947. He received his B.E. from Kanpur University and M.E. from Nagpur University in Electrical Engineering. He obtained his
Ph.D. from Kanpur University in 1984. He joined the Electrical Engineering Department at Kamla Nehru Institute of Technology, Sultanpur, as professor in 1986
and served as professor till Jan. 2007. He has also been the Director of the institute for about six years. After retirement of his service, presently he is serving as the
Director of College of Engineering, Sciences and Technology, Lucknow (UP), India. His main research interests are in optimal operation, power electronics and AI
applications to power distribution systems.
Received December 2009
Accepted March 2010
Final acceptance in revised form March 2010