(SPE 89414 MS) A Simple Approximate Method to Predict Inflow Performance of Selectively Perforated Vertical Wells
Bạn đang xem bản rút gọn của tài liệu. Xem và tải ngay bản đầy đủ của tài liệu tại đây (547.86 KB, 11 trang )
SPE 89414
A Simple Approximate Method to Predict Inflow Performance of Selectively Perforated
Vertical Wells
E. Guerra, SPE, and T. Yildiz, SPE, Colorado School of Mines
Copyright 2004, Society of Petroleum Engineers Inc.
This paper was prepared for presentation at the 2004 SPE/DOE Fourteenth Symposium on
Improved Oil Recovery held in Tulsa, Oklahoma, U.S.A., 17–21 April 2004.
This paper was selected for presentation by an SPE Program Committee following review of
information contained in a proposal submitted by the author(s). Contents of the paper, as
presented, have not been reviewed by the Society of Petroleum Engineers and are subject to
correction by the author(s). The material, as presented, does not necessarily reflect any
position of the Society of Petroleum Engineers, its officers, or members. Papers presented at
SPE meetings are subject to publication review by Editorial Committees of the Society of
Petroleum Engineers. Electronic reproduction, distribution, or storage of any part of this paper
for commercial purposes without the written consent of the Society of Petroleum Engineers is
prohibited. Permission to reproduce in print is restricted to a proposal of not more than 300
words; illustrations may not be copied. The proposal must contain conspicuous
acknowledgment of where and by whom the paper was presented. Write Librarian, SPE, P.O.
Box 833836, Richardson, TX 75083-3836, U.S.A., fax 01-972-952-9435.
Abstract
This paper presents an approximate model to forecast the
productivity of selective perforated wells. The model includes
algebraic equations and it could be easily computed using a
programmable calculator or spreadsheet program. The model
has been compared against the rigorous 3D semi-analytical
model and software existing in the literature. The approximate
model compares well against the 3D model and the software.
The model is useful for designing perforation parameters.
Introduction
Oil and gas wells are generally perforated at multiple intervals
along the well trajectory. The principal objective of
perforating is to open flow channels across the casing for
formation fluid entry. The well completed with perforations at
multiple segments along the wellbore are referred to as the
selectively perforated well (SPW).
The productivity of the wells is controlled by the well
completion type and formation damage. Formation damage is
the result of the permeability impairment in the near wellbore
region. Formation damage decreases the well productivity.
The influence of formation damage is localized in the near
wellbore region. The formation damage effect is quantified in
terms of the mechanical skin factor, s d .
In openhole completed vertical wells, the complete
formation produces uniformly and the specific productivity
index is constant along the wellbore. On the other hand, the
selective perforating results in multiple flow convergence
regions along the wellbore. This disturbance in the flow
pattern makes flow modeling considerably more difficult. The
impact of selective perforating may be quantified in term of
completion pseudoskin. Similar to the formation damage
effect, the influence of the well completion is intensified in the
near wellbore region. Therefore, the well flow models have to
account for not only the individual impact of the formation
damage and well completion but also the dynamic interaction
between them in the near wellbore region.
The compounded effects of the well perforating and
formation damage are expressed in terms of total skin factor,
s t . Given the total skin factor, the steady state pressure drop
in the perforated wells could be expressed as
p e − p wf =
141.2 q sct µ Bo
[ ln ( re / rw ) + s t ] ........... (1)
kh
If the well produces from a non-radial reservoir under
pseudo steady state flow conditions then the pressure drop
equation is given as
141.2 q sct µ Bo 1
2.2458 A
~
[
ln (
) + s t ] (2)
p − p wf =
2
kh
C A rw2
The flow equations expressed in Eqs. 1 and 2 are simple
and straightforward provided that the total skin factor is
accurately related to the perforating parameters and the
formation damage based skin factor.
Background
In this section, we would like to review the most relevant
studies in the literature and set the ground for the model
development.
Partially Completed Wells. In partially completed or
penetrated wells (PCW), only a single segment along the
wellbore is open to flow. The completed segment is
considered to be barefoot. Partial penetration forms a twodimensional (2D) flow field in the formation around the
wellbore.
The effect of partial penetration on well productivity has
been investigated in details.1-8 Brons and Marting1 observed
that the partial penetration generates a pseudo damage
reducing the well productivity. The others have confirmed that
an additional pressure drop is created by the partial penetration
effect.2-8 The additional pressure drop is measured in terms of
partial penetration pseudoskin, s pp . Graphical results1,
analytical solutions2,3, numerical solutions4,5, and empirical
equations6-8 have been proposed to compute the pseudoskin
resulting from partial completion. Among these different
2
SPE 89414
methods, the empirical equations proposed by Odeh6,
Papatzacos7, and Vrbik8 are the most popular due to their
simplicity. The analytical solutions are not usually preferred
because of their infectivity with infinite series and special
functions. We have compared the empirical methods against
the analytical solutions. It has been observed that the results
from the Vrbik method and analytical solutions match very
well.9 The Vrbik method was chosen to build the approximate
model described in this paper. The Vrbik model for partial
penetration pseudoskin is recaped in Appendix A.
It should be noted that partially penetrating well models
assume that the open interval allows fluid entry at every point
on wellbore surface. The partial penetration pseudoskin does
not account for formation damage or additional flow
convergence due to perforations and slots.
The simultaneous effects of formation damage and partial
penetration have been modeled using analytical and numerical
techniques.3-5 It has been observed that formation damage
results in a greater productivity loss in partially penetrating
wells. The total skin factor combining the individual
contribution of formation damage and partial penetration is
given as below.
st =
h
s d + s pp ........................................................... (3)
hp
where sd is the formation damage skin factor formulated by
Hawkins.10
s d = ( k / k d − 1) ln ( rd / rw ) ............................................ (4)
In the derivation of Eq. 3, it is assumed that the flow
convergence owing to partial penetration is completed outside
the damaged zone. If the flow convergence towards open
segment happens partly outside and partly inside the damaged
zone then the total skin factor is given as
1 h
st =
s d + s pp ..................................................... (5)
γ hp
where γ is greater than 1. Odeh3 and Jones and Watts4
proposed simple equations to compute the γ parameter.
Selectively Completed Wells. In field applications, the wells
are usually completed across several intervals along the well
trajectory. The well completed this way is referred as to the
selectively completed well (SCW). Each completed segment
on the SCW is barefoot. Therefore, the flow pattern towards
the SCW is 2D.
Brons and Marting1 indicated that if the well is completed
symmetrically along the wellbore then the PCW models could
be applied to each symmetrical unit and the productivity of the
SCW could be estimated by multiplying the productivity of
the symmetrical unit by the number of the symmetrical
elements. Since then, several 2D analytical models have been
developed to simulate the fluid flow into the SCWs.11-13 These
models are more complex than the analytical models for
PCWs. In addition to being contaminated with the special
functions and infinite series, the analytical models for SCWs
require matrix construction and inversion since the models
compute not only the pressure drop but also the rate at each
open segment.
In this study, we present an approximate model to replace
the 2D analytical solutions and to avoid the matrix solution
and complicated mathematical functions.
Fully Perforated Wells. The well perforated completely all
along the well trajectory is referred as to fully perforated well
(FPW). The flow efficiency of the FPWs has been the subject
of many investigations.13-25 The effect of ideal perforating has
been quantified in terms of perforation pseudoskin, s p .
Numerical14-17, semi-analytical18-21, and analytical methods22
have been proposed to compute the perforation pseudoskin. In
the absence of formation damage and rock compaction around
the perforation tunnels, the perforation pseudoskin is a
function of perforation length, perforation radius, phasing
angle, shot density, wellbore radius, and permeability
anistropy.
s p = s p ( n spf , L p , rp , θ p , rw , k z / k r ) .......................... (6)
It has been observed that the productivity of the FPW is
not only controlled by the magnitude of perforation
pseudoskin but also the skin factors due to formation damage
and the rock compaction around the perforation tunnels. The
skin factor resulting from formation damage, sd , is
characterized by the degree of permeability impairment
( k d / k ) and the extent of the damaged zone ( rd ) as shown in
Eq. 4. The skin factor due to rock compaction around the
perforation tunnels is expressed as
s cz =
∆ zp
Lp
(
k
k
−
) ln( rcz / r p ) ................................. (7)
k cz k d
To predict the productivity of the FPW accurately, the
interaction between the three skin terms ( s p , s d , and s cz )
has to be formulated properly. The combined effect of
perforation pseudoskin, formation damage, and rock
compaction around perforations is referred as to perforation
total skin, s pdc .
Among the many methods for estimating the perforation
total skin, the methods proposed by McLeod18 and Karakas
and Tariq19, 20 have been very popular due to their simplicity.
For the sake of completeness, the Karakas-Tariq method is
summarized in Appendix B. Additionally, Jones and Slusser21
proposed a simple but accurate method combining perforation
pseudoskin and formation damage skin.
A three-dimensional (3-D) analytical model to determine
the perforation total skin has been proposed in Ref. 22. The
main advantage of the 3D solution is that it could handle
arbitrary perforation distribution and non-uniform perforation
parameters.
SPE 89414
3
A software package called SPAN is also available for
computing the productivity of the perforated wells.23 SPAN
uses a modified version of the Karakas-Tariq algorithm
described in Refs 19 and 20.24
Recently, the McLeod method, the Karakas-Tariq
algorithm, Jones-Slusser method, SPAN software, and the 3D
analytical solution were compared against the experimental
data.25 It has been shown that 1) the McLeod method
underestimates the perforation total skin, 2) the Karakas-Tariq
method for perforation pseudoskin works fine, however, the
Karakas-Tariq algorithm overpredicts perforation total skin in
the presence of formation damage and crushed zone, 3) the 3D
analytical solution and SPAN software replicate the
experimental data very well, and 4) the Jones-Slusser model,
which does not consider the effect of compacted zone, agrees
well with the 3D analytical solution and SPAN software when
the crushed zone is also ignored in the 3D solution and SPAN.
In Ref. 25, a modified version of the Jones-Slusser
method, accounting for the skin factor due to rock compaction
around the perforation tunnels, has been proposed. The
modified Jones-Slusser method could be analytically derived
if it is assumed that the perforations are terminated inside the
damaged zone and a radial flow geometry exists beyond the
damaged zone. The modified Jones-Slusser model compared
well against the experimental results for the special case of
short perforations terminated inside the damaged zone. In the
modified Jones-Slusser method, the perforation total skin is
expressed as below.
s pdc = s d +
k
s p + s cz ................................................ (8)
kd
Partially Perforated Wells. If only a segment along a cased
well is completed with perforations then this type of well is
referred as to the partially perforated well (PPW). The flow
convergence and the shape of the streamlines around the PPW
are controlled by the combined effect of partial penetration
and perforations. If it is assumed that the flow convergence
due to partial penetration is completed before the fluid feels
the impact of the perforations and the damaged zone then an
analytical expression could be derived to compute the total
skin factor including the simultaneous effects of partial
penetration, perforations, formation damage, and the crushed
zone.13, 20-23, 25 The equation for the total skin factor is
st =
1
γ
h
s pdc + s pp ................................................ (9)
hp
Eq. 9 has been verified against the 3D analytical solution.22
Selectively Perforated Wells. To the authors’ knowledge,
there exist two studies on the performance of the selectively
perforated vertical wells (SPW). Ref. 22 described a general
3D analytical solution considering arbitrary distribution of
perforation and variable perforation properties. The solution
involves matrix construction, Bessel functions, numerical and
analytical integration of Besses functions, and infinite series.
The size of the matrix is ( n p + 1) × ( n p + 1) where n p is the
number of the perforations. Therefore, if a large number of
perforations are involved, the computation of the 3D analytical
solution may demand long CPU time. Ref. 22 and 23 also
presented a pseudo 3D model based on the SCW model of
Ref. 12. The pseudo 3D model is very efficient even for the
wells with tens of thousands of perforations. However, the
pseudo 3D models of Refs. 22 and 23 are still composed of
matrix construction, Bessel functions, and infinite series.
The objective of the current paper is to develop a fast and
easy-to-use approximate SPW model free of matrix setup,
infinite series, and special functions.
Approximate Model
The approximate model for selectively perforated wells is
broken into two submodels; a perforation total skin model
considering unit formation thickness of 1 ft and a SCW with a
variable total skin across the perforated intervals. We will
describe both models.
Perforation Total Skin Model. A hybrid method is used to
compute the total skin factor combining the individual
contributions of perforation pseudoskin, formation damage,
and compacted zone around the perforations. First, we only
determine the perforation pseudoskin, s p , by using the steps
1-4 of the Karakas-Tariq algorithm. The Karakas-Tariq
algorithm is appended. At this stage, the effects of formation
damage and rock compaction are not accounted for yet.
For the short perforations ending inside the damaged zone,
we use the modified Jones-Slusser method to estimate the
combined effects of perforation pseudoskin, formation
damage, and rock compaction. The modified Jones-Slusser
methos is basically the expression in Eq. 8.
For the long perforations reaching beyond the damaged
zone, we use a modified version of the Karakas-Tariq method
provided by Hegeman.24 The modified method is also used in
SPAN software, version 6.0.23 There are basically two changes
applied to the original Karakas-Tariq method. The first
modification is that true wellbore radius ( rw ) instead of the
effective wellbore radius ( r′w ) is used in computing s H term.
The second modification is in the calculation of scz term.
True perforation length ( L p ) instead of the effective
perforation length ( L′p ) is used in computing s cz term.
Approximate Model for Selectively Completed Wells. For
the simplicity, we will develop the approximate model
considering steady state flow. However, the methodology
could be also applied to the well producing under pseudo
steady state flow.
Consider a damaged vertical openhole producing under
steady state flow conditions. The specific productivity index,
~
J o , for such a well is obtained by rearranging Eq. 1.
~
Jo =
q sct
k
=
h ( p e − p wf )
141.2 µ Bo
1
..... (10)
re
ln
+ sd
rw
4
SPE 89414
In a vertical openhole, every unit-thickness of the formation
produces the same amount of the fluid. Therefore, the specific
productivity index is constant and uniform at the wellbore as
well as inside the formation across its thickness. It should be
reminded that the specific productivity index is different from
the flux at the wellbore and these two concepts should not be
interchanged. The flux at the wellbore is the rate per unit
length along the wellbore.
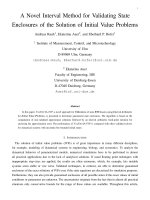
Now consider a damaged partially penetrating well. As
shown on Fig. 1, partial completion makes the streamlines
converge around the open segment and creates a 2D flow
field. However, the effect of partial completion on the fluid
streamline pattern is concentrated in the near wellbore region.
At the locations away from the wellbore and deep inside the
formation, the fluid flow is 1D radial and the streamlines are
parallel to each other and the upper and lower reservoir
boundaries. Let’s refer the distance at which the streamlines
start to converge towards the open segment as the radius of
flow convergence ( rc ). The flow towards a partially
completed well beyond the radius of flow convergence is
almost the same as that towards an openhole.
~
The specific productivity index for a PCW, J pc , is
~
J pc =
q sct
k
=
h ( p e − p wf )
141.2 µ Bo
1
.... (11)
re
ln
+ st
rw
~
J sc =
q sct
k
=
h ( p e − p wf )
141.2 µ Bo
1
.. (12)
re
ln
+ s tsc
rw
where stsc is the total skin factor representing the effects of
selective completion and variable formation damage.
Analytical expressions to compute stsc could be found in
Refs. 12 and 22. In general,
stsc = s tsc ( n s , hbi , h pi , h pt / h, rw , k z / k r , s di ) ........... (13)
Here, we would like to offer an alternative method to
~
predict J sc .
Consider a SCW with n s number of open intervals
distributed symmetrically along the wellbore. Also assume
that the open intervals are subject to the same degree of
formation damage. In such a case, all the completed intervals
produce at the same rate of qsci and flow induced no-flow
boundaries parallel to the bedding plane are formed at the
center of each uncompleted segment. Due to flow and
completion symmetry, we can decompose the SCW into ns
number of fictitious partially penetrating wells producing from
the same number of independent fictitious reservoirs/layers.
Let hi′ be the fictitious thickness of the ith fictitious reservoir.
Additionally, let h′bi , and h pi represent the rescaled location
where st is the total skin factor as expressed in Eq. 3 or 5.
Notice that, even for a PCW, the specific productivity index is
defined with respect to formation thickness not the length of
the completed segment. Typically, in a PCW, the flux along
the wellbore is discontinous; it is zero at the uncompleted
segments and it varies somewhat along the open segment. On
the other hand, if we examine the flux along the formation
thickness at a location beyond the radius of flow convergence
then it can be stated that the flux beyond rc is constant and
uniform across the formation thickness. Similarly, if we
consider the specific productivity index as a measure of
formation capacity and evaluate it at a location beyond rc not
at the wellbore then the specific productivity index is expected
be constant and uniform across the formation thickness as
well.
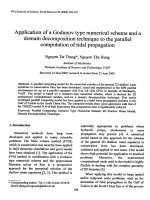
At this stage, let’s examine the fluid flow into a selectively
completed well. Consider a SCW with n s number of open
intervals and variable formation damage skin factor across
each open segment as shown on Fig. 2. The selective
completion yields multiple flow convergence regions in the
near wellbore region. However, the impact of the selective
completion on the flow streamlines is localized. Beyond the
radius of flow convergence, the streamlines are parallel to
each other and reservoir bedding plane. In SCWs, although the
flux distribution at the wellbore is discontinous and nonuniform, the flux and the specific productivity index evaluated
at the locations beyond rc are constant and uniform across the
formation thickness. The specific productivity index for a
~
SCW, J sc , could be written as
and the actual length of the ith partially completed well
producing only from the ith fictitious reservoir, respectively.
The special productivity index for each fictitious PCW could
be written as below.
~
′ =
J pci
q sci
k
=
hi′ ( p e − p wf )
141.2 µ Bo
1
r
ln e + s ti′
rw
. (14)
where s′ti is the total skin factor, representing the influences
of partial completion, perforations, formation damage, and
rock compaction, for the ith fictitious PCW. s′ti could be
computed using Eqs. 3, 5, or 9, depending on the completion
design. Additionally, due to geometry,
h1′ + h2′ + h3′ + ...... + hi′ + ....... + hn′ s =
ns
∑ hi′ = h ......... (15)
i =1
n s number of fictitous PCWs are part of the original
whole SCW. Now if we evaluate the specific productivity
indecies for the SCW and the fictitous PCW beyond the radius
of flow convergence then all the specific productivity indicies
should be equal.
~
~
~
~
~
~
J ′pc1 = J ′pc 2 = J ′pc 3 = .... J ′pci = ...... = J ′pcns = J sc ... (16)
SPE 89414
5
A comparison of Eqs. 12 through 16 reveals that the total
skin factors for the SCW and the n s number of fictitous
PCWs should be the same.
′ s = s sc .................... (17)
st′1 = s t′2 = st′3 = ....sti′ = ...... = s tn
It is very likely that the initial fictitious thickness
distribution based on Eqs. 20 and 21 will not satisy the
conditions expressed in Eqs. 16 – 18. In such a case, in the
following iteration, we reallocated the fictitious thickness
based on the ratio of specific productivity indicies for the
individual PCW and SCW.
Additionally,
1 ns ~
~
′ hi′ .................................................... (18)
J sc =
∑ J pci
h i =1
If the open intervals are symmetrically distributed then all
the fictitious layers has the same thickness.
h1′ = h2′ = h3′ = ...... = hi′ = ....... = hn′ s = h / n s .............. (19)
Now let’s go back and re-consider a SCW with arbitrary
distribution of open segments and different degree of
formation damage across them as displayed in Fig. 3. In such a
case, the actual reservoir and SCW cannot be divided into n s
number of equivalent layers and equivalent PCWs,
respectively. However, even in the case of asymmetric
segment and contrasting formation damage distributions, it is
expected that each completed segment will establish its own
drainage volume; therefore, flow induced no-flow boundaries
will emerge somewhere along the uncompleted segments
between the completed ones not at the center of uncompleted
segments as in case of symmetric completion. In the
asymmetric completions, the flow induced no-flow boundaries
may not be completely parallel to reservoir bedding and as
well defined as those in the symmetric completions.
Regardless, in case of asymmetric segment and unequal
damage distribution, we could still decompose the actual SCW
in the real reservoir into n s number of fictitious PCWs in n s
layers. However, each fictitous layer will have a different
fictitious thickhness of h′i assigned to it.
In asymmetric completions, the fictitious PPWs are still
part of the real SCW; therefore, when we evalute the specific
productivity indecies beyond the radius of flow convergence,
the actual SCW and the fictitious PPWs all should possess the
same specific productivity index value. In other words, Eqs.
12 through 18 are also valid for the asymmetric completions.
Now, the remaining unresolved issue is how to assign the
fictitious thickness to each fictitious layer. Assignment of
individual layer thickness requires an iterative procedure. We
suggest allocating the fictitious thickness based on the ratio of
the segment height to the total penetration ratio initially.
hi′ = h pi / h pt ............................................................... (20)
ns
h pt = ∑ h pi ................................................................. (21)
i =1
hi′
( k +1)
~k
J ′pci
hi′ k ..................................................... (22)
= ~
k
J sc
~k
where J sc
is estimated from Eq. 18.
We presented the iterative approximate model (Eqs. 12-18
and 20-22) for a selectively completed well and steady state
flow conditions. However, the same alghorithm also applies to
selectively perforated wells and pseudo steady state flow. For
selectively perforated wells, we use Eq. 9 to estimate the total
skin factor instead of Eq. 3 or 5 which is for selectively
completed wells. To invoke the pseudo steady state flow
condition, we just need to use Eq. 2 in the specific
productivity index computation.
In Appendix C, a stepwise procedure is given for the
iterative solution of the approximate model.
Verification of the Approximate Model. As mentioned
previously in the text, in the literature, there are 2D and 3D
analytical solutions for selectively completed/perforated wells.
Also, the software SPAN could be used to predict the
productivity of the partially perforated wells. To verify the
approximate model proposed in the current study, we
compared it against the analytical solutions of Refs. 12, 13,
and 22 and the software SPAN.
Table 1 shows the comparison of the 2D analytical and
approximate models for SCWs only. Three completed
intervals and two different cases of formation damage were
considered in the comparison. As can be seen on the table, the
results from the simple approximate model compare very well
against those from the 2D analytical solution. Besides the
results shown in Table 1, we also conducted additional
extensive comparison of the models. For the majority of the
cases, the approximate model replicated the results from the
2D analytical model. However, for some negative skin values
less than -2.3, the approximate model did not work well when
the interval with negative skin was very short.
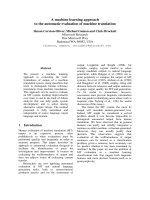
The approximate model was also tested extensively against
SPAN software by considering PPWs with different
completion/perforation schemes. An example comparison is
shown in Fig. 4. Table 2 presents the data used in the
comparison depicted in Fig. 4. As can be seen on the figure,
the results from the approximate model and the software agree
very well. In some other comparisons, we observed small
deviations between the compared models. The average
difference between results from the approximate model and
SPAN was 6%.
Although the results are not shown, we also compared the
approximate solution against the 3D solution presented in Ref.
22 for selectively perforated wells and observed good
agreement.
6
Discussion
In this section, we present the application of the approximate
model to selectively perforated wells and investigate the
effects of different perforation designs on the well
performance.
Table 3 lists the completion and perforation data
considerd for the SPW. The rest of the basic data set is the
same as that tabulated in Table 2. The well is perforated across
three intervals. The length and location of each interval are
printed in Table 3.
First, we kept perforation length constant and assigned
different values of the shot density, L p = 12 " and
n spf = 4, 8, 12 . However, in all three cases, all the perforated
intervals had the same shot density. The results, in terms of
productivity index, total skin factor, and fractional segment
rates, are summarized in Table 4. For comparison purposes,
the results for SCW and damaged and undamaged openhole
completions are also listed in Table 4. The results show that as
the perforation length increases, well productivity is improved.
The well with n spf = 12 has 1.8 times higher productivity
than that with n spf = 4 . It should be also noticed that the
SPW with n spf = 12 performs slightly better than SCW.
We also investigated the impact of perforation length on
the well performance. The results for this investigation are
reported in Table 5. For L p = 3 " , the total skin factors are
substantially higher. The skin factors for L p = 3 " are about
four times larger than those for L p = 12 " . As a result of high
total skin factors due to short perforations, the productivity
index values for L p = 3 " are approximately three times lower
than those for L p = 12 " . It should be noticed that, since the
total skin factors are high, the changes in the skin factors do
not affect the fractional rate distribution. The results in Table 5
verifies that the deep penetrating perforations extending
beyond the formation damage zone may improve the well
productivity significantly.
Summary and Conclusions
1. A simple approximate model to predict the inflow
performance of selectively completed and selectively
perforated wells has been developed. The model is
based on an iterative procedure and uses simple
algebraic equations.
2. The model has been compared against the 2D
analytical solution for selectively completed wells,
SPAN software for partially perforated wells, and 3D
analytical solution for selectively perforated wells. In
general, the approximate model agrees very well with
the more complicated solutions and the software. The
accuracy of the approximate model has been verified
by conducting an extensive comparison study.
3. Several novel applications of the approximate model
have been presented. The brief sensitivity study
presented verifies that well productivity may be
markedly improved if the perforations pierce through
SPE 89414
the formation damage zone and communicate with
the undamaged formation beyond the damaged zone.
Nomenclature
A = drainage area, ft2
Bo = formation volume factor, dimensionless, rbbl/stb
CA = reservoir shape factor
h = formation thickness, L, ft
hb= the distance between the bottom of the completed
interval and reservoir, L, ft
hp= the length of the completed interval, L, ft
hpt= the length of the total completed interval, L, ft
h ′ = formation thickness of the fictitious layer, L, ft
Jc= productivity of completed well, stb/day/psi
Jo= productivity index of open hole, stb/day/psi
~
J o = specific productivity index of open hole,
stb/day/psi/ft
~
J pc = specific productivity index of partially completed
wells, stb/day/psi/ft
~
J ′pc = specific productivity index of the fictitious partially
completed wells, stb/day/psi/ft
~
J sc = specific productivity index of selectivley completed
wells, stb/day/psi/ft
k = permeability, L2, md
kcz= permeability of crushed zone, L2, md
kr= permeability in radial direction, L2, md,
kx =
ky =
kz =
Lp=
ns=
nspf=
p=
PR =
qsct =
qsci =
rcz =
re =
rp =
rw =
scz =
s′cz =
sd =
sp =
spc =
spd =
spdc =
spp =
st =
kxk y
permeability in x-direction, L2, md
permeability in y-direction, L2, md
permeability in z-direction, L2, md
perforation length, L, ft
number of completed segments
number of shots per foot
pressure, m/Lt2, psi
productivity ratio, dimensionless, fraction
total well flow rate at surface, L3/t, stb/day
flow rate across the ith segment, L3/t, stb/day
radius of crushed zone around perforation, L, ft
reservoir radius, L, ft
perforation radius, L, ft
wellbore radius, L, ft
skin due to rock compaction around perforations in
the presence of formation damage
skin due to rock compaction around perforations in
the absence of formation damage
skin due to formation damage/stimulation
pseudoskin due to perforating
total skin combining flow convergence towards
perforations and crushed zone skin
total skin combining flow convergence towards
perforations and formation damage
total skin including perforation pseudoskin,
formation damage, and rock compaction around
perforation tunnels
pseudoskin due to partial penetration
total skin factor
SPE 89414
stsc = total skin factor for selectively
completed/perforated well
µ = viscosity, m/Lt, cp
pe = reservoir boundary pressure, m/Lt2, psi
pwf = flowing wellbore pressure, m/Lt2, psi
~
p = average reservoir pressure, m/Lt2, psi
∆rcz= thickness of the crushed zone, L, ft
∆rd= damaged zone thickness around wellbore, L, ft
∆zp= the vertical distance between perforations, L, ft
θp= perforation phasing angle
Subscripts
cz = crushed zone
d = wellbore damage
p = perforation
t = total
w = wellbore
Acknowledgment
The authors would like to thank Pete Hegeman for providing
the information about the modified Karakas and Tariq method
and a copy of SPAN software.
References
1. Brons, F. and Marting, V.E.: “The Effect of Restricted Fluid Entry
on Well Productivity”, JPT (February 1961) 172.
2. Odeh, A.S.:“Steady-State Flow Capacity of Wells with Limited
Entry to Flow,” SPEJ (March 1968) 43; Trans., AIME, 243.
3. Odeh, A.S.:”Pseudosteady-state Flow Capacity of Oil Wells with
Limited Entry and an Altered Zone around the Wellbore,” SPEJ
(August 1977) 271.
4. Jones, L.G. and Watts, J.W.:”Estimating Skin Effect in a Partially
Completed Damaged Well,” JPT (February 1971) 249.
5. Saidowski, R.M.:“Numerical Simulations of the Combined Effect
of Wellbore Damage and Partial Penetration,” paper SPE 8204
presented at the 1979 SPE Annual Technical Conference and
Exhibition, Las Vegas, Nevada, September 23-26.
6. Odeh, A.S.:“An Equation for Calculating Skin Factor Due to
Restricted Entry,” JPT (June 1980) 964.
7. Papatzacos, P.:”Approximate Partial-Penetration Pseudoskin for
Infinite-Conductivity Wells,” SPERE (May 1987) 227.
8. Vrbik, J.:“A Simple Approximation to the Pseudoskin Factor
Resulting from Restricted-Entry,” SPEFE (December 1991) 444.
9. Guerra, E., Inflow Performance of Selectively Perforated Vertical
Wells, MS Thesis, Colorado School of Mines, Golden, Colorado
(May 2004).
10. Hawkins, M.F.:”A Note on the Skin Effect,” Trans. AIME, (1956)
207.
11. Larsen, L.:“The Pressure-Transient Behavior of Vertical Wells
with Multiple Flow Entries,” paper SPE 26480 presented at the
1993 SPE Annual Technical Conference and Exhibition in
Houston, October 3-6.
12. Yildiz, T. and Cinar, Y.:”Inflow Performance and Transient
Pressure Behavior of Selectively Completed Vertical Wells,”
SPE Reservoir Eng. (October 1998) 467.
13. Yildiz, T.:”Impact of Perforating on Well Performance and
Cumulative Production” Journal of Energy Resources
Technology, (September, 2002) 163.
14. Hong, K.C.:”Productivity of Perforated Completions in
Formations With or Without Damage,” JPT (August 1975)
1027, Trans. AIME, 259.
15. Locke, S.: “An Advanced Method for predicting the Productivity
Ratio of a Perforated Well,” JPT (December 1981) 2481.
7
16. Tariq, S.M.:”Evaluation of Flow Characteristics of Perforations
Including Nonlinear Effects With the Finite Element Method,”
SPEPE (May 1987) 104.
17. Dogulu, Y.S.”Modeling of Well productivity in perforated
Completions,” paper SPE 51048 presented at the 1998 SPE
Eastern Regional Meeting, Pittsburgh, Pennsylvania, November
9-11.
18. McLeod, H.:”The Effect of Perforating Conditions on Well
Performance,” JPT (January 1983) 31.
19. Karakas, M. and Tariq, S.M.:”Semianalytical Productivity Models
for Perforated Completions,” SPEPE (February 1991) 73.
20. Bell, W.T., Sukup, R.A., and Tariq, S.M., Perforating, SPE
Monograph Volume 16, Richardson, TX, 1995.
21. Jones, L.G. and Slusser, M.L.:”The Estimation of Productivity
Loss Caused by Perforations – Including Partial Completion and
Formation Damage,” paper SPE 4798 presented at the 1974 SPE
Second Midwest Oil and Gas Symposium, Indianapolis, Indiana,
March 28-29.
22. Yildiz, T.:“Productivity of Selectively Perforated Vertical Wells,”
SPEJ (June 2002) 158.
23. SPAN user guide, Version 6.0, Schlumberger Perforating and
Testing, 1999.
24. Hegeman, P., Personal Communication, Schlumberger Product
Center, Sugarland, Texas.
25. Yildiz, T.: “Assessment of Total Skin Factor in Perforated Wells,”
paper SPE 82249 presented at the 2003 SPE European
Formation Damage Conference, The Hague, The Netherlands,
May 13-14.
Appendix A – Vrbik Model for Partial Penetration
Pseudoskin
The approximate model for the selectively perforated well is
partially based on the partial penetration pseudoskin model
proposed by Vrbik.?. The Vrbik model is summarized below.
The details on the Vrbik model can be found in the original
publication by Vrbik.?
s pp = (1 / h pD − 1) (1.2704 − ln rwD ) − F / h 2pD .......... (A-1)
F = f (0) − f ( h pD ) + f ( z1 ) − 0.5[ f ( z 2 ) + f ( z 3 )] ... (A-2)
f ( y ) = y ln y + (2 − y ) ln( 2 − y ) + g ( y ) .................... (A-3)
2
g ( y ) = rwD ln [ sin 2 (π y / 2) + 0.1053 rwD
] / π .......... (A-4)
z1 = 1 − 2 D ................................................................. (A-5)
z 2 = 1 − 2 D + h pD ...................................................... (A-6)
z 3 = 1 − 2 D − h pD ...................................................... (A-7)
h pD = h p / h .............................................................. (A-8)
hbD = hb / h ................................................................ (A-9)
D = (1 − h pD ) / 2 − hbD ......................................... (A-10)
rwD = rw
k z / k r / h ............................................... (A-11)
8
SPE 89414
Appendix B – Karakas-Tariq Model for Perforation
Pseudoskin
Karakas and Tariq23 proposed the stepwise procedure below to
estimate the pseudoskin due to perforating.
'
s cz
=
∆ zp
Lp
(
k
− 1) ln( rcz / r p ) .............................. (B-12)
k cz
1. Compute the pseudoskin due to flow convergence in the
horizontal plane.
The simultaneous effects of flow convergence toward
perforations and the permeability impairment around the
perforations are formulated as below.
s H = ln( rw / rwe ) ....................................................... (B-1)
′ .......................................................... (B-13)
s pc = s p + s cz
rwe (θ p ) = α (θ p ) ( rw + L p ) ....................................... (B-2)
6. Add formation damage effect.
Eq. B-2 is valid for all the phasing angles except
zero. α ( θ p ) is tabulated as a function of the phasing angle.
For α ( θ p ) = 0 , rwe ( θ p = 0 ) = L p / 4 .
If the perforations are short and terminated inside the
damaged zone then the total skin factor is given as below.
s pdc = s d +
k
′ ) .............................. (B-14)
( s p + s x + s cz
kd
2. Estimate the pseudoskin due to cylindrical wellbore.
rwD = rw /( rw + L p ) ................................................... (B-3)
s wb (θ p ) = c1 (θ p ) exp [c 2 (θ p ) rwD ] ........................... (B-4)
c1 and c 2 are tabulated as functions of the phasing angle.
where s x is negligible for most cases.
If the perforations are long and extend beyond the
damaged zone, the perforation length and wellbore radius in
steps 1 through 5 are replaced with the effective perforation
length and effective wellbore radius defined below.
L′p = L p − (1 − kd / k ) ∆ rd ........................................ (B-15)
3. Compute the pseudoskin due to flow convergence in the
vertical plane.
rw′ = rw + (1 − k d / k )∆ rd . ........................................ (B-16)
∆ z p = 1 / n spf ............................................................. (B-5)
Appendix C – Alghorithm for the Approximate Model
Assume that the reservoir and fluid properties, pressure drop,
the number of open segments, the location and length of the
completed segments, and the degree of formation damage and
perforation variables for all the completed segments are
available. Given ∆ p , µ , Bo , k r , k z , re , rw , h , n s , hbi ,
h pi , (k d / k ) i , ∆ rdi , n spfi , L pi , rpi , θ pi , (k cz / k ) i , and
∆ z pD = ∆ z p
k r / k z / L p ........................................ (B-6)
rpD = ( rp / 2 ∆ z p ) (1 +
k z / k r ) .............................. (B-7)
a = a1 (θ p ) log(rpD ) + a 2 (θ p ) ................................... (B-8)
∆ rczi
b = b1 (θ p ) rpD + b2 (θ p ) ............................................ (B-9)
1.
a1 , a 2 , b1 , and b2 are all tabulated as functions of the
phasing angle.
Divide the SCW or SPW into n s number of PCWs
or PPWs. For the first iteration, estimate the initial
values of h′i for 1 ≤ i ≤ n s using
hi′ = h pi / h pt ...................................................(C-1)
−1 b
s v = 10 a ∆ z bpD
rpD ................................................ (B-10)
ns
h pt = ∑ h pi ......................................................(C-2)
i =1
4. Determine the perforation pseudoskin.
s p = s H + s v + s wb ................................................. (B-11)
2.
Recalculate the location of the open segments in the
fictitious layers.
5. Add crushed zone effect.
First, estimate the skin factor due to crushed zone around
the perforation tunnels.
′ = hbi −
hbi
i −1
∑ hi′ ,
j =1
hb′ 1 = hb1 ....................(C-3)
SPE 89414
9
′ + h pi ) > hi′ then
If (hbi
7.
′ = hi′ − h pi ................................................... (C-4)
hbi
~
~
J ′pci = J ′pci hi′ = J sc hi′ ..................................(C-12)
′ = 0 then
If hbi
~
J sc = J sc h .....................................................(C-13)
hi′ = h pi ............................................................ (C-5)
3.
and ∆ rdi , compute s ′ppi and s di for 1 ≤ i ≤ n s
using the Vrbik method and Hawkins equation,
respectively. Then, estimate the total skin factor,
s′ti , for all the fictitious PCWs.
4.
q sct = J sc ( p e − p wf ) ....................................(C-15)
8.
1
γ
h
s pdci + s ′ppi ............................... (C-7)
hp
Compute the specific productivity indecies for all
the fictitious PCWs/PPWs and the SCW.
~
′ =
J pci
k
141.2 µ Bo
1
ln
re
+ s ti′
rw
................. (C-8)
1 ns ~
~
′ hi′ ........................................ (C-9)
J sc =
∑ J pci
h i =1
Check if
~
~
~
~
~
′
J ′pc1 ≈ J ′pc 2 ≈ .. J ′pci ≈ ...... ≈ J pcn
≈ J sc ... (C-10)
s
′ ......................... (C-11)
st′1 ≈ s t′2 ≈ ....s ti′ ≈ ...... ≈ stn
s
If the convergence criteria are not satisfied then
recalculate the thickness values for each fictitious
layers for the next iteration.
~k
J ′pci
hi′ k ........................................(C-16)
hi′ ( k +1) = ~
k
J sc
If the intervals are perforated then estimate the
perforation total skin, s pdci , for 1 ≤ i ≤ n s by
s ti′ =
6.
and
1 hi′
s di + s ′ppi .................................. (C-6)
γ h pi
using the hybrid method described in the body of the
text. Combine the influences of partial penetration
and perforation total skin as displayed below.
5.
q sci = J ′pci ( p e − p wf ) ..................................(C-14)
If the well is selectively completed then, for the
given sets of k z / k r , rw , h′i , h′bi , h pi , (k d / k ) i ,
s ti′ =
If the convergence criteria are satisfied then
compute the productivity indicies or the rates for
individual segments and the SCW.
9.
Go to step 2. Iterate on the steps 2-8 until the
convergence criteria given in step 6 are satisfied.
SI Metric Conversion Factors
bbl
cp
ft
ft3
in.
lbf
lbm
mD
×
×
×
×
×
×
×
×
1.589 873
1.0*
3.048*
2.831 685
2.54*
4.448 222
4.535 924
9.869 233
E-01
E-03
E-01
E-02
E+00
E+00
E-01
E-04
* Conversion factor is exact.
=
=
=
=
=
=
=
=
m3
Pa × s
m
m3
cm
N
kg
µm2
10
SPE 89414
TABLE 1 – COMPARISON OF APPROXIMATE AND
2D ANALYTICAL MODELS FOR SCWs
k r = k z = 100 md , Bo = 1.3 rbbl/stb , µ = 0.8 cp ,
TABLE 3 – DATA USED FOR THE SPW EXAMPLE
WITH THREE PERFORATED SEGMENTS
3
ns
re = 1,000' , rw = 0.25' , h = 100' , h p1 = hb1 = 10' ,
h p 2 = 30' , hb2 = 50' , h p3 = 5' , hb3 = 95' , n s = 3
h, ft
s di = 0
s d 1,2,3 = 6, 4, 0
This study
100
h p1 , ft
2
hb1 , ft
0
h p 2 , ft
6
2D
This study
2D
J sc
5.608
5.628
3.45
3.43
hb 2 , ft
50
q sc1 / q sct
0.259
0.249
0.175
0.164
h p3 , ft
12
q sc 2 / q sct
0.619
0.626
0.590
0.584
hb3 , ft
80
q sc3 / q sct
0.122
0.126
0.235
0.252
h pt / h
st
3.849
11.443
s′t1
3.794
11.582
s′t 2
3.811
11.568
s′t 3
3.802
11.527
0.2
n spf
4, 8, 12
L p , inches
3, 12
TABLE 4 – THE IMPACT OF SHOT DENSITY ON
SPW PERFORMANCE, L p = 12 "
Fractional segment rate
TABLE 2 – DATA USED TO COMPARE THE
APPROXIMATE MODEL AND SPAN FOR PPWs
1.3
Bo , rbbl/stb
µ , cp
0.8
h, ft
120
h p , ft
10
hb , ft
90
re , ft
745
rw , ft
0.25
k r , md
20
kz / kr
∆ rd , ft
1
0.5
k d , md
4
n spf
8
L p , inches
0.2-12
rp , inches
0.1
θ p , degrees
90
∆ rcz , inches
0.5
k cz , md
2
n spf
J sc
4
0.386
27.2
8
0.580
12
st
2nd
3rd
0.108
0.295
0.597
15.5
0.114
0.292
0.594
0.697
11.5
0.117
0.290
0.592
SCW
0.688
11.7
0.130
0.295
0.575
OH*
1.100
4.4
OH**
1.703
* Formation damage,
1st
** No formation damage
TABLE 5 – THE IMPACT OF PERFORATION
LENGTH ON SPW PERFORMANCE
Fractional segment rate
J sc
st
Lp
n spf
1st
2nd
3rd
4
12
0.386
27.2
0.108
0.295
0.597
8
12
0.580
15.5
0.114
0.292
0.594
4
3
0.110
115
0.103
0.300
0.597
8
3
0.180
67.5
0.106
0.299
0.595
SPE 89414
11
0.25
This study, spf=8
This study, spf=12
This study, spf=16
SPAN, spf=8
SPAN, spf=12
SPAN, spf=16
Productivity Ratio
0.20
Damaged + crushed
zones
0.15
0.10
0.05
Crushed zone only
0.00
0.0
2.0
4.0
6.0
8.0
10.0
12.0
Lp, in
Fig. 1 – Flow convergence towards a partially penetrating well.
Fig. 2 – Flow convergence towards a selectively completed well.
Fig. 3 – The approximate model - Selectively completed well
replaced by n s fictitious partially completed wells.
Fig. 4 – Comparison of the approximate model and SPAN
software for a partially perforated well.