- Trang chủ >>
- Khoa Học Tự Nhiên >>
- Vật lý
DETERMINATION OF THE CONCENTRATION OF FLUORESCENT POLYMERS USING THE LASER – µTAS
Bạn đang xem bản rút gọn của tài liệu. Xem và tải ngay bản đầy đủ của tài liệu tại đây (1013.22 KB, 6 trang )
Báo cáo toàn văn Kỷ yếu hội nghị khoa học lần IX Trường Đại học Khoa học Tự nhiên, ĐHQG-HCM
II-P-1.39
DETERMINATION OF THE CONCENTRATION OF FLUORESCENT POLYMERS USING
THE LASER – µTAS
Tran Hong Nhan1, Tran Quang Nguyen1,2, Nguyen Nang Dinh3, Tran Quang Trung1
1
Department of Solid State Physics, Faculty of Physics, University of Science, VNU-HCM
2
University Information Technology, VNU-HCM
3
University of Engineering and Technology, VNU Hanoi
Corresponding emails: ,
ABSTRACT
Microfluidic analysis systems, also known as Micro total analysis systems (µTAS) or “Lab-on aChip” are a rapidly developing field. There are many kinds of µTAS due to the purpose of the
experiment we needed. In this report, we use the Laser - Micro total analysis system (Laser-µTAS) to
determine the concentration of the fluorescent polymer such as AlQ 3 conducting polymer and R6G
fluorescent polymer. The modulation signal with frequency 5Hz was applied to µTAS system for
modulating the excitation light and referencing to Lock-in Amplifier. This way resulted in the limit of
detection (LOD) of the Laser – µTAS for AlQ3 down to 10nM and R6G down to 1nM based on the
calculation of the received “Lock-in amplifier SR510” data.
Keywords: µTAS, Microfluidic chip
INTRODUCTION
Microfluidic analysis systems, also known as Micro total analysis systems (µTAS) or “Lab-on a-Chip” are
a rapidly developing field. A lab-on-a-chip (LOC) is a device that integrates one or several laboratory functions
on a single chip of only millimeters to a few square centimeters in size. LOCs deal with the handling of
extremely small fluid volumes down to less than picoliters. Lab-on-a-chip devices are a subset of MEMS devices
and often indicated by "Micro Total Analysis Systems" (µTAS) as well.
Fluorescence is the most commonly used form of detection in microscale biological and chemical analysis,
primarily due to high sensitivity, and is becoming increasingly important as many assays are being miniaturized
into credit card size microfluidic lab-on-a-chip (LOC) systems. A number of investigators have attempted to
integrate fluorescence detection with microfluidic chips. Edel et al [1] have recently demonstrated the use of a
polyfluorene based pLED (polymer LED) as light source, avalanche photodiode as detector with limit of
detection (LOD) of 1mM for fluorescein dye. Yao et al. [2] fabricated a microfluidic device with an integrated
OLED excitation source and a PMT as detector for on-chip fluorescence detection using a pinhole and
interference filter for masking the excitation light. In this report, we use the homemade Micro Total Analysis
System (µTAS) and the homemade microfluidic chip to determine the the concentration of fluorescent polymers
such as AlQ3 and R6G.
EXPERIMENT
The Laser - Micro total analysis system (Laser-µTAS):
a. The Laser-µTAS structure
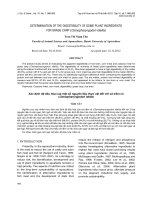
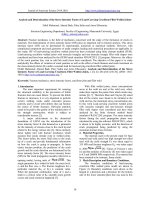
The Laser – Micro Total Analysis System (Laser-µTAS) had four parts including of the excitation source,
the excitation light filter, the solution tank and the optical detector. The excitation source was violet laser diode
(𝑆𝐴𝑁𝑌𝑂, 𝜆 = 405𝑛𝑚) and the Pulse Generator at frequency 5Hz was used to control the excitation light in
pulse. Two cross-polarized glasses (Edmundoptics) which the transmission of crossed polarizers was 0.15% used
for the excitation light filter. Quartz cuvette or microfluidic chip was used for solution tank placed in the middle
of two cross-polarized glasses and finally the Silicon photodiode was used for optical detector. The whole
system was placed in black box to prevent the noise from the outside light. For signal treatment, we used the
“Lock-in amplifier SR510” connecting simultaneous the signal of detector and reference pulse from pulse
generator. For getting data, the “lock-in amplifier” connected to computer via RS232 port. The homemade
program was built up from Labview software to control the system operation and calculated the concentration of
fluorescent dye in solution. The setup of the Laser-µTAS was shown on Figure 1.
ISBN: 978-604-82-1375-6
282
Báo cáo toàn văn Kỷ yếu hội nghị khoa học lần IX Trường Đại học Khoa học Tự nhiên, ĐHQG-HCM
Fig.1. The setup of Laser – Micro Total Analysis System (Laser-µTAS).
b. The Laser-µTAS operation
A square pulse with the frequency 5Hz created by the Pulse Generator was fed into the violet laser diode.
The excitation light in pulse went through the first cross-polarizer glass. Because the laser light was the crosspolarized light, the plane polarization of first cross-polarizer glass was adjusted to parallel position with the
plane polarization of laser light for getting the highest intensity of incident excitation light to sample. Then the
plane polarization of second cross-polarized glass was adjusted to perpendicular position with the plane
polarization of the first cross-polarized glass for blocking the excitation light. After that, the AlQ 3 solution was
pumped into quartz cuvette or microfluidic chip. The AlQ 3 fluorescent dye was stimulated by the excitation light
and emitted the yellow characterized light (λ = 520 nm). Because of the emission light was unpolarized, it went
easily through the polarization plane of second cross-polarized glass. The second cross-polarized glass blocked
the excitation light because its polarization plane is perpendicular with the polarization plane of the second
cross-polarized glass. As a result, the fluorescence light came to the photodiode without the excitation light.
The “lock-in amplifier” will eliminate the noise when it compares the signal from photodiode and reference
signal from pulse generator and sends data to computer via RS232 interface. The “Lock-in amplifier SR510”
with minimum scale down to nV is convenient for determining the small signal. The received data from “lock-in
amplifier” will be analyzed by homemade program for determining the concentration of fluorescent dye in
solution
Fabrication of microfluidic chip:
Microfluidic chip was fabricated by using soft-lithography method [3]. The microfluidic mold was created
by using photolithography processes. The rectangle mold had 3 cm width and 8 cm height. The micro-channel
width was 200 µm and its height was 20µm. Microfluidic chip had two input ports, one output port, and the
circle tank. The diameter of the input/output port was 2 mm and the diameter of circle tank was 3 mm.
Polydimethylsiloxane (PDMS) (Sylgard 184, Dow Corning), was mixed at a 10:1 (m/m) ratio of base to curing
agent, degassed and then poured over the microfluidic mold to achieve 4mm thickness. The PDMS was cured at
80°C for 2.5 hours on a leveled hotplate, cut and peeled from the mold with a sharp razor blade or scalpel, and
input/output ports were carefully pierced using a 2 mm (OD) punch. PDMS mold and 4cmx10cm glass
microscope slide were cleaned in a 1:5 ratio (v/v) of Hydrochloric acid and water for about 15 minutes and then
dried using nitrogen gas to remove all moisture from it. The PDMS mold was bonded to the glass slide using
microwave oxygen plasma [4].
Preparation AlQ3 solutions and R6G solutions:
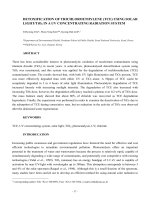
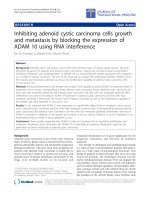
The Tris(8-hydroxyquinolinato) aluminium (AlQ3) fluorescent dye was prepared in ethanol with 6 different
concentrations: 1000 µM, 100 µM, 10 µM, 1 µM, 100 nM and 10 nM. We did the same progress with the R6G
fluorescent polymer which have the concentrations ranged from 1000 µM to 1 nM. Figure 3a showed the
fluorescence of AlQ3 concentration varying from 1000 µM to 1 µM and Figure 3b showed the fluorescence of
R6G concentration ranged from 1000 µM to 1 µM.
ISBN: 978-604-82-1375-6
283
Báo cáo toàn văn Kỷ yếu hội nghị khoa học lần IX Trường Đại học Khoa học Tự nhiên, ĐHQG-HCM
(a)
(b)
Fig.3. (a) The fluorescence of AlQ3 concentration varying from 1000µM to 1µM in UV-light.
(b) The fluorescence of R6G concentration ranged from 1000 µM to 1 µM in UV-light.
The measuring method:
After preparing the flourescent solutions, we built up the standard curve of dye concentration via collected
data from Laser-µTAS for determining the signal to background ratio. Both conducting polymer AlQ3 and
flourescent polymer R6G are solubed in Ethanol. Firstly, Ethanol was pumped into microfluidic chip and then
the second polarized-glass was fine adjusted so that the signal received from “lock-in amplifier” was smallest.
These data, which we got was called the background data. After that, we removed the quartz cuvette or
microfluidic chip containing the ethanol solution out from Laser-µTAS tank and pumped 1000 µM AlQ3
solution into microfluidic chip. Those data, which we got was called the signal data of 1000 µM AlQ3 solution.
Steps by steps, we got the background data of ethanol solutions and the signal data of AlQ 3 dye solution with
different concentrations varying from 1000 µM to 10 nM. We did the same process with the fluorescent polymer
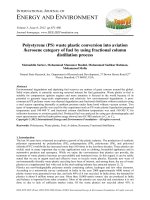
R6G concentrations ranged from 1000 µM to 1 nM. Figure 4 shows the fluorescent of R6G polymer in the
microchannel of the microfluidic chip under UV-light.
Fig.4. The fluorescent of R6G polymer in the microchannel of the microfluidic chip under UV-light.
RESULTS AND DISCUSSION
The background data is the collected signal from photodiode (voltage) when quartz cuvette or microfluidic
chip contains ethanol solution. This signal could be the combination of dark current of photodiode and noise
signal of system due to the excitation light leaking though polarizers and excitation light leaking through due to
device assembly and alignment. The signal data is sum of background signal and photo-luminescent signal of
fluorescent dye when quartz cuvette or microfluidic chip contains AlQ3 concentration varying from 1000 µM to
10 nM. The time measurement is 30 seconds and the sampling rate is 50 points per second from “lock-in
amplifier”. Thus, the background data and signal data have the same 1500 data points. After that, we calculate
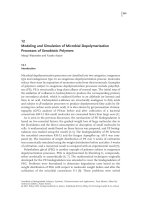
the average value of background data and the signal data with different concentration of dye solution. Figure 5a
shows the background data and signal data of AlQ3 concentration varying from 1000 µM to 100 nM and the
inset picture shows the distinction of the signal of AlQ 3 concentration varying from 10 µM to 100 nM. The same
process was done with the fluorescent polymer R6G. Figure 5b shows the background data and signal data of
R6G concentration varying from 10 µM to 10 nM and the inset picture shows the distinction of the signal of
R6G concentration varying from 1 µM to 10 nM.
ISBN: 978-604-82-1375-6
284
Báo cáo toàn văn Kỷ yếu hội nghị khoa học lần IX Trường Đại học Khoa học Tự nhiên, ĐHQG-HCM
(a)
(b)
Fig.5. (a) The background data and signal data of AlQ3 concentration varying from 1000µ to 100nM. (b) The
background data and signal data of R6G concentration ranged from 10 µM to 10 nM.
The ratio of average signal data and the average background data is defined S/B. When the ratio S/B=1, the
average signal data is as same as the average background data. It is called the limit of detection of Laser-µTAS.
Table 1 shows the calculation of signal and background for 100µM AlQ3 solution with “lock-in amplifier” with
time average of readings for 30 seconds. Table 2 shows the calculation of S/B ratio for all different concentration
of AlQ3 solutions. As the result of the S/B ratio of 10 nM AlQ 3 solution is equal to one, the limit of detection of
Laser-µTAS is 10 nM AlQ3.
Table 1. Calculation of signal and background for 100 µM AlQ3 solution with “lock-in amplifier” with time
average of readings for 30 seconds.
We continued to calculate the signal data and the background data of the R6G fluorescent polymer. Table 3
shows the calculation of S/B ratio for all different concentration of R6G solutions. Since the S/B ratio of 1 nM
R6G solution is equal to one, the limit of detection of Laser-µTAS is 1 nM R6G. Due to the higher quantum
yield[5][6], the limit of detection of R6G is higher than that ones of AlQ3.
Base on the S/B ratio from Table 2 and Table 3, we plot the S/B ratio of AlQ 3 and the S/B ratio of R6G.
Figure 6a demonstrated the S/B ratio of AlQ3 concentrations varying from 1000 µM to 10 nM and the inset
picture illustrated the others ranged from 100 µM to 10 nM. Figure 6b demonstrated the S/B ratio of R6G
concentrations varying from 1000 µM to 1 nM and the inset picture illustrated the others ranged from 10 µM to
1 nM.
Table 2. The S/B ratio of AlQ3 concentrations varying from 1000 µM to 10 nM.
ISBN: 978-604-82-1375-6
285
Báo cáo toàn văn Kỷ yếu hội nghị khoa học lần IX Trường Đại học Khoa học Tự nhiên, ĐHQG-HCM
Table 3. The S/B ratio of R6G concentrations ranged from 1000 µM to 1 nM.
(a)
(b)
Fig.6. a. The S/B ratio of different AlQ3 concentrations and the inset picture illustrated the others ranged from
100 µM to 10 nM. b. The S/B ratio of different R6G concentrations and the inset picture illustrated the others
ranged from 10 µM to 1 nM.
CONCLUSION
By using the Laser-µTAS, we determined the concentration of conducting polymer AlQ 3 down to 10 nM
and the concentration of fluorescent polymer R6G down to 1 nM. For getting the lower LOD, the detector with
higher response coefficient is necessary and applying this system to determine the antibody by using
nanoparticles will be done in next step.
Acknowledgments: This research is funded by Vietnam National University – Ho Chi Minh City(VNUHCM) under grant number B2012-18-12TĐ.
XÁC ĐỊNH NỒNG ĐỘ CỦA POLYMER PHÁT QUANG BẰNG HỆ ĐO LASER-ΜTAS
Trần Hồng Nhân(1), Trần Quang Nguyên(1,2), Nguyễn Năng Định(3), Trần Quang Trung(1)
(1) Khoa Vật lý - Vật lý Kỹ thuật, Trường ĐH KHTN, ĐHQG-HCM
(2) Trường ĐH Công nghệ Thông tin, ĐHQG-HCM
(3) Trường ĐH Công nghệ, ĐHQG-Hà Nội
TÓM TẮT
Hệ thống phân tích vi lưu, hay còn được gọi là µTAS hoặc “Lab-on-chip”, là một lĩnh vực đang
được quan tâm nghiên cứu rất nhiều. Tùy vào mục đích của thí nghiệm mà hệ µTAS sẽ có những kiểu
thiết kế khác nhau. Trong bài báo này, chúng tôi sử dụng hệ Laser - Micro total analysis system
(Laser-µTAS) nhằm xác định nồng độ của các polymer phát quang như polymer dẫn AlQ3 và polymer
phát quang R6G. Tín hiệu điều biến với tần số 5Hz được đưa vào hệ µTAS nhằm điểu biến ánh sáng
kích thích và dùng làm xung tham chiếu cho khuếch đại Lock-in. Dựa trên những dữ liệu thu được từ
bộ khuếch đại Lock-in, chúng tôi đã xác định được giới hạn của hệ đo Laser – µTAS với AlQ3 là 10nM
và với R6G là 1 nM.
ISBN: 978-604-82-1375-6
286
Báo cáo toàn văn Kỷ yếu hội nghị khoa học lần IX Trường Đại học Khoa học Tự nhiên, ĐHQG-HCM
REFERENCES
[1]. Edel J. B., Beard N. P., Hofmann O., deMello J. C., Bradley D. D. C., Mello A. J. - Thin-film polymer
light emitting diodes as integrated excitation sources for microscale capillary electrophoresis, Lab. Chip.
4 (2004) 136-140.
[2]. Yao B., Luo G., Wang L., Gao Y., Lei G., Ren K., Chen L., Wang Y., Hu Y., and Qiu Y. - A microfluidic
device using a green organic light emitting diode as an integrated excitation source, Lab. Chip. 5 (2005)
1041-1047.
[3]. Kim P., Kwon K. W., Park M. C., Lee S. H., Kim S. M., Suh K. Y. - Soft Lithography for Microfluidics,
A Review, Biochip Journal 2 (2008) 1-11.
[4]. Hui A. Y. N., Wang G., Lin B. C., and Chan W. T. - Microwave plasma treatment of polymer surface for
irreversible sealing of microfluidic devices, Lab. Chip. 5 (2005) 1173–1177.
[5]. V. V. N. Ravi Kishore, K. L. Narasimhan and N. Periasamy, - On the radiative lifetime, quantum yield
and fluorescence decay of Alq in thin films, Phys. Chem. Chem. Phys ,5, (2003), 1386–1391.
[6]. M. Fischer, J. Georges, - Fluorescence quantum yield of rhodamine 6G in ethanol as a function of
concentration using thermal lens spectrometry, Chemical Physics Letters , 260 (1996) 115-118.
ISBN: 978-604-82-1375-6
287