Accurate results in the clinical laboratory 2013
Bạn đang xem bản rút gọn của tài liệu. Xem và tải ngay bản đầy đủ của tài liệu tại đây (5.28 MB, 367 trang )
ACCURATE RESULTS IN THE
CLINICAL LABORATORY
A Guide to Error Detection
and Correction
ACCURATE RESULTS
IN THE CLINICAL
LABORATORY
A Guide to Error Detection and
Correction
Edited by
AMITAVA DASGUPTA, PH.D, DABCC
Professor of Pathology and Laboratory Medicine
University of Texas Health Sciences Center at Houston
Houston, TX
JORGE L. SEPULVEDA, M.D, PH.D
Associate Professor and Associate Director of Laboratory Medicine
Department of Pathology and Cell Biology
Columbia University College of Physicians and Surgeons
New York, NY
AMSTERDAM • BOSTON • HEIDELBERG • LONDON • NEW YORK • OXFORD
PARIS • SAN DIEGO • SAN FRANCISCO • SINGAPORE • SYDNEY • TOKYO
Elsevier
32 Jamestown Road, London NW1 7BY, UK
225 Wyman Street, Waltham, MA 02451, USA
525 B Street, Suite 1800, San Diego, CA 92101-4495, USA
Copyright r 2013 Elsevier Inc. All rights reserved
No part of this publication may be reproduced, stored in a retrieval system or transmitted in any form or
by any means electronic, mechanical, photocopying, recording or otherwise without the prior written
permission of the publisher
Permissions may be sought directly from Elsevier’s Science & Technology Rights Department
in Oxford, UK: phone (144) (0) 1865 843830; fax (144) (0) 1865 853333; email:
Alternatively, visit the Science and Technology Books website at www.elsevierdirect.com/rights
for further information
Notice
No responsibility is assumed by the publisher for any injury and/or damage to persons or property as a matter
of products liability, negligence or otherwise, or from any use or operation of any methods, products,
instructions or ideas contained in the material herein.
Because of rapid advances in the medical sciences, in particular, independent verification of diagnoses
and drug dosages should be made
Medicine is an ever-changing field. Standard safety precautions must be followed, but as new research
and clinical experience broaden our knowledge, changes in treatment and drug therapy may become
necessary or appropriate. Readers are advised to check the most current product information provided by
the manufacturer of each drug to be administered to verify the recommended dose, the method and duration of administrations, and contraindications. It is the responsibility of the treating physician, relying on
experience and knowledge of the patient, to determine dosages and the best treatment for each individual
patient. Neither the publisher nor the authors assume any liability for any injury and/or damage to persons
or property arising from this publication.
British Library Cataloguing-in-Publication Data
A catalogue record for this book is available from the British Library
Library of Congress Cataloging-in-Publication Data
A catalog record for this book is available from the Library of Congress
ISBN: 978-0-12-415783-5
For information on all Elsevier publications
visit our website at www.store.elsevier.com
Typeset by MPS Ltd, Chennai, India
www.adi-mps.com
Printed and bound in United States of America
13 14 15 16
10 9 8 7 6 5 4 3 2 1
Foreword
Clinicians must make decisions based on information
presented to them, both by the patient and by ancillary
resources available to the physician. Laboratory data generally provide quantitative information, which may be
more helpful to physicians than the subjective information from a patient’s history or physical examination.
Indeed, with the prevalent pressure for physicians to see
more patients in a limited time frame, laboratory testing
has become a more essential component of a patient’s
diagnostic workup, partly as a time-saving measure but
also because it does provide information against which
prior or subsequent test results, and hence patients’
health, may be compared. Tests should be ordered if they
could be expected to provide additional information
beyond that obtained from a physician’s first encounter
with a patient and if the results could be expected to
influence a patient’s care. Typically, clinicians use clinical
laboratory testing as an adjunct to their history taking
and physical examination to help confirm a preliminary
diagnosis, although some testing may establish a diagnosis, such as molecular tests for inborn errors of metabolism. Microbiological cultures of body fluids may not
only establish the identity of an infecting organism but
also establish the treatment of the associated medical condition. In outpatient practice, clinicians primarily order
tests to assist them in their diagnostic practice, whereas
for hospitalized patients, in whom a diagnosis has typically been established, laboratory tests are primarily used
to monitor a patient’s status and response to treatment.
Tests of organ function are used to search for drug toxicity, and the measurement of the circulating concentrations of drugs with narrow therapeutic windows is done
to ensure that optimal drug dosing is achieved and maintained. The importance of laboratory testing is evident
when some physicians rely more on laboratory data than
a patient’s own assessment as to how he or she feels,
opening these physicians to the criticism of treating the
laboratory data rather than the patient.
In the modern, tightly regulated, clinical laboratory
in a developed country, few errors are likely to be
made, with the majority labeled as laboratory errors
occurring outside the laboratory. A 1995 study showed
that when errors were made, 75% still produced
results that fell within the reference interval (when
perhaps they should not) [1]. Half of the other errors
were associated with results that were so absurd that
they were discounted clinically. Such results clearly
should not have been released to a physician by the
laboratory and could largely be avoided by a simple
review by human or computer before being verified.
However, the remaining 12.5% of errors produced
results that could have impacted patient management.
The prevalence of errors may be less now than in the
past because the quality of analytical testing has
improved, but the ramifications of each error are not
likely to be less. The consequences of an error vary
depending on the analyte or analytes affected and
whether the patient involved is an inpatient or an outpatient. If the patient is an inpatient, a physician, if
suspicious about the result, will likely have the opportunity to verify the result by repeating the test or other
tests addressing the same physiological functions
before taking action. However, if the error occurs with
a specimen from an outpatient, causing an abnormal
result to appear normal, that patient may be lost to
follow-up and present later with advanced disease.
Despite the great preponderance of accurate results,
clinicians should always be wary of any result that
does not seem to fit with the patient’s clinical picture.
It is, of course, equally important for physicians not to
dismiss any result that they do not like as a “laboratory error.” The unexpected result should always
prompt an appropriate follow-up. The laboratory has a
responsibility to ensure that physicians have confidence in its test results while still retaining a healthy
skepticism about unexpected results.
Normal laboratory data may provide some assurance
to worried patients who believe that they might have a
medical problem, an issue seemingly more prevalent
now with the ready accessibility of medical information
available through computer search engines. However,
both patients and physicians tend to become overreliant
on laboratory information, either not knowing or ignoring the weakness of laboratory tests in general. A culture
has arisen of physicians and patients believing that the
published upper and lower limits of the reference range
(or interval) of a test define normality. They do not realize that such a range has probably been derived from
95% of a group of presumed healthy individuals, not necessarily selected with respect to all demographic factors
or habits that were an appropriate comparative reference
for a particular patient. Even if appropriate, 1 in 20 individuals would be expected to have an abnormal result
for a single test. In the usual situation in which many
ix
x
FOREWORD
tests are ordered together, the probability of abnormal
results in a healthy individual increases in proportion to
the number of tests ordered. Studies have hypothesized
that the likelihood of all of 20 tests ordered at the same
time falling within their respective reference intervals is
only 36%. The studies performed to derive the reference
limits are usually conducted under optimized conditions,
such as the time since the volunteer last ate, his or her
posture during blood collection, and often the time of
day. Such idealized conditions are rarely likely to be
attained in an office or hospital practice.
Factors affecting the usefulness of laboratory data
may arise in any of the pre-analytical, analytical, or
post-analytical phase of the testing cycle. Failures to
consider these factors do constitute errors. If these
errors occur prior to collection of blood or after results
have been produced, while still likely to be labeled as
laboratory errors because they involve laboratory tests,
the laboratory staff is typically not liable for them.
However, the staff does have the responsibility to educate those individuals who may have caused them to
ensure that such errors do not recur. If practicing clinicians were able to use the knowledge that experienced
laboratorians have about the strengths and weaknesses
of tests, it is likely that much more clinically useful
information could be extracted from existing tests.
Outside the laboratory, physicians rarely are knowledgeable about the intra- and interindividual variation
observed when serial studies are performed on the
same individuals. For some tests, a significant change
for an individual may occur when his or her test
values shift from one end of the reference interval
toward the other. Thus, a test value does not necessarily have to exceed the reference limits for it to be
abnormal for a given patient. If the pre-analytical steps
are not standardized when repeated testing is done on
the same person, it is more likely that trends in laboratory data may be missed. There is an onus on everyone
involved in test ordering and test performance to standardize the processes to facilitate the maximal extraction of information from the laboratory data. The
combined goal should be pursuit of information rather
than just data. Laboratory information systems provide
the potential to integrate all laboratory data that can
then be integrated with clinical and other diagnostic
information by hospital information systems.
Laboratory actions to highlight values outside the reference interval on their comprehensive reports of test
results to physicians with codes such as “H” or “L” for
high and low values exceeding the reference interval
have tended to obscure the actual numerical result and
to cement the concept that the upper and lower reference
limits define normality and that the presence of one of
these symbols necessitates further testing. The use of the
reference limits as published decision limits for national
programs for renal function, lipid, or glucose screening
has again placed a greater burden on the values than
they deserve. Every measurement is subject to analytical
error, such that repeated determinations will not always
yield the same result, even under optimal testing conditions. Would it then be more appropriate to make multiple measurements and use an average to establish the
number to be acted upon by a clinician?
Much of the opportunity to reduce errors (in the
broadest sense) rests with the physicians who use test
results. Over-ordering leads to the possibility of more
errors. Inappropriate ordering—for example, repetitive
ordering of tests whose previous results have been
normal—or ordering the wrong test or wrong
sequence of tests to elucidate a problem should be
minimized by careful supervision by attending physicians of their trainees involved in the direct management of their patients. Laboratorians need to be more
involved in teaching medical students so that when
these students become residents, their test-ordering
practices are not learned from senior residents who
had learned their habits from the previous generation
of residents. Blanket application of clinical guidelines
or test order-sets has probably led to much misuse of
clinical laboratory tests. Many clinicians and laboratorians have attempted to reduce inappropriate test
ordering, but the overall conclusion seems to be that
education is the most effective means. Unfortunately,
the education needs to be continuously reinforced to
have a lasting effect. The education needs to address
the clinical sensitivity of diagnostic tests, the context
in which they are ordered, and their half-lives. Most
important, education needs to address issues of biological variation and pre-analytical factors that may affect
test values, possibly masking trends or making the
abnormal result appear normal and vice versa.
This book provides a comprehensive review of the
factors leading to errors in all the areas of clinical laboratory testing. As such, it will be of great value to all
laboratory directors and trainees in laboratory medicine and the technical staff who perform the tests in
daily practice. By clearly identifying problem areas,
the book lays out the opportunities for improvement.
This book should be of equal value to clinicians, as to
laboratorians, as they seek the optimal outcome from
their care of their patients.
Reference
[1] Goldschmidt HMJ, Lent RW. Gross errors and workflow analysis
in the clinical laboratory. Klin Biochem Metab 1995;3:131À49.
Donald S. Young, MD, PhD
Professor of Pathology & Laboratory Medicine
Department of Pathology & Laboratory Medicine
University of Pennsylvania Perelman
School of Medicine, Philadelphia
Preface
damage, and an unexpected laboratory test result may
be the first indication of such organ toxicity. For example, abnormal liver function tests in the absence of a
hepatitis infection in an otherwise healthy person may
be related to liver toxicity due to use of the herbal
sedative kava. These important issues are addressed in
detail in Chapter 7.
Clinical chemistry is a vast area of laboratory
medicine, responsible for the largest volume of testing
in the clinical laboratory and, arguably, affecting a
majority of clinical decisions. Sources of errors for
measuring common analytes in clinical chemistry are
discussed in Chapters 8 and 9, whereas errors in biochemical genetics are discussed in Chapter 10. In
Chapter 11, issues concerning measuring various hormones and endocrinology testing are reviewed,
whereas Chapter 12 is devoted to challenges in measuring cancer biomarkers.
Therapeutic drug monitoring, drugs of abuse testing, and alcohol determinations are major functions of
toxicology laboratories, and there are many interferences in therapeutic drug monitoring, immunoassays
used for screening of various drugs of abuse, mass
spectrometry methods for drug confirmation, and
alcohol determinations using enzymatic assays. These
important issues are addressed in Chapters 13À16
with an emphasis on various approaches to eliminate
or minimize such interferences.
Sources of errors in hematology and coagulation are
addressed in Chapter 17, whereas critical issues in
transfusion medicine are addressed in Chapter 18. In
Chapter 19, challenges in immunology and serological
testings are discussed, whereas sources of errors in
microbiology testing and molecular testing are
addressed in Chapters 20 and 21, respectively. The
particular issues in molecular testing related to pharmacogenomics are addressed in Chapter 22.
The objective of this book is to provide a comprehensive guide for laboratory professionals and clinicians regarding sources of errors in laboratory test
results and how to resolve such errors and identify
discordant specimens. Error-free laboratory results
are essential for patient safety. This book is intended
as a practical guide for laboratory professionals and
clinicians who deal with erroneous results on a regular
Clinical laboratory tests have a significant impact on
patient safety and patient management because more
than 70% of all medical diagnoses are based on laboratory test results. Physicians rely on hospital laboratories for obtaining accurate results, and a falsely
elevated or falsely low value due to interference or
pre-analytical errors may have a significant influence
on the diagnosis and management of patients. Usually,
a clinician questions the validity of a test result if the
result does not match the clinical evaluation of the
patient and calls laboratory professionals for interpretation. However, clinically significant inaccuracies in
laboratory results may go unnoticed and mislead clinicians into employing inappropriate diagnostic and
therapeutic approaches, sometimes with very adverse
outcomes. This book is intended as a guide to increase
the awareness of both clinicians and laboratory professionals about the various sources of errors in clinical
laboratory tests and what can be done to minimize or
eliminate such errors. This book addresses not only
sources of errors in the analytical methods but also
various sources of pre-analytical variation because
pre-analytical errors account for more than 60% all
laboratory errors (Chapter 1). Important pre-analytical
variables are addressed in the first three chapters of
the book. In Chapter 2, the effects of ethnicity, gender,
age, diet, and exercise on laboratory test results are
addressed, whereas Chapter 3 discusses the effects
of patient preparation and specimen collection. In
Chapter 4, specimen misidentification and specimen
processing issues are reviewed.
Various endogenous factors, such as bilirubin, lipemia, and hemolysis, can affect laboratory test results,
and this important issue is addressed in Chapter 5.
Immunoassays are widely used in the clinical laboratory,
and more than 100 immunoassays are available commercially for measurement of various analytes. In Chapter 6,
various immunoassay formats are discussed with an
emphasis on the mechanism of interference of heterophilic antibodies and autoantibodies on immunoassays,
especially sandwich immunoassays, and general
approaches to eliminate such interference are reviewed.
Many Americans use herbal medicines, and use
of these may affect clinical laboratory test results. In
addition, certain herbal medicines may cause organ
xi
xii
PREFACE
basis. We hope this book will help them to be aware of
such sources of errors and empower them to eliminate
such errors when feasible or to account for known
sources of variability when interpreting changes in
laboratory results.
We thank all the contributors for taking time from
their busy professional demands to write the chapters.
Without their dedicated contributions, this project
would have never materialized. We also thank our
families for putting up with us during the past year
while we spent many hours during weekends and
evenings writing chapters and editing this book.
Finally, our readers will be the judges of the success
of this project. If our readers find this book useful, all
the hard work of the contributors and editors will be
rewarded.
Amitava Dasgupta
Jorge L. Sepulveda
List of Contributors
Amid Abdullah, MD Department of Pathology and
Laboratory Medicine, University of Calgary and Calgary
Laboratory Services, Calgary, Alberta, Canada
Kamisha L. Johnson-Davis, PhD Department of
Pathology, University of Utah School of Medicine, and
ARUP Laboratories, Salt Lake City, UT
Alyaa Al-Ibraheemi, MD Department of Pathology and
Laboratory Medicine, University of Texas Health Sciences
Center at Houston, Houston, TX
Steven C. Kazmierczak, PhD Department of Pathology,
Oregon Health & Science University, Portland, OR
Leland Baskin, MD Department of Pathology and
Laboratory Medicine, University of Calgary and Calgary
Laboratory Services, Calgary, Alberta, Canada
Lindsay A.L. Bazydlo, PhD Department of Pathology,
Immunology and Laboratory Medicine, University of Florida
College of Medicine, Gainesville, FL
Michael J. Bennett, PhD Department of Pathology,
University of Pennsylvania Perelman School of Medicine,
Evelyn Willing Bromley Endowed Chair in Clinical
Laboratories and Pathology, Philadelphia, PA
Larry A. Broussard, PhD Department of Clinical
Laboratory Sciences, Louisiana State University Health
Sciences Center, New Orleans, LA
Laura Chandler, PhD Department of Pathology and
Laboratory Medicine, Philadelphia VA Medical Center,
Philadelphia, PA, and Department of Medicine, Perelman
School of Medicine at the University of Pennsylvania,
Philadelphia, PA
Alex Chin, PhD Department of Pathology and
Laboratory Medicine, University of Calgary and Calgary
Laboratory Services, Calgary, Alberta, Canada
Pradip Datta, PhD Siemens Healthcare Diagnostics,
Tarrytown, NY
Sheila Dawling, PhD Department of Pathology,
Microbiology & Immunology, Vanderbilt University Medical
Center, Nashville, TN
Valerian Dias, PhD Department of Pathology and
Laboratory Medicine, University of Calgary and Calgary
Laboratory Services, Calgary, Alberta, Canada
Dina N. Greene, PhD Northern California Kaiser
Permanente Regional Laboratories, The Permanente Medical
Group, Berkeley, CA
Neil S. Harris, MD Department of Pathology,
Immunology and Laboratory Medicine, University of Florida
College of Medicine, Gainesville, FL
Elaine Lyon, PhD ARUP Institute for Clinical and
Experimental Pathology, Salt Lake City, UT, and Department
of Pathology, University of Utah, Salt Lake City, UT
Gwendolyn A. McMillin, PhD Department of
Pathology, University of Utah School of Medicine, and
ARUP Laboratories, Salt Lake City, UT
Christopher Naugler, MD Department of Pathology and
Laboratory Medicine, University of Calgary and Calgary
Laboratory Services, Calgary, Alberta, Canada
Elena Nedelcu, MD Department of Pathology and
Laboratory Medicine, University of Texas Health Sciences
Center at Houston, Houston, TX
Andy Nguyen, MD Department of Pathology and
Laboratory Medicine, University of Texas Health Sciences
Center at Houston, Houston, TX
Octavia M. Peck Palmer, PhD Department of Pathology
and Critical Care Medicine, University of Pittsburgh School
of Medicine, Pittsburgh, PA
Amy L. Pyle, PhD Nationwide Children’s Hospital,
Columbus, OH
Semyon Risin, MD, PhD Department of Pathology and
Laboratory Medicine, University of Texas Health Sciences
Center at Houston, Houston, TX
Cecily Vaughn, MS ARUP Institute for Clinical and
Experimental Pathology, Salt Lake City, UT
Amer Wahed, MD Department of Pathology and
Laboratory Medicine, University of Texas Health Sciences
Center at Houston, Houston, TX
William E. Winter, MD Department of Pathology,
Immunology and Laboratory Medicine, University of Florida
College of Medicine, Gainesville, FL
Alison Woodworth, PhD Department of Pathology,
Vanderbilt University Medical Center, Nashville, TN
Donald S. Young, MD, PhD Department of Pathology
and Laboratory Medicine, University of Pennsylvania,
Perelman School of Medicine, Philadelphia, PA
xiii
C H A P T E R
1
Variation, Errors, and Quality in the
Clinical Laboratory
Jorge Sepulveda
Columbia University Medical Center, New York, New York
INTRODUCTION
Failure at any of these steps can result in an erroneous or misleading laboratory result, sometimes with
adverse outcomes. For example, interferences with
point-of-care glucose testing due to treatment
with maltose-containing fluids have led to failure to
recognize significant hypoglycemia and to mortality or
severe morbidity [4].
It has been roughly estimated that approximately
70% of all major clinical decisions involve consideration of laboratory results. In addition, approximately
40À94% of all objective health record data are laboratory results [1À3]. Undoubtedly, accurate test results
are essential for major clinical decisions involving
disease identification, classification, treatment, and
monitoring. Factors that constitute an accurate laboratory result involve more than analytical accuracy and
can be summarized as follows:
ERRORS IN THE CLINICAL
LABORATORY
Errors can occur in all the steps in the laboratory
testing process, and such errors can be classified as
follows:
1. The right sample was collected on the right patient,
at the correct time, with appropriate patient
preparation.
2. The right technique was used collecting the sample
to avoid contamination with intravenous fluids,
tissue damage, prolonged venous stasis, or
hemolysis.
3. The sample was properly transported to the
laboratory, stored at the right temperature,
processed for analysis, and analyzed in a manner
that avoids artifactual changes in the measured
analyte levels.
4. The analytical assay measured the concentration of
the analyte corresponding to its “true” level
(compared to a “gold standard” measurement)
within a clinically acceptable margin of error (the
total acceptable analytical error (TAAE)).
5. The report reaching the clinician contained the
right result, together with interpretative
information, such as a reference range and other
comments, aiding clinicians in the decision-making
process.
Accurate Results in the Clinical Laboratory.
DOI: />
1. Pre-analytical steps, encompassing the decision to
test, transmission of the order to the laboratory for
analysis, patient preparation and identification,
sample collection, and specimen processing.
2. Analytical assay, which produces a laboratory
result.
3. Post-analytical steps, involving the transmission of
the laboratory data to the clinical provider, who
uses the information for decision making.
Although minimization of analytical errors has
been the main focus of developments in laboratory
medicine, the other steps are more frequent sources of
erroneous results. An analysis indicated that in the
laboratory, pre-analytical errors accounted for 62% of
all errors, with post-analytical representing 23% and
analytical 15% of all laboratory errors [5]. The most
common pre-analytical errors included incorrect order
transmission (at a frequency of approximately 3% of
all orders) and hemolysis (approximately 0.3% of all
1
© 2013 Elsevier Inc. All rights reserved.
2
1. VARIATION, ERRORS, AND QUALITY IN THE CLINICAL LABORATORY
samples) [6]. Other frequent causes of pre-analytical
errors include the following:
• Patient identification error
• Tube-filling error, empty tubes, missing tubes, or
wrong sample container
• Sample contamination or collected from infusion
route
• Inadequate sample temperature.
Table 1.1 provides a complete list of errors, including pre-analytical, analytical, and post-analytical
errors, that may occur in clinical laboratories.
Particular attention should be paid to patient identification because errors in this critical step can have
severe consequences, including fatal outcomes, for
example, due to transfusion reactions. To minimize
identification errors, health care systems are using
point-of-care identification systems, which typically
involve the following:
1. Handheld devices connected to the laboratory
information systems (LIS) that can objectively
identify the patient by scanning a patient-attached
bar code, typically a wrist band.
2. Current laboratory orders can be retrieved from the
LIS.
3. Ideally, collection information, such as correct tube
types, is displayed in the device.
4. Bar-coded labels are printed at the patient’s side,
minimizing the possibility of misplacing the labels
on the wrong patient samples.
Analytical errors are mostly due to interference or
other unrecognized causes of inaccuracy, whereas
instrument random errors accounted for only 2% of all
laboratory errors in one study [5]. According to that
study, most common post-analytical errors were due to
communication breakdown between the laboratory and
the clinicians, whereas only 1% were due to miscommunication within the laboratory, and 1% of the results had
excessive turnaround time for reporting [5]. Postanalytical errors due to incorrect transcription of laboratory data have been greatly reduced because of the
availability of automated analyzers and bidirectional
interfaces with the LIS [5]. However, transcription errors
and calculation errors remain a major area of concern in
those testing areas without automated interfaces
between the instrument and the LIS. Further developments to reduce reporting errors and minimize the testing turnaround time include autovalidation of test
results falling within pre-established rule-based parameters and systems for automatic paging of critical
results to providers.
When classifying sources of error, it is important to
distinguish between cognitive errors, or mistakes, which
are due to poor knowledge or judgment, and
noncognitive errors, commonly known as slips and
lapses, due to interruptions in a process that is routine
or relatively automatic. Whereas the first type can be
prevented by increased training, competency evaluation, and process aids such as checklists or “cheat
sheets” summarizing important steps in a procedure,
noncognitive errors are best addressed by process
improvement and environment re-engineering to minimize distractions and fatigue. Furthermore, it is useful
to classify adverse occurrences as active—that is, the
immediate result of an action by the person performing a task—or as latent or system errors, which are system deficiencies due to poor design or implementation
that enable or amplify active errors. In one study, only
approximately 11% of the errors were cognitive, all in
the pre-analytical phase, and approximately 33% of the
errors were latent [5]. Therefore, the vast majority
of errors are noncognitive slips and lapses performed by the personnel directly involved in the
process. Importantly, 92% of the pre-analytical, 88% of
analytical, and 14% of post-analytical errors were preventable. Undoubtedly, human factors, engineering,
and ergonomics—optimization of systems and process
redesigning to include increased automation and userfriendly, simple, and rule-based functions, alerts,
barriers, and visual feedback—are more effective than
education and personnel-specific solutions to consistently increase laboratory quality and minimize errors.
Immediate reporting of errors to a database accessible to all the personnel in the health care system,
followed by automatic alerts to quality management
personnel, is important for accurate tracking and timely
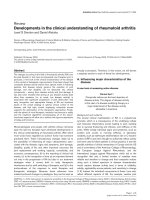
correction of latent errors. In our experience, reporting
is improved by using an online form that includes
checkboxes for the most common types of errors
together with free-text for additional information
(Figure 1.1). Reviewers can subsequently classify errors
as cognitive/noncognitive, latent/active, and internal to
laboratory/internal to institution/external to institution;
determine and classify root causes as involving human
factors (e.g., communication and training or judgment),
software, or physical factors (environment, instrument,
hardware, etc.); and perform outcome analysis.
Outcomes of errors can be classified as follows:
1. Target of error (patient, staff, visitors, or
equipment).
2. Actual outcome on a severity scale (from unnoticed
to fatal) and worst outcome likelihood if error was
not intercepted, because many errors are corrected
before they cause injury. Errors with significant
outcomes or likelihoods of adverse outcomes should
be discussed by quality management staff to
determine appropriate corrective actions and
process improvement initiatives.
ACCURATE RESULTS IN THE CLINICAL LABORATORY
3
ERRORS IN THE CLINICAL LABORATORY
TABLE 1.1 Types of Error in the Clinical Laboratory
Pre-Analytical
TEST ORDERING
Duplicate order
Order misinterpreted (test ordered 6¼ intended test)
Ordering provider not identified
Inappropriate/outmoded test ordered
Ordered test not performed (include add-ons)
Order not pulled by specimen collector
SAMPLE COLLECTION
Unsuccessful phlebotomy
Check-in not performed (in the LIS)
Traumatic phlebotomy
Wrong patient preparation (e.g., nonfasting)
Patient complaint about phlebotomy
Therapeutic drug monitoring test timing error
SPECIMEN TRANSPORT
Inappropriate sample transport conditions
Specimen damaged during transport
Specimen leaked in transit
Specimen damaged during centrifugation/analysis
SPECIMEN IDENTIFICATION
Specimen unlabeled
Date/time missing
Specimen mislabeled: No name or ID on tube
Collector’s initials missing
Specimen mislabeled: No name on tube
Label illegible
Specimen mislabeled: Incomplete ID on tube
Two contradictory labels
Wrong specimen label
Overlapping labels
Wrong name on tube
Mismatch requisition/label
Wrong ID on tube
Specimen information misread by automated reader
Wrong blood type
HIGH PRE-ANALYTICAL TURNAROUND TIME
Delay in receiving specimen in lab
STAT not processed urgently
Delay in performing test
SPECIMEN QUALITY
Specimen contaminated with infusion fluid
Hemolyzed
Specimen contaminated with microbes
Clotted or platelet clumps
Specimen too old for analysis
SPECIMEN CONTAINERS
No specimens received/missing tube
Wrong preservative/anticoagulant
Specimen lost in laboratory
Insufficient specimen quantity for analysis
Wrong specimen type
Tube filling error (too much anticoagulant)
Inappropriate container/tube type
Tube filing error (too little anticoagulant)
Wrong tube collection instructions
Empty tube
Analytical
High analytical turnaround time
Test perform by unauthorized personnel
Instrument caused random error
Results discrepant with other clinical or
Instrument malfunction
laboratory data
QC failure
Testing not completed
(Continued)
ACCURATE RESULTS IN THE CLINICAL LABORATORY
4
1. VARIATION, ERRORS, AND QUALITY IN THE CLINICAL LABORATORY
TABLE 1.1 (Continued)
Pre-Analytical
QC not completed
Wrong test performed (different from test ordered)
Post-Analytical
Report not completed
Reported questionable results, detected by laboratory
Delay in reporting results
Reported questionable results, detected by clinician
Critical results not called
Failure to append proper comment
Delay in calling critical results
Read back not done
Results reported incorrectly
Results misinterpreted
Results reported incorrectly from outside laboratory
Failure to act on results of tests
Results reported to wrong provider
OTHER
Proficiency test failure
Employee injury
Product wastage
Safety failure
Product not delivered timely
Environmental failure
Product recall
Damage to equipment
Clearly, efforts to improve accuracy of laboratory
results should encompass all of the steps of the testing
cycle, a concept expressed as “total testing process” or
“brain-to-brain testing loop” [7]. Approaches to
achieve error minimization derived from industrial
processes include total quality management (TQM); [8]
lean dynamics and Toyota production systems; [9]
root cause analysis (RCA); [10] health care failure
modes and effects analysis (HFMEA); [11,12] failure
review analysis and corrective action system (FRACAS)
[13]; and Six Sigma [14,15], which aims at minimizing
the variability of products such that the statistical frequency of errors is below 3.4 per million. A detailed
description of these approaches is beyond the scope of
this book, but laboratorians and quality management
specialists should be familiar with these principles for
efficient, high-quality laboratory operation [8].
QUALITY IMPROVEMENT IN THE
CLINICAL LABORATORY
Quality is defined as all the features of a product
that meet the requirements of the customers and the
health care system. Many approaches are used to
improve and ensure the quality of laboratory operations. The concept of TQM involves a philosophy of
excellence concerned with all aspects of laboratory
operations that impact on the quality of the results.
Specifically, TQM approaches apply a system of statistical process control tools to monitor quality and productivity (quality assurance) and encourage efforts to
continuously improve the quality of the products, a
concept known as continuous quality improvement. A
major component of a quality assurance program is
quality control (QC), which involves the use of periodic
measurements of product quality, thresholds for
acceptable performance, and rejection of products that
do not meet acceptability criteria. Most notably, QC is
applied to all clinical laboratory testing processes and
equipment, including testing reagents, analytical
instruments, centrifuges, and refrigerators. Typically,
for each clinical test, external QC materials with
known performance, also known as controls, are run
two or three times daily in parallel with patient specimens. Controls usually have preassigned analyte concentrations covering important medical decision levels,
often at low, medium, and high concentrations. Good
laboratory QC practice involves establishment of a
laboratory- and instrument-specific mean and standard
deviation for each lot of each control and also a set of
rules intended to maximize error detection while minimizing false rejections, such as Westgard rules [16].
Another important component of quality assurance for
clinical laboratories is participation in proficiency testing (or external quality assessment programs such as
proficiency surveys sent by the College of American
Pathologists), which involves the sharing of samples
with a large number of other laboratories and comparison of the results from each laboratory with its peers,
usually involving reporting of the mean and standard
deviation (SD) of all the laboratories running the same
analyzer/reagent combination. Criteria for QC rules
ACCURATE RESULTS IN THE CLINICAL LABORATORY
QUALITY IMPROVEMENT IN THE CLINICAL LABORATORY
FIGURE 1.1 Example of an error reporting form for the clinical laboratory.
ACCURATE RESULTS IN THE CLINICAL LABORATORY
5
6
1. VARIATION, ERRORS, AND QUALITY IN THE CLINICAL LABORATORY
Observed
True
95%
1 SD
1.65 SD
RE
SE
TE
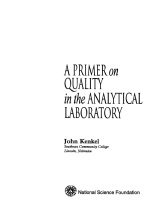
FIGURE 1.2 Total analytical error (TE) components: random
error (RE), or imprecision, and systematic error (SE), or bias, which
cause the difference between the true value and the measured
value. Random error can increase or decrease the difference from the
true value. Because in a normal distribution, 95% of the observations
are contained within the mean 6 1.65 standard deviations (SD), the
total error will not exceed bias 1 1.65 3 SD in 95% of the
observations.
and proficiency testing acceptability should take into
consideration the concept of total acceptable analytical
error because deviations smaller than the total analytical errors are unlikely to be clinically significant and
therefore do not need to be detected.
Total analytical error (TAE) is usually considered to
combine the following (Figure 1.2): (1) systematic error
(SE), or bias, as defined by deviation between the average values obtained from a large series of test results
and an accepted reference or gold standard value, and
(2) random error (RE), or imprecision, represented by
the coefficient of variation of multiple independent test
results obtained under stipulated conditions (CVa). At
the 95% confidence level, the RE is equal to 1.65 times
the CVa for the method; consequently,
TAE 5 1:65 3 CVa 1 bias
Clinical laboratories frequently evaluate imprecision
by performing repeated measurements on control
materials, preferably using runs performed on different days (between-day precision), whereas bias (or
trueness) is assessed by comparison with standard reference materials with assigned values and also by peer
comparison, where either the peer mean or median are
considered the reference values.
One important concept that some clinicians disregard
is that no laboratory measurement is exempt of error;
that is, it is impossible to produce a laboratory result
with 0% bias and 0% imprecision. The role of
technologic developments, good manufacturing practices, proficiency testing, and QC is to minimize and
identify the magnitude of the TAE. A practical approach
is to consider the clinically acceptable total analytical
error or TAAE. Clinical acceptability has been defined
by legislation (e.g., the Clinical Laboratory Improvement
Act (CLIA)), by clinical expert opinion, and by scientific
and statistical principles that take into consideration
expected sources of variation. For example, Callum
Fraser proposed that clinically acceptable imprecision,
or random error, should be less than half of the intraindividual biologic variation for the analyte and less than
25% of the total analytical error [17]. The systematic
error, or bias, should be less than 25% of the combined
intraindividual (CVw) and interindividual biological
(CVg) variation:
qffiffiffiffiffiffiffiffiffiffiffiffiffiffiffiffiffiffiffiffiffiffiffiffiffiffiffiffiffi
TAAE95% , 1:65 3 0:5 3 CVw 1 0:25 3 CVw 2 1 CVg 2
Tables of intra- and interindividual biological variation, with corresponding allowable errors, are available
and frequently updated [18]. See Table 1.2 for examples.
Importantly, the allowable errors may be different at specific medical decision levels because analytical imprecision tends to vary with the analyte concentration, with
higher imprecision at lower levels. Also, biological variation may be different in the various clinical conditions,
and available databases are starting to incorporate studies of biologic variation in different diseases [18].
A related concept is the reference change value (RCV),
also called significant change value (SCV)—that is, the
variability around a measurement that is a consequence of analytical imprecision, within-subject biologic variability, and the number of repeated tests
performed [17,19,20]. At the 95% confidence level,
RCV can be calculated as follows:
RCV95% 5 1:96 3
ffi
pffiffiffi qffiffiffiffiffiffiffiffiffiffiffiffiffiffiffiffiffiffiffiffiffiffiffiffiffiffiffiffi
2 3 CVa 2 1 CVw 2
Because multiple repeats decrease imprecision
errors, if the change is determined from the mean of
repeated tests, the formula can be modified to take
into consideration the number of repeats in each measurement (n1 and n2) [20]:
rffiffiffiffiffiffiffiffiffiffiffiffiffiffiffiffi qffiffiffiffiffiffiffiffiffiffiffiffiffiffiffiffiffiffiffiffiffiffiffiffiffiffiffiffiffi
2
RCV95% 5 1:96 3
3 CVa 2 1 CVw 2
n1 3 n2
For example, for a serum creatinine measurement
with an analytical imprecision (CVa) of 6.6% and withinsubject biologic variation of 5.3%, the RCV at 95% confidence is 23.5% with one measurement for each sample.
With two measurements for each sample, the RCV is
11.7%. Therefore, a change between two results that does
ACCURATE RESULTS IN THE CLINICAL LABORATORY
7
CONCLUSIONS
TABLE 1.2 Allowable Errors and Reference Change Values for Selected Tests. All Numeric Values are Percentages
Test
CVa
CVw
CVg
CLIA TAAE
Bio TAAE
Amylase
5.3
8.7
28.3
30
14.6
4.4
7.4
28.2
Alanine aminotransferase
2.8
18.0
42.0
20
26.2
9.0
11.4
50.5
Albumin
2.6
3.1
4.2
10
3.9
1.6
1.3
11.2
Alkaline phosphatase
4.2
6.4
24.8
30
11.7
3.2
6.4
21.2
Aspartate aminotransferase
2.2
11.9
17.9
20
15.3
6.0
5.4
33.5
10.0
23.8
39.0
20
31.0
11.9
11.4
71.6
Chloride
2.4
1.2
1.5
5
1.5
0.6
0.5
7.4
Cholesterol
2.7
5.4
15.2
10
8.4
2.7
4.0
16.7
Cortisol
5.3
20.9
45.6
25
29.8
10.5
12.5
59.8
Creatine kinase
3.6
22.8
40.0
30
30.3
11.4
11.5
64.0
Creatinine
7.6
6.0
14.7
15
8.9
3.0
4.0
26.8
Glucose
3.4
6.1
6.1
10
7.2
3.0
2.2
19.4
HDL cholesterol
3.3
7.1
19.7
30
11.1
3.6
5.2
21.7
Iron
2.5
26.5
23.2
20
30.7
13.3
8.8
73.8
Lactate dehydrogenase (LDH)
2.5
8.6
14.7
20
11.4
4.3
4.3
24.8
Magnesium
2.8
3.6
6.4
25
4.8
1.8
1.8
12.6
Bilirubin total
Allowable Imprecision
Allowable Bias
RCV95
pCO2
1.5
4.8
5.3
8
5.7
2.4
1.8
13.9
Protein, total
2.6
2.7
4.0
10
3.5
1.4
1.2
10.4
Thyroxine (T4)
4.8
4.9
10.9
20
7.1
2.5
3.0
19.0
Triglyceride
3.9
20.9
37.2
25
28.0
10.5
10.7
58.9
Urate
2.9
9.0
17.6
17
12.3
4.5
4.9
26.2
Urea nitrogen
6.2
12.3
18.3
9
15.7
6.2
5.5
38.2
Source: Based on data available at [18].
CVa, analytical variability in the author’s laboratory; CVw, intraindividual variability; CVg, interindividual variability; CLIA TAAE, total allowable analytical error
based on Clinical Laboratory Improvement Act (CLIA); Bio TAAE,
total allowable analytical error based on interindividual and intraindividual variation.
qffiffiffiffiffiffiffiffiffiffiffiffiffiffiffiffiffiffiffiffiffiffiffiffiffiffiffiffiffi
Allowable imprecision 5 50% of CVw. Allowable bias 5 0:25 3 CVw 2 3 CVg 2 . RCV95, reference change value at 95% confidence based on CVw and CVa.
not exceed the RCV has a greater than 95% probability
that it is due to the combined analytical and intraindividual biological variation; in other words, the difference
between the two creatinine results (measured without
repeats) should exceed 23.5% to be 95% confident
that the change is due to a pathological condition.
Conversely, for any change in laboratory values, the RCV
formula can be used to calculate the probability that it is
due to analytical and biological variation [17,19,20]. See
Table 1.2 for examples of RCV at the 95% confidence
limit, using published intraindividual variation and the
author’s laboratory imprecision. Ideally, future LIS
should integrate available knowledge and patientspecific information and automatically provide estimates
of expected variation based on the previous formulas to
facilitate interpretation of changes in laboratory values
and guide laboratory staff regarding the meaning of
deviations from expected results. In summary, the use of
TAAE and RCV brings objectivity to error evaluation,
QC and proficiency testing practices, and clinical decision
making based on changes in laboratory values.
CONCLUSIONS
As in other areas of medicine, errors are unavoidable in the laboratory. A good understanding of the
sources of error together with a quantitative evaluation
of the clinical significance of the magnitude of the
error, aided by the establishment of limits of acceptability based on statistical principles of analytical and
intraindividual biological variation, are critical to
design a quality program to minimize the clinical
impact of errors in the clinical laboratory.
ACCURATE RESULTS IN THE CLINICAL LABORATORY
8
1. VARIATION, ERRORS, AND QUALITY IN THE CLINICAL LABORATORY
References
[1] Forsman RW. The value of the laboratory professional in the
continuum of care. Clin Leadersh Manag Rev 2002;16(6):370À3.
[2] Forsman RW. Why is the laboratory an afterthought for
managed care organizations? Clin Chem 1996;42(5):813À16.
[3] Hallworth MJ. The “70% claim”: what is the evidence base?
Ann Clin Biochem 2011;48(Pt 6):487À8.
[4] Gaines AR, Pierce LR, Bernhardt PA. Fatal Iatrogenic
Hypoglycemia: Falsely Elevated Blood Glucose Readings with a
Point-of-Care Meter Due to a Maltose-Containing Intravenous
Immune Globulin Product. [cited; Available from: ,http://www.
fda.gov/BiologicsBloodVaccines/SafetyAvailability/ucm155099.
htm.; 2009 [06.18.2009]
[5] Carraro P, Plebani M. Errors in a stat laboratory: types and frequencies 10 years later. Clin Chem 2007;53(7):1338À42.
[6] Carraro P, Zago T, Plebani M. Exploring the initial steps of the
testing process: frequency and nature of pre-preanalytic errors.
Clin Chem 2012;58(3):638À42.
[7] Plebani M, Lippi G. Closing the brain-to-brain loop in laboratory testing. Clin Chem Lab Med 2011;49(7):1131À3.
[8] Valenstein P, editor. Quality management in clinical laboratories. Northfield, IL: College of American Pathologists;
2005.
[9] Rutledge J, Xu M, Simpson J. Application of the Toyota production system improves core laboratory operations. Am J Clin
Pathol 2010;133(1):24À31.
[10] Dunn EJ, Moga PJ. Patient misidentification in laboratory medicine: a qualitative analysis of 227 root cause analysis reports in
the Veterans Health Administration. Arch Pathol Lab Med
2010;134(2):244À55.
[11] Chiozza ML, Ponzetti C. FMEA: a model for reducing medical
errors. Clin Chim Acta 2009;404(1):75À8.
[12] Southard PB, Kumar S, Southard CA. A modified delphi methodology to conduct a failure modes effects analysis: a patientcentric effort in a clinical medical laboratory. Qual Manag
Health Care 2011;20(2):131À51.
[13] Krouwer J. Using a learning curve approach to reduce laboratory errors. Accreditation and Quality Assurance: Journal for
Quality, Comparability and Reliability in Chemical
Measurement 2002;7(11):461À7.
[14] Llopis MA, Trujillo G, Llovet MI, Tarres E, Ibarz M, Biosca C,
et al. Quality indicators and specifications for key analyticalextranalytical processes in the clinical laboratory. Five years’
experience using the six sigma concept. Clin Chem Lab Med
2011;49(3):463À70.
[15] Gras JM, Philippe M. Application of the six sigma concept in clinical laboratories: a review. Clin Chem Lab Med 2007;45(6):789À96.
[16] Westgard JO, Darcy T. The truth about quality: medical usefulness and analytical reliability of laboratory tests. Clin Chim
Acta 2004;346(1):3À11.
[17] Fraser CG. Biological variation: from principles to practice.
Washington, DC: AACC Press; 2001.
[18] Westgard J. Desirable Specifications for Total Error,
Imprecision, and Bias, derived from intra- and inter-individual
biologic variation. [cited 2012; Available from: ,http://www.
westgard.com/biodatabase1.htm.; 2012.
[19] Kroll MH. Multiple patient samples of an analyte improve
detection of changes in clinical status. Arch Pathol Lab Med
2010;134(1):81À9.
[20] Fraser CG. Improved monitoring of differences in serial laboratory results. Clin Chem 2011;57(12):1635À7.
ACCURATE RESULTS IN THE CLINICAL LABORATORY
C H A P T E R
2
Effect of Age, Gender, Diet, Exercise,
and Ethnicity on Laboratory Test Results
Octavia M. Peck Palmer
University of Pittsburgh School of Medicine, Pittsburgh, Pennsylvania
INTRODUCTION
This chapter reviews the pre-analytical variables of
age, gender, diet, exercise, and ethnicity/race (a surrogate
marker for environmental, socioeconomic/demographic,
and genetic factors) and their influence on analytes
measured in the clinical laboratory. In addition, the
chapter discusses other less known effects of fasting,
special diets, and nutraceuticals on laboratory tests,
with an abbreviated discussion of the influence of
genetic factors in response to food and nutraceuticals.
Annually, the United States performs approximately
7 billion clinical laboratory tests [1]. Clinical laboratory
test results are an indispensable part of the clinician’s
decision-making process. Accurate laboratory results
aid in timely and effective diagnosis, prognosis, treatment, and management of diseases. It is imperative
that the in vitro diagnostic testing results accurately
reflect the in vivo physiological processes of the patient.
Inaccurate results may lead to unwarranted, invasive
testing, postponement of critical therapies, increased
patient anxiety, and expensive health care costs. The
quality assurance program of each laboratory focuses
on providing the highest quality in analytical testing.
Pre-analytical (steps prior to analysis), analytical
(sample analysis), and post-analytical (steps after
analysis) factors can affect the accuracy of serum/
plasma analytes measured in the laboratory. The
pre-analytical phase refers to the processes that occur
prior to blood/body fluid testing. These processes
include the phlebotomy collection techniques (sample
labeling, tourniquet, and posture), blood/body fluid
tube/container types (anticoagulants, gel separators,
clot activators, and preservatives), and sample handling (mixing/clotting protocol, temperature, storage,
and transport). Nonmodifiable factors such as age,
gender, and ethnicity/race (biological factors) must
be accounted for in the pre-analysis stage. Patientrelated factors such as diet and exercise regimens
can be controlled. Standardized patient preparation
prior to blood collection can minimize the effects
of pre-analytical factors. In some cases, age- and
gender-specific reference limits can account for the
influence of pre-analytical factors.
Accurate Results in the Clinical Laboratory.
DOI: />
EFFECTS OF AGE-RELATED CHANGES
ON CLINICAL LABORATORY
TEST RESULTS
Aging is a complex metabolic process that is not
fully understood [2]. Complex physiological changes
occur during transitions from the newborn to adult
to geriatric stages of life [3]. Understanding the effects
of age on laboratory findings can increase diagnostic
accuracy. Clinicians must distinguish nonpathologic,
age-related changes from pathologic changes. Adult
reference ranges for a majority of serum/plasma/urine
analytes measured in the laboratory are available [4].
However, complete, standardized, age-specific reference
ranges are not available.
In 2000, following the passage of the National
Children’s Act, the U.S. Congress authorized the
National Children’s Health Study (NCS). NCS, led by
the Eunice Kennedy Shriver National Institute of Child
Health and Human Development, is a longitudinal study
of 100,000 healthy individuals aged 0À21 years. The
American Association of Clinical Chemistry, a collaborator of NCS, funded pilot studies focused on establishing
age-specific reference ranges [5].
9
© 2013 Elsevier Inc. All rights reserved.
10
2. EFFECT OF AGE, GENDER, DIET, EXERCISE, AND ETHNICITY ON LABORATORY TEST RESULTS
Newborn Population
Following birth, arterial blood pO2 rises to
approximately 80À90 mmHg. Oxygen consumption
is significantly higher in neonates compared to
adults. A significant reduction in uric acid concentrations occurs between birth and 6 days of age. Healthy
newborns rapidly metabolize glucose as a result of
their high red blood cell count, which is not evident in
healthy adults [6]. Newborns have increased circulating bilirubin concentrations due to their immature
liver. The developing liver is unable to convert bilirubin to bilirubin diglucuronide. Hyperbilirubinemia
due to physiologic jaundice is a common condition
in newborns and usually resolves within 5À7 days
following birth. However, after birth it may be difficult
to distinguish this normal physiological phenomenon
from hemolytic disease of the newborn [7,8]. Immature
kidneys demonstrate vascular resistance, reduced
outgoing blood flow from the outer cortex, and
reduced glomerular filtration rate (GFR). The kidneys
do not efficiently concentrate and dilute urine; regulate acidÀbase pathways; reabsorb, excrete, or retain
sodium; or secrete hydrogen ions [9]. Newborns
experience an expanded extracellular fluid volume
state. Hypocalcemia usually resolves within the first
2 days of life [10].
Childhood to Puberty Population
Growth impacts laboratory test results. Two weeks
following birth, luteinizing hormone (LH) concentrations increase in both boys and girls, but they
decline to prepubertal concentrations by the infants’
first birthday. Similarly, follicle-stimulating hormone
(FSH) concentrations follow the same trend as LH
concentrations after birth but decline to prepubertal
concentrations in boys by the first year of life and in
girls by the second year of life. Reduced LH and FSH
concentrations in the teenage period are not sensitive
enough to distinguish between pubertal delay and
hypogonadotropic hypogonadism. Gonadal failure
indicated by an upward trajectory of LH and FSH
concentrations cannot be expected until 10 years of
age. Elevated estradiol concentrations are present at
birth but rapidly decline during the first week of life
to prepubertal concentrations (0.5À5.0 ng/dL for girls
and 1.0À3.2 ng/dL for boys). Additional decline to
prepubertal concentrations is present by the sixth
month in boys and the first year of life in girls
[11,12]. Skeletal growth and muscle mass development account, in part, for the increased alkaline
phosphatase (ALP), γ-glutamyl transferase (γ-GGT),
creatinine, and human growth hormone concentrations seen in the childhood to puberty developmental
period. The decline in ALP concentrations varies
among genders. After the age of 12 years, girls exhibit
a decline in ALP, and this decline is apparent in boys
after the age of 14 years [13]. Increased circulating
ALP concentrations are present during normal growth
spurts but also in the setting of bone malignancies
(osteoblastic bone cancers, osteomalacia, Paget’s disease, and rickets). ALP concentrations are threefold
higher in adolescents compared to adults [14].
Increases in creatinine occur between ages 12 and 19
years. Cystatin C concentrations in females decrease
during the same age range. Uric acid concentrations
continue to decline during the first decade of life [15].
Adult Population
In both sexes, total cholesterol increases with
advancing age (men age 60 years and women age 55
years). In the second decade of life, men have peak
uric acid concentrations, which are not detected in
women until the fifth decade of life [7].
Menopausal (Pre and Post) Period
Postmenopausal women have increased total
cholesterol concentrations, attributed to decreased
circulating estrogen. High-density lipoprotein cholesterol (HDL-C) also declines up to 30% [7]. Transition
from the peri- to the postmenopausal stage presents
dramatic endocrine changes. A strong correlation
between age and human chorionic gonadotropin
(hCG) is observed [16]. Accurate interpretation of
elevated hCG concentrations is critical because appreciable concentrations are present during healthy
pregnancy, cancer, or trophoblastic disease [17]. In
females, serum hCG concentrations (reference limit
hCG , 0.5 mIU/mL) are used to either identify or
rule out pregnancy. Knowing the pregnancy status of
a patient is essential because invasive medical procedures and medications can have potentially harmful
effects on a developing fetus [18]. Slight increases
in serum hCG concentrations ($0.5 mIU/mL) occur
in women between the ages of 41 and 55 years. Thus,
it is critical to distinguish the origin of the hCG (placental origin vs. pituitary origin). Misinterpretation
of elevated hCG concentrations in peri- and postmenopausal women may postpone clinical treatments. In
peri- and postmenopausal women (41À55 years old),
studies demonstrate that FSH concentrations can help
determine the origin of hCG. In peri- and postmenopausal women (41À55 years old) with serum hCG
concentrations ranging between 5.0 and 14.0 IU/L,
a FSH cutoff of 45.0 IU/L identifies hCG of placental
origin with 100% sensitivity and 75% specificity.
Importantly, FSH concentrations greater than 45 IU/L
are not present in females with hCG of placental
ACCURATE RESULTS IN THE CLINICAL LABORATORY
EFFECTS OF AGE-RELATED CHANGES ON CLINICAL LABORATORY TEST RESULTS
origin. FSH reflex testing should only be utilized
in pregnancy evaluation of peri- and postmenopausal
women (serum hCG concentrations between 5.0
and 14.0 IU/L) [19]. hCG concentrations greater than
14.0 IU/L in this age group indicate pregnancy unless
the clinical setting dictates otherwise [16].
Geriatric Population
The aging population is rapidly increasing in the
United States. Between the year 2000 (35 million
persons) and the year 2010 (40 million persons), the
United States experienced a 15% increase in the geriatric
population (. 65 years or older) [20]. Interpretation of
laboratory findings in the geriatric population is challenging due to multiple confounding factors that
include (1) physiologic changes that naturally occur
with healthy aging, (2) acute and chronic conditions
(kidney disease, diabetes, and cardiovascular disease),
(3) diets, (4) lifestyles, and (5) medication regimens [21].
After the age of 60 years, albumin concentrations
decline each decade, with significant decreases noted in
individuals older than 90 years [22]. Low serum
calcium concentration in the geriatric population is
most commonly caused by low serum albumin concentrations [23]. Protein concentration changes may be
entirely due to compromised liver function or poor dietary regimens. Individuals older than 90 years may
have decreased total cholesterol concentrations.
Iron perturbations such as decreases in iron storage,
serum iron concentrations, and total iron-binding
capacity occur during aging. Depletion of iron stores
may be followed by increases in serum ferritin and
decreases in serum transferrin. Dysregulated liver
synthesis during aging may account for the reduced
transferrin concentrations [4]. Lack of sufficient dietary
iron intake may account for the high prevalence of
anemia in the geriatric population. However, iron loss,
due to bleeding in the intestinal tract, may also be the
culprit for the anemia. Anemia in the geriatric population may, in part, be explained by the age-related
decreases in stomach hydrochloric acid (HCl), a key
acid responsible for iron absorption in the intestines.
Vitamin B12 deficiency is also prevalent in geriatrics
due to age-related decreases in serum vitamin B12 concentrations. The underlying cause of vitamin B12 deficiency may be decreased HCI concentrations or chronic
atrophic gastritis, which subsequently accounts for limited intrinsic factor and vitamin B12 absorption [21].
Age-associated organ function decline correlates
with changes in laboratory findings (i.e., reduced
creatinine clearance, glucose tolerance, and hypothalamicÀpituitaryÀadrenal axis regulation) that may
represent disease or non-disease processes. At least 10%
of the healthy geriatric population exhibits physiologic
changes that may not be associated with disease. These
11
changes include decreased partial pressure of oxygen
in arterial blood (decreases by 25% between the third
and eighth decades of life) and magnesium (decreases
by 15%) concentrations. Geriatrics may also exhibit
elevated serum alkaline phosphatase (increases by 20%
between the third and eighth decades of life) and 2-hr
postprandial glucose concentrations (after age 40 years,
increases 30À40 mg/dL per decade). Increases in cholesterol concentrations (increases by 30À40 mg/dL by
age 60 years) and erythrocyte sedimentation rate as
high as 40 can be nonpathogenic [7,21].
A 30À40% decline in functioning kidney and the
GFR is responsible for reduced creatinine clearance.
Creatinine and blood urea nitrogen (BUN) concentrations can overestimate the kidney functioning capacity,
as measured by GFR or creatinine clearance, due to
reduced muscle mass [24]. Muscle mass degeneration
accounts for reduced creatinine production. Serum
creatinine concentrations can remain within normal
limits despite the underlying diminished renal clearance capacity [21]. Mean creatinine clearance concentrations decrease by 10 mL/min/1.73 m2 per decade
and are significantly different between the adult and
geriatric populations. The mean creatinine clearance for
a 30-year-old individual is approximately 140 mL/min
(2.33 mL/sec) per 1.73 m2 of body surface area. In contrast, the mean creatinine clearance for an 80-year-old
individual is 97 mL/min (1.62 mL/sec) per 1.73 m2
of body surface area [25]. Small increases in serum
aspartate aminotransferase (AST) (18 to 30 U/L) occur
between 60 and 90 years of age, whereas peaks in
serum alanine aminotransferase (ALT) occur in the fifth
decade of life and by the sixth decade gradually decline
to concentrations well below those noted in young
adults [21]. GGT concentrations rise during aging.
A steady increase in serum glucose concentrations and
a decrease in glucose tolerance are prevalent in geriatrics. Lower glucose concentrations in geriatrics may be
due to poor diet and reduced body mass. Higher serum
insulin concentrations are prevalent in elderly adults
and may be associated with insulin resistance [21].
In persons older than 75 years, insulin resistance is
reportedly responsible for impaired glucose tolerance.
The capacity of insulin receptors may be lower in elderly
adults. Regarding serum immunoglobulin concentrations,
IgA concentration increases slightly in geriatric men, but
overall IgG and IgM concentrations gradually decline.
Aging compromises the hypothalamicÀpituitaryÀadrenal
axis. Aging-related changes include decreases in free
thyroxine (T4), triiodothyronine (T3), corticotrophin, and
corticosteroid [26]. Specific to men, free testosterone
decreases without significant changes in total testosterone
concentrations [27,28]. Prostate-specific antigen concentrations increase up to 6.5 ng/mL in men 70 years or
older without clinical evidence of prostate cancer [21].
ACCURATE RESULTS IN THE CLINICAL LABORATORY
12
2. EFFECT OF AGE, GENDER, DIET, EXERCISE, AND ETHNICITY ON LABORATORY TEST RESULTS
Serum electrolytes, such as potassium and calcium,
rise as one ages. Calcium concentration increases in
individuals aged 60À90 years in the presence of normal
albumin concentrations. However, after the age of
90 years, calcium concentrations gradually decline.
Hypocalcemia may be due to a simultaneous drop in
serum pH and an increase in parathyroid hormone
concentrations. Age significantly impacts lung elastic
architecture, alveoli function, and diaphragm strength
and significantly alters respiratory function. Thus, the
individual has decreased partial pressure of arterial
oxygen and increased carbon dioxide pressure and
bicarbonate ion concentration [21].
Although age can significantly account for altered
clinical laboratory test results, one must consider the
overlapping effects caused by disease, such as obesity
and hypertension, and/or inadequate dietary intake
when interpreting laboratory results that are outside
of the reference limits [29]. The abnormal results may
highlight age-associated disease processes that require
clinical intervention. It is clinically necessary to conduct laboratory studies focused on the systematic
effects of aging on serum/plasma/urine analytes. The
resulting data will be useful for the development of
effective age-specific diagnostic cutoffs.
EFFECTS OF GENDER-RELATED
CHANGES ON CLINICAL
LABORATORY TEST RESULTS
Gender encompasses a myriad of complex endocrine and metabolic responses. Gender differences in
laboratory analytes can be explained by differential
endocrine organ-related functions and skeletal muscle
mass [30]. On average, albumin, calcium, magnesium,
hemoglobin, ferritin, and iron concentrations are lower
in females [7]. A reduction in circulating iron concentrations is, in part, due to blood loss during monthly
menses. Mean serum creatinine and cystatin C concentrations are commonly lower in adolescent females
compared to adolescent males [15]. Aldolase concentrations are higher in males following the start of
puberty. ALP concentrations are higher in girls ages
10À11 years. Boys ages 12À13, 14À15, and 16À17 years
have higher ALP concentrations compared to girls in
the corresponding age categories. A decline in ALP
concentrations begins after age 12 years for girls
and 14 years for boys [13]. Menopausal women have
higher ALP concentrations compared to males. Serum
bilirubin concentrations are lower in women due to
decreased hemoglobin concentrations. Females have
higher albumin concentrations compared to males of
the same age [31]. Lipid profiles are heavily influenced
by gender. Total cholesterol concentrations vary not
only with age but also with gender. Females younger
than age 20 years have higher total cholesterol concentrations compared to males in the corresponding age
span. However, between the ages of 20 and 45 years,
males commonly have higher total cholesterol concentrations than females. Male peak lipid concentrations
occur between the ages of 40 and 60 years, whereas
female peak lipid concentrations occur between the
ages of 60 and 80 years [32]. Between the ages of 30 and
80 years, mean HDL-C decreases by approximately
30% in females but increases by 30% in males [21,33]
These lipid increases may be due to the stimulatory
effect of estrogen in women. In contrast, low-density
lipoprotein cholesterol (LDL-C) is higher in men. Men
also have higher 24-hr urinary excretions of epinephrine, norepinephrine, cortisol, and creatinine compared
to women [34]. Women have higher serum GGT and
copper and reticulocyte count (due to increased erythrocyte turnover) compared to their male counterparts.
EFFECTS OF DIET ON CLINICAL
LABORATORY TEST RESULTS
Diet may affect test results, whereas starvation also
has a profound impact on clinical laboratory test results.
Food Ingestion-Related Changes on
Clinical Laboratory Values
Food ingestion activates in vivo metabolic signaling
pathways that significantly affect laboratory test
results [35]. First, the stomach secretes HCl in response
to food consumption, which causes a decrease in plasma
chloride concentrations. This mild metabolic alkalotic
state (alkaline tide phenomenon) results from exaggerated circulating bicarbonate concentrations in the stomach’s venous blood with an accompanying decreased
ionized calcium (by 0.05 mmol/L, 0.2 mg/dL) [36].
Second, postprandial-associated impairment in the liver
leads to increased bilirubin and enzyme activities.
Depending on the content of the meal ingested, the
effects on commonly measured analytes may be shortor long-lasting. Thus, an overnight fasting for at least
12 hr is necessary to obtain an accurate representation of
in vivo glucose, lipids, iron, phosphorus, urate, urea, and
ALP concentrations. Interestingly, Lewis a secretors
(blood groups B and O) experience spikes in ALP concentrations following ingestion of high-fat meals.
Lipemia can also interfere with a variety of analytical
methods, such as indirect potentiometry. Prior to analysis, lipids can be removed from lipemic samples via
ultracentrifugation or by the use of lipid-clearing
reagents [37]. Carbohydrate (increases glucose and insulin and decreases phosphorus concentrations) and
ACCURATE RESULTS IN THE CLINICAL LABORATORY
EFFECTS OF DIET ON CLINICAL LABORATORY TEST RESULTS
protein meals (increases cholesterol and growth hormone concentrations within 1 hr of food consumption
and also increases glucagon and insulin concentrations)
have differential effects on serum analytes. High-protein
diets significantly affect various analytes measured in
24-hr urine test. A standard 700-calorie meal markedly
increases triglycerides (B50%), AST (B20%), bilirubin
and glucose (B15%), and AST concentrations (B10%) [3].
Rapid changes in lipid concentrations are consistent
with dietary changes, medications, or disease.
Caffeine intake has significant effects on the human
body. Varying concentrations of this stimulant are
present in a variety of foods (coffee, tea, chocolate,
soft drinks, and energy drinks). The short half-life
of caffeine (3À7 hr) also varies among individuals.
Caffeine induces catecholamine excretion from the
adrenal medulla. In addition, increased gluconeogenesis, which subsequently increases glucose concentrations and impairs glucose tolerance, is evident
following caffeine intake. The adrenal cortex is also
vulnerable to caffeine’s stimulatory effects, as evidenced
by increased cortisol, free cortisol, 11-hydroxycorticoids,
and 5-hydroxindoleaceatic acid concentrations. Caffeine
is responsible for a threefold increase in nonesterified
fatty acids, which interfere with the accurate quantification of albumin-bound drugs and hormones. Spuriously
high ionized calcium concentrations are present following caffeine ingestion. Caffeine induces elevations in
free fatty acids causing a rapid decrease in pH that frees
calcium from protein.
Noni juice contains significant amounts of potassium
(B56 mEq/L). Ingestion of noni juice leads to hyperkalemia. Specifically, hyperkalemia is apparent in vulnerable
populations such as individuals with renal dysfunction
and/or populations receiving potassium-increasing regimens such as spironolactone or angiotensin-converting
enzyme inhibitors. Bran stimulates bile acid synthesis
within 8 hr of ingestion [38]. However, bran inhibits
gastrointestinal absorption of vital nutrients, including
calcium (decreased by 0.3 mg/dL, 0.08 mmol/L), cholesterol, and triglycerides (decreased by 20 mg/dL,
0.23 mmol/L) [3]. Serotonin (5-hydroxytryptamine) is
an ingredient present in a myriad of fruits and vegetables, such as bananas, black walnuts, kiwis, pineapples,
and plantains. Bananas markedly increase 24-hr urinary
excretion of 5-hydroxyindoleacetic acid in the absence
of disease. Avocados suppress insulin secretion, causing impaired glucose tolerance.
Special Diet-Related Changes on Clinical
Laboratory Values
The ketogenic diet is a low-carbohydrate (,40 g/day),
moderate-protein, high-fat diet. In the absence of
13
sufficient carbohydrates, the liver converts fat into fatty
acids and ketones. Adherence to a ketogenic diet results
in elevated blood and urine ketones within several days
and diuresis within 2 weeks. Reportedly, a decline in
serum triglycerides and an increase in HDL-C occur over
several weeks [39]. The nonvegetarian diet has higher
plasma ammonia, uric acid, and urea concentrations compared to the vegetarian diet. This diet commonly includes
saturated fatty acids. Palmitic acid, a saturated fatty
acid, causes a significant rise in plasma cholesterol concentrations. The substitution of saturated fatty acids
with polyunsaturated fats and complex carbohydrates
can lower LDL-C concentrations. Intake of omega-3 oils
may lower triglycerides and very low-density lipoprotein
(VLDL) concentrations. Vegetarians have lower LDL-C
(approximately 37% lower) and HDL-C (approximately
12%) concentrations compared to nonvegetarians. In
contrast, lactovegetarians (vegetarians who consume
dairy products) have higher LDL-C (approximately 24%
higher) and HDL-C (approximately 7% higher) concentrations compared to vegetarians. Within 20 weeks, a
lactovegetarian diet regimen accompanied by low protein
and high dietary fiber intake can reduce adrenocortical
activity. Lactovegetarians have higher plasma concentrations of dehydroepiandrosterone sulfate (DHEAS)
compared to nonvegetarians (individuals who adhere
to a moderately protein-rich diet). Moreover, lactovegetarians have reduced urinary 24-hr excretion rates for
C-peptide, free cortisol, DHEAS, and total 17ketosteroid [40]. In middle-aged North American black
individuals, reduced urinary 24-hr excretion rates of
adrenal and gonadal androgen metabolites occurred
following a conversion from the meat-containing
Western diet to the vegetarian diet. The fecal fat test,
which measures the amount of fat content in stool to
diagnose absorption or digestion abnormalities, is susceptible to dietary influences. It is critical that individuals refrain from significant dietary changes before
and during sample collection.
The hCG diet consists of hCG sublingual drops
or injections paired with a low 500-calorie diet. As previously discussed, hCG can be of placental or nonplacental origin. hCG is evident in placental trophoblastic
(hydatidiform mole and choriocarcinoma), gonadal
(ovarian, testicular, or extragonadal teratoma), ectopic,
or nontrophoblastic tumors. Exogenous hCG may be
detectable in the body 10 days post injection/ingestion.
Individuals on the hCG diet who received injections of
hCG had markedly elevated serum hCG concentrations in the absence of pregnancy or malignancy [41].
It is obvious that individuals on the hCG diet may
have unreliable test results. However, the effects of
hCG sublingual drops on laboratory tests are
unknown. In healthy males, hCG injections (purified
urinary and recombinant hCG) stimulate Leydig cells
ACCURATE RESULTS IN THE CLINICAL LABORATORY
14
2. EFFECT OF AGE, GENDER, DIET, EXERCISE, AND ETHNICITY ON LABORATORY TEST RESULTS
and cause a dose-dependent increase in serum testosterone concentrations [42].
Fasting/Starvation-Related Changes on
Clinical Laboratory Values
Fasting (decreased caloric intake) and starvation
(no caloric intake) initiate complex metabolic derangements. Many individuals fast in accordance with
culture and religious traditions, so understanding the
effects of fasting on laboratory results is paramount.
Within 3 days of fasting, glucose concentrations rise
by as much as 18 mg/dL despite the body’s coordinated efforts to conserve proteins. Subsequently, insulin rapidly declines while glucagon secretion increases
in an effort to restore blood glucose to pre-fasting
concentrations. The fasting individual undergoes both
lipolysis and hepatic ketogenesis. The metabolic acidosis state includes elevated serum acetoacetic acid,
β-hydroxybutyrate, and fatty acids and reduced pH,
pCO2, and bicarbonate. Focal necrosis of the liver is
responsible for reduced hepatic blood flow and
impaired glomerular filtration and creatinine clearance;
elevated serum ALT, AST, bilirubin, creatinine, and
lactate concentrations [3].
The body’s reduced energy stores mainly account
for significant declines up to 50% in both total and free
triiodothyronine concentrations. Fasting differentially
affects lipid concentrations. Within 6 days, cholesterol
and triglycerides increase while HDL concentrations
decrease. Sharp increases up to 15 times the pre-fast
plasma in growth hormone concentrations occur early
in fasting. Within 3 days of completing a fast, the
plasma growth hormone concentration returns to
pre-fast levels. Albumin, prealbumin, and complement
3 concentrations decline during an extended fast.
However, protein intake following fasting rapidly
returns albumin, prealbumin, and complement 3 to
pre-fasting concentrations.
Starvation triggers the release of aldosterone and
excessive urinary ammonia, calcium, magnesium, and
potassium excretion. In contrast, the body’s urinary
excretion of phosphorus declines. Following a shortterm, 14-hr fast, acetoacetate, β-hydroxybutyrate,
lactate, and pyruvate blood concentrations begin to
rise. Long-term starvation lasting for 40À48 hr causes
up to a 30-fold increase in β-hydroxybutyrate.
Reportedly, starvation for 4 weeks significantly
increased AST, creatinine, and uric acid (20À40%) and
decreased GGT, triglycerides, and urea (20À50%).
Upon adequate caloric intake, the body begins to
restore blood constituents to pre-fasting concentrations and retains sodium as a result of decreased
urinary excretion of both sodium and chloride.
Subsequently, aldosterone exceeds fasting concentrations, and urinary excretion potassium slowly returns
to normal.
EFFECTS OF NUTRACEUTICALS
ON CLINICAL LABORATORY
TEST RESULTS
In 1989, Dr. Stephen DeFelice coined the term nutraceutical from the two words “nutrition” and “pharmaceutical.” Nutraceuticals, according to the American
Nutraceutical Association, include functional foods
with health-promoting and disease-preventing benefits. Rigorous safety and efficacy studies are lacking in
the field. The pharmacokinetic properties of the
commercially available nutraceuticals still need to be
elucidated. An estimated 100 million Americans use
dietary supplements regularly. Although nutraceuticals exhibit pharmacological effects, patients do not
consider them “drugs” and often do not disclose usage
to their physicians [43]. How nutraceuticals and conventional drugs interact within the body requires more
investigation. Few studies have documented the
pharmacokinetics of nutraceuticals and their effects
on laboratory results [44]. High-protein supplements
cause intermittent abdominal pain. Laboratory studies
have reported that high-protein diets can lead to
hyperalbuminemia and increased concentrations of
AST and ALT. Albumin and liver enzyme activities
returned to normal after patients discontinued using
the high-protein supplements [45]. Widely used as an
antidepressant, St. John’s wort (Hypericum perforatum)
markedly interferes with the metabolism of prescribed drugs. St. John’s wort is a potent inducer of
P-glycoprotein and cytochrome P450 3A4 (CYP3A4)
and, to a lesser extent, CYP1A2 and CYP2C9 [43].
Co-administration of St. John’s wort significantly
alters concentrations of cyclosporine (transplant rejection) [46], indinavir (HIV inhibitor) [47], and digoxin
(P-glycoprotein transporter) [48]. Royal jelly, produced by special glands in the heads of nurse honeybees, is a nutrient-rich food for queen bees. An
elderly man undergoing warfarin therapy developed
hematuria and an elevated international normalized
ratio (7.29) after taking royal jelly supplements for 1
week. The mechanisms by which royal jelly increases
the effects of warfarin are not clear. Valerian, prescribed for its antidepressant properties, causes acute
hepatotoxicity (elevated ALT, AST, and GGT).
Valerian’s long-term effects on liver function are
unknown. See Chapter 7 for more in-depth discussion on the effects of herbal supplements on clinical
laboratory test results.
ACCURATE RESULTS IN THE CLINICAL LABORATORY
15
EFFECTS OF ETHNICITY/RACE ON CLINICAL LABORATORY TEST RESULTS
EFFECTS OF EXERCISE ON CLINICAL
LABORATORY TEST RESULTS
The effect of exercise on laboratory findings varies
and highly correlates with the health status of the
person [49], temperature, and dietary intake (food or
liquid) that occurs during or following exercise [50].
Figure 2.1 shows the frequency distribution of serum
creatinine concentrations in athletes and controls
(sedentary people) [49]. Alterations in thyroid function
occur during high-intensity exercise. Anaerobic exercise
elicits increases in T4, free T4, and thyroid-stimulating
hormone and decreases in T3 and free T3 [51]. Physical
exercise significantly alters plasma volume as a result
of fluid volume loss due to sweating and fluid shifts
between both intravascular and interstitial bodily compartments [52]. Exercise reduces urinary erythrocyte and
leukocyte content and the volume of urine while increasing the urinary protein excretion. Elevated urinary protein will resolve within 24À48 hr. Following exercise,
a transient increase in white blood cells, hematocrit, and
platelets occurs in parallel with electrolyte abnormalities
(serum potassium decreases by 8%), which are present
due to the altered hydration state and usually normalize
with rehydration. Dehydration causes elevated creatinine and BUN concentrations. In the setting of severe
dehydration, a sharp rise in BUN occurs, but creatinine
is only mildly elevated. Again, rehydration will gradually decrease these concentrations to normal.
Regular vigorous exercise raises HDL-C and lowers triglycerides, VLDL-C, and LDL-C. AST, ALT,
LD, creatinine kinase (CK), and myoglobin significantly increase following weight lifting and can
remain elevated for up to 7 days post exercise [53].
Frequency distribution, %
75%
60%
Athletes
Control
45%
30%
15%
0%
FIGURE 2.1
<–88 µmol/L
Serum ceratinine
>88 µmol/L
Frequency distribution of serum creatinine concentrations in the two groups, athletes and controls. Data are divided
considering as threshold the median value of the control group
[88 μmol/L (1.0 mg/dL)]. Source: Reprinted with permission from the
American Association for Clinical Chemistry, publisher of Clinical
Chemistry. From Banfi, G., Del Fabbro, M. Serum creatinine values in
elite athletes competing in 8 different sports: Comparison with sedentary
people. Clinic Chemistry 2006; 52(2), 330À331.
These findings highlight the importance of refraining
from weight lifting prior to clinical laboratory testing.
Healthy males who cycled for 30 min (maximal heart
rate of 70À75%) and recovered for 30 min had significant increases in hematocrit, red blood cell count,
plasma albumin and fibrinogen concentrations,
plasma viscosity, and whole blood viscosity [54].
However, the changes were temporary, and concentrations returned to baseline after the 30-min recovery
period. In endurance runners, exercise-associated iron
deficiency is common. Moderately trained female
long-distance runners who underwent long-term
endurance exercise (8 weeks) did not have changes in
high-sensitivity C-reactive protein, suggesting that
inflammation is not a normal process of endurance
training. Changes in both serum hepcidin and soluble
transferrin receptor may explain the higher prevalence of iron deficiency in this population. Analytes
affected by exercise are summarized in Table 2.1.
EFFECTS OF ETHNICITY/RACE
ON CLINICAL LABORATORY
TEST RESULTS
Several analytes exhibit race-related changes, and it
is important for laboratory professionals to recognize
such changes [55]. Total serum protein concentration
is usually higher in African Americans than in white
individuals, mostly attributable to γ-globulin concentrations. Serum albumin concentrations, on average, are
lower in the African American population compared
TABLE 2.1 Analytes That Are Affected by Exercise
Analyte
Effect of exercise
Urea
Value may increase after exercise
Creatinine
Value may increase after exercise
Aspartate aminotransferase
Value may increase after exercise
Lactate dehydrogenase
Value may increase after exercise
Total creatinine kinase (CK)
Value may increase after exercise
CK-MB
Value may increase after exercise
Myoglobin
Value may increase after exercise
WBC count
Value may increase after exercise
Platelet count
Value may increase after exercise
Prothrombin time
Value may increase after exercise
D-dimer
Value may increase after exercise
Packed cell volume
Value may decrease after exercise
Activated partial
thromboplastin time
Value may decrease after exercise
Fibrinogen
Value may decrease after exercise
ACCURATE RESULTS IN THE CLINICAL LABORATORY
16
2. EFFECT OF AGE, GENDER, DIET, EXERCISE, AND ETHNICITY ON LABORATORY TEST RESULTS
to the white population. The activity of CK is usually
lower in white individuals compared to African
Americans. African American children usually have
higher ALP than white children. Serum cystatin C significantly correlated with race/ethnicity in adolescents
(ages 12À19 years) [15]. Cystatin C concentrations
were higher in non-Hispanic white compared to nonHispanic black and Mexican Americans. In contrast,
creatinine was lower in non-Hispanic white and
Mexican Americans compared with non-Hispanic black
Americans. In an adult population-based sample (ages
50À67 years), black men had higher 24-hr urinary excretion of creatinine, epinephrine, and norepinephrine
compared to white men in the study [34]. In the U.S.
Modified Diet of Renal Disease (MDRD) calculation,
an ethnicity factor of 1.2 aids in the estimation of GFR
in African Americans. However, two large studies conducted in sub-Saharan Africa (Ghana (N 5 944) and
South Africa (N 5 100)) showed that the MDRD equation performed better in the absence of the ethnicity
actor of 1.2 [56]. In a Saudi population (N 5 32), GFR
estimated by MDRD strongly correlated with the measured inulin clearance [57]. However, in a Japanese population (N 5 248), GFR estimated by the 0.881 3 MDRD
equation correlated better with measured inulin clearance than with the 1.0 3 MDRD equation [58]. Clearly,
estimation of GFR by MDRD varies by global region.
The variability of GFR may correlate with genetic/
environmental factors associated with body muscle
mass. Carbohydrate and lipid metabolism also differ
between black and white individuals. On average,
African Americans exhibit less glucose tolerance than
white individuals. However, in a cohort of individuals
with normal glucose tolerance, African Americans
had higher hemoglobin A1c concentrations compared
to white individuals [59]. Significant hematologic
differences exist between healthy African Americans
and white individuals who are iron sufficient. African
Americans have lower hemoglobin concentrations
and are more likely to be diagnosed with anemia
compared to white individuals [60]. Interpretation of
laboratory findings based solely on the presumed
effect of ethnicity/race is not appropriate.
CONCLUSIONS
It is necessary for laboratory professionals to
implement age- and gender-specific reference ranges
for certain analytes, and such reference range
information should be a part of routine reporting of
laboratory test results. Nevertheless, diet, exercise,
and other factors may alter laboratory test results,
and proper investigation must be made to interpret
such laboratory test results for proper patient
management. Especially for pharmacogenetics testing,
ethnic differences are obvious for certain isoenzymes
of the cytochrome P450 mixed function oxidase
family of enzymes. This important topic is discussed
in-depth in Chapter 22.
References
[1] Wolcott JS, Amanda. Goodman, Clifford. Laboratory
Medicine: A National Status Report: The Lewin Group, Falls
Church, VA; 2008.
[2] St.-Onge MP, Gallagher D. Body composition changes with
aging: the cause or the result of alterations in metabolic rate
and macronutrient oxidation? Nutrition 2010;26(2):152À5.
[3] Burtis CAAE, Bruns DE, editors. Tietz textbook of clinical
chemistry and molecular diagnostics. 4th ed. St. Louis, MO:
Saunders; 2006.
[4] Reference ranges and what they mean. Lab Tests Online. 2001.
[5] Kibak P. The status of laboratory medicine. Clinical laboratory
news. August ed. Washington, DC: American Association for
Clinical Chemistry; 2008. p. 1À3.
[6] Proytcheva MA. Issues in neonatal cellular analysis. Am J Clin
Pathol 2009;131(4):560À73.
[7] Young M, Bermes EW. Specimen collection and other preanalytical variables. In: Burtis CA, Ashwood E, editors. Tietz
fundamentals of clinical chemistry. 5th ed. Philadelphia:
Saunders; 2001. p. 30À54.
[8] Subcommittee on hyperbilirubinemia. Management of hyperbilirubinemia in the newborn infant 35 or more weeks of gestation. Pediatrics. 2004;114(1):297À316.
[9] Joubert-Huebner E. Transitional Period in the Newborn
after Birth. Available at , />Transitional_Period.pdf/.; 2010.
[10] Soldin SJWE, Brugnara C, Soldin OP, editors. Pediatric reference
intervals. 7th ed. Washington, DC: American Association for
Clinical Chemistry; 2011.
[11] Biro FM, Galvez MP, Greenspan LC, Succop PA, Vangeepuram
N, Pinney SM, et al. Pubertal assessment method and baseline
characteristics in a mixed longitudinal study of girls. Pediatrics
2010;126(3):e583À90.
[12] Sorensen K, Aksglaede L, Petersen JH, Juul A. Recent
changes in pubertal timing in healthy Danish boys: associations with body mass index. J Clin Endocrinol Metab
2010;95(1):263À70.
[13] Turan S, Topcu B, Gokce I, Guran T, Atay Z, Omar A, et al.
Serum alkaline phosphatase levels in healthy children and
evaluation of alkaline phosphatase z-scores in different types
of rickets. J Clin Res Pediatr Endocrinol 2011;3(1):7À11.
[14] Kutilek S, Cervickova B, Bebova P, Kmonickova M, Nemec V.
Normal bone turnover in transient hyperphosphatasemia.
J Clin Res Pediatr Endocrinol 2012; [Epub ahead of print].
[15] Groesbeck D, Kottgen A, Parekh R, Selvin E, Schwartz GJ,
Coresh J, et al. Age, gender, and race effects on cystatin C levels
in U.S. adolescents. Clin J Am Soc Nephrol 2008;3(6):1777À85.
[16] Cole LA, Sasaki Y, Muller CY. Normal production of human
chorionic gonadotropin in menopause. N Engl J Med 2007;356
(11):1184À6.
[17] Snyder JA, Haymond S, Parvin CA, Gronowski AM, Grenache
DG. Diagnostic considerations in the measurement of human
chorionic gonadotropin in aging women. Clin Chem 2005;51
(10):1830À5.
[18] Palmer OM, Grenache DG, Gronowski AM. The NACB
laboratory medicine practice guidelines for point of care
reproductive testing. J Near-Patient Test Technol 2007;6
(4):265À72.
ACCURATE RESULTS IN THE CLINICAL LABORATORY
REFERENCES
[19] Gronowski AM, Fantz CR, Parvin CA, Sokoll LJ, Wiley CL,
Wener MH, et al. Use of serum FSH to identify perimenopausal women with pituitary hCG. Clin Chem 2008;54
(4):652À6.
[20] Association of aging. Aging Statistics. U.S. Department of
Health and Human Services, Washington, DC; 2011.
[21] Brigden ML, Heathcote JC. Problems in interpreting laboratory
tests: what do unexpected results mean? Postgrad Med
2000;107(7):145À6 51À2, 55À8 passim.
[22] McLean AJ, Le Couteur DG. Aging biology and geriatric clinical
pharmacology. Pharmacol Rev 2004;56(2):163À84.
[23] Cooper MS, Gittoes NJ. Diagnosis and management of hypocalcaemia. BMJ 2008;336(7656):1298À302.
[24] Luggen AS, editor. Laboratory values and implications for the
aged. 6th ed. St. Louis: Mosby; 2004.
[25] van der Velde M, Bakker SJ, de Jong PE, Gansevoort RT.
Influence of age and measure of eGFR on the association
between renal function and cardiovascular events. Clin J Am
Soc Nephrol 2010;5(11):2053À9.
[26] Veldhuis JD, Roelfsema F, Iranmanesh A, Carroll BJ, Keenan
DM, Pincus SM. Basal, pulsatile, entropic (patterned), and spiky
(staccato-like) properties of ACTH secretion: impact of age,
gender, and body mass index. J Clin Endocrinol Metab 2009;94
(10):4045À52.
[27] Matsumoto AM. Andropause: clinical implications of the decline
in serum testosterone levels with aging in men. J Gerontol Series
A, Biol Sci Med Sci 2002;57(2):M76À99.
[28] Harman SM, Metter EJ, Tobin JD, Pearson J, Blackman MR.
Longitudinal effects of aging on serum total and free testosterone
levels in healthy men: Baltimore Longitudinal Study of Aging.
J Clin Endocrinol Metab 2001;86(2):724À31.
[29] Janu MR, Creasey H, Grayson DA, Cullen JS, Whyte S, Brooks
WS, et al. Laboratory results in the elderly: the Sydney Older
Persons Study. Ann Clin Biochem 2003;40(Pt 3):274À9.
[30] Tipton KD. Gender differences in protein metabolism. Curr
Opin Clin Nutr Metab Care 2001;4(6):493À8.
[31] Thalacker-Mercer AE, Johnson CA, Yarasheski KE, Carnell NS,
Campbell WW. Nutrient ingestion, protein intake, and sex, but
not age, affect the albumin synthesis rate in humans. J Nutr
2007;137(7):1734À40.
[32] Deeg M. Lipid Topics. 2006.
[33] Kelly GS. Seasonal variations of selected cardiovascular risk
factors. Altern Med Rev 2005;10(4):307À20.
[34] Masi CM, Rickett EM, Hawkley LC, Cacioppo JT. Gender and
ethnic differences in urinary stress hormones: the populationbased chicago health, aging, and social relations study. J Appl
Physiol 2004;97(3):941À7.
[35] Fraser C. Biological variation: from principles to practice.
Washington, DC: AACC Press; 2001.
[36] Niv Y, Fraser GM. The alkaline tide phenomenon. J Clin
Gastroenterol 2002;35(1):5À8.
[37] Dimeski G. Interference testing. Clin Biochem Rev 2008;29
(Suppl. 1):S43À8.
[38] Andersson M, Ellegard L, Andersson H. Oat bran stimulates
bile acid synthesis within 8 h as measured by 7alpha-hydroxy4-cholesten-3-one. Am J Clin Nutr 2002;76(5):1111À16.
[39] Yancy Jr WS, Olsen MK, Guyton JR, Bakst RP, Westman EC.
A low-carbohydrate, ketogenic diet versus a low-fat diet to
treat obesity and hyperlipidemia: a randomized, controlled
trial. Ann Intern Med 2004;140(10):769À77.
[40] Remer T, Pietrzik K, Manz F. Short-term impact of a lactovegetarian diet on adrenocortical activity and adrenal androgens.
J Clin Endocrinol Metab 1998;83(6):2132À7.
[41] Woolsey CJGJ, Nielsen GL. The effects of the hCG diet on common
pregnancy tests. Ogden, UT: Weber State University; 2012.
17
[42] Handelsman DJ. Clinical review: the rationale for banning
human chorionic gonadotropin and estrogen blockers in sport.
J Clin Endocrinol Metab 2006;91(5):1646À53.
[43] Hennessy M, Kelleher D, Spiers JP, Barry M, Kavanagh P, Back
D, et al. St. Johns wort increases expression of P-glycoprotein:
implications for drug interactions. Br J Clin Pharmacol 2002;53
(1):75À82.
[44] Dasgupta A. Herbal supplements: efficacy, toxicity, interactions
with Western drugs, and effects on clinical laboratory tests.
Hoboken, NJ: Wiley; 2011.
[45] Mutlu EAKA, Mutlu GM. Hyperalbuminemia and elevated
transaminases associated with high-protein diet. Scand J
Gastroenterol 2006;41:759À60.
[46] Ruschitzka F, Meier PJ, Turina M, Luscher TF, Noll G. Acute
heart transplant rejection due to Saint John’s wort. Lancet
2000;355(9203):548À9.
[47] Piscitelli SC, Burstein AH, Chaitt D, Alfaro RM, Falloon J.
Indinavir concentrations and St John’s wort. Lancet 2000;355
(9203):547À8.
[48] Johne A, Brockmoller J, Bauer S, Maurer A, Langheinrich M, Roots
I. Pharmacokinetic interaction of digoxin with an herbal extract
from St John’s wort (Hypericum perforatum). Clin Pharmacol Ther
1999;66(4):338À45.
[49] Banfi G, Del Fabbro M. Serum creatinine values in elite athletes
competing in 8 different sports: comparison with sedentary
people. Clin Chem 2006;52(2):330À1.
[50] Dufour D. Effects of habitual exercise on routine laboratory
tests. Clin Chem 1998;44:136.
[51] Ciloglu F, Peker I, Pehlivan A, Karacabey K, Ilhan N, Saygin O,
et al. Exercise intensity and its effects on thyroid hormones.
Neuro Endocrinol Lett 2005;26(6):830À4.
[52] Ritchie RF, Ledue TB, Craig WY. Patient hydration: a major
source of laboratory uncertainty. Clin Chem Lab Med 2007;45
(2):158À66.
[53] Pettersson J, Hindorf U, Persson P, Bengtsson T, Malmqvist U,
Werkstrom V, et al. Muscular exercise can cause highly pathological liver function tests in healthy men. Br J Clin Pharmacol
2008;65(2):253À9.
[54] Ahmadizad S, Moradi A, Nikookheslat S, Ebrahimi H,
Rahbaran A, Connes P. Effects of age on hemorheological
responses to acute endurance exercise. Clin Hemorheol
Microcirc 2011;49(1À4):165À74.
[55] Horn PS, Pesce AJ. Effect of ethnicity on reference intervals.
Clinical Chemistry 2002;48(10):1802À4.
[56] Eastwood JB, Kerry SM, Plange-Rhule J, Micah FB, Antwi S,
Boa FG, et al. Assessment of GFR by four methods in
adults in Ashanti, Ghana: the need for an eGFR equation
for lean African populations. Nephrol Dial Transplant
2010;25:2178À87.
[57] Al Wakeel JSHD, Al Suwaida A, Tarif N, Chaudhary A, Isnani
A, Albedaiwi WA, et al. Validation of predictive equations
for glomerular filtration rate in the Saudi population. Saudi J
Kidney Dis Transpl 2009;20(6):1030À7.
[58] Imai E, Horio M, Nitta K, Yamagata K, Iseki K, Hara S, et al.
Estimation of glomerular filtration rate by the MDRD study
equation modified for Japanese patients with chronic kidney
disease. Clin Exp Nephrol 2007;11(1):41À50.
[59] Ziemer DC, Kolm P, Weintraub WS, Vaccarino V, Rhee MK,
Twombly JG, et al. Glucose-independent, black-white differences in hemoglobin A1c levels: a cross-sectional analysis of 2
studies. Ann Int Med 2010;152(12):770À7.
[60] Beutler E, West C. Hematologic differences between AfricanAmericans and whites: the roles of iron deficiency and alphathalassemia on hemoglobin levels and mean corpuscular volume.
Blood 2005;106(2):740À5.
ACCURATE RESULTS IN THE CLINICAL LABORATORY