INVESTIGATION OF MECHANISM OF MORPHOLOGICAL CHANGES IN COASTAL ZONE AND STRUCTURAL SOLUTIONS FOR STABILIZATION APPLICATION FOR XUONG HUAN BEACH REGION IN NHA TRANG BAY
Bạn đang xem bản rút gọn của tài liệu. Xem và tải ngay bản đầy đủ của tài liệu tại đây (1.96 MB, 27 trang )
MINISTRY OF EDUCATION AND
MINISTRY OF AGRICULTURE
TRAINING
AND RURAL DEVELOPMENT
THUYLOI UNIVERSITY
NGUYEN VIET DUC
INVESTIGATION OF MECHANISM OF MORPHOLOGICAL
CHANGES IN COASTAL ZONE AND STRUCTURAL
SOLUTIONS FOR STABILIZATION - APPLICATION FOR
XUONG HUAN BEACH REGION IN NHA TRANG BAY
Specialization: Hydraulic Engineering
Code No.: 62-58-02-02
SUMMARY OF DOCTORAL DISSERTATION
HANOI, 2016
1
The work was completed at: Thuyloi University
Advisor 1: Assoc. Prof. Dr. Nguyen Trung Viet
Advisor 2: Prof.Dr. People’s Teacher. Nguyen Chien
Reviewer 1: Prof. Dr. Tran Dinh Hoi, Institute for Water, Environment and
Climate Change
Reviewer 2: Assoc. Prof. Dr. Nguyen Danh Thao, Ho Chi Minh City University
of Technology
Reviewer 3: Assoc. Prof. Dr. Phung Dang Hieu, Vietnam Administration of Seas
and Islands
This dissertation will be defended at the meeting of the University Doctoral
Committee in room No…………………on ……………….
This dissertation is available at:
- The National Library
- The Library of Thuyloi University
2
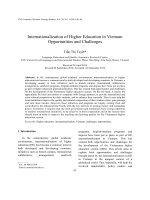
INTRODUCTION
1.
Rationale
Vietnam with more than 3,260km of coastline, ranks 27th in the world, out of
157 countries adjacent to the sea. Nha Trang Bay is one of the 29 most beautiful
bays in the world, a center of tourism and services, with rapid economic growth
of Khanh Hoa province in particular and the South-Central region in general.
Besides the strengths in tourism, Nha Trang beach area has currently some
limitations: Beach narrowing, steep beach slope and seasonal variations; Large
waves impact the nearshore. Until now there is no study to fully identify the main
mechanism of erosion-accretion processes, sediment transport and causes
affecting the coastal zone changes. Therefore, this research will focus on the
hydrodynamic regime, erosion-accretion mechanisms, wave and current impacts
to the coastal zone morphological changes, then based on these new findings to
propose suitable technical solutions to protect and embellish the beach area of
Nha Trang Bay coast effective, long-term stability.
2.
Research objectives
Describing and explaining the mechanism of seasonal accretion-erosion;
clarifying the hydrodynamic regime, sediment transport mechanisms and other
main influencing factors causing beach morphological changes; proposing and
selecting the suitable structural solutions to upgrade the Nha Trang Beach area.
3.
Scope of the Study
Study on the hydrodynamic regime, erosion-deposition mechanisms, wave and
total current impact to the coastal morphological changes in Xuong Huan Beach,
Nha Trang Bay.
4.
Research contents
Literature review on the mechanism of morphological changes in coastal zone
and coastal engineering works for beach stabilization; Scientific research
proposing the suitable structural solutions to stabilize and further extend the
Xuong Huan beach area, Nha Trang Bay.
3
5.
Approach and study methods
To achieve the objectives, the author carried out a literature review on the
hydrodynamic modelling of wave and current as well as sediment transport, field
surveys (Video-camera observation and drifter experiment to measure the total
nearshore current); and practical application.
6.
Scientific and practical significance
6.1.
Scientific significance
The drifter buoy method is introduced and successfully applied to study the
hydrodynamic regime in the coastal area of Nha Trang Bay, the data is used for
the calibration and validation processes of numerical models.
The thesis has clearly clarified sediment transport mechanisms, find out the main
causes and assess the role of each hydrodynamic factor impacts the coastal
morphological changes.
6.2.
Practical significance
Successfully provide a suitable structural solution to stabilize and restore beaches
in this study area in particular and any other eroded beaches in general.
7.
New contributions
1. Successful application the drifter buoy technique to measure the nearshore
total current velocity;
2. Clearly clarified the mechanism of erosion and accretion in the study areas and
proposed appropriated countermeasures for the coastal stabilization;
8.
Dissertation contents
In addition to the Introduction, Conclusions and Recommendations, this
dissertation consists of 04 chapters as follows:
Chapter 1: Overview of morphological changes in coastal zone and coastal
countermeasures for stabilization
Chapter 2: Scientific research basis on the mechanisms of coastal morphological
changes
4
Chapter 3: Investigation of the mechanisms of coastal evolution in Xuong Huan
Beach, Nha Trang Bay
Chapter 4: Investigation of the proposals of coastal structural solutions in order to
stabilize the Xuong Huan Beach, Nha Trang Bay
CHAPTER 1 OVERVIEW OF MORPHOLOGICAL CHANGES IN
COASTAL ZONE AND COASTAL COUNTERMEASURES FOR
STABILIZATION
1.1
1.1.1
Introduction
Coastal zone definition
A coastal zone is the interface between the land and water. These zones are
important because a majority of the world's population inhabit such zones. Coastal
zones are continually changing because of the dynamic interaction between the
oceans and the land and affecting by waves and tides. The coastal zone consists of
three components such as backshore, foreshore and inshore or shoreface.
1.1.2
Scientific-Technology research issues on the coastal morphological changes
The main scientific-technology research issues on the coastal morphological
changes are morphological characteristics; coastal sediment distribution and
classification; coastal zone hydrodynamic and sediment transport; and coastal
protection structures.
1.2
1.2.1
Overview of overseas research on the mechanism of coastal
morphological changes and stabilization structures
Research history on coastal zone evolution
Research in the construction of coastal protection works, the port is always
associated with the development of human civilization. Some ancient ports are
still exist until this day. The Greek and Latin documents from Herodotus,
Josephs, Suetonius ... mentioned the description of the coastal research. Ancient
researchers have well understanding the coastal dynamic processes such as the
flow pattern of the coastal areas of the Mediterranean, prevailing winds and the
5
effects of wind and waves. Ancient Rome was the first to set up wind rose denotes
inshore winds mode ...
1.2.2
Research on coastal zone evolution
The study on coastal zone evolution have been concerned a long time ago. Research
achievements have clearly indicated that natural processes are clearly understood
over time, the research findings have also been compiled and published in scientific
articles or the book which are valuable for referencing in this study.
1.2.3
Overview of research methods on coastal zone morphological changes
Previously research methods coastal zone changes are made in the following
order: Measurement of waves, currents, sediment concentration, then calculate
sediment transport rate by using some semi-empirical formulas and assess
changes in the topography of the studied area.
Current research methods are mainly used numerical simulation models together
with the field data measurements.
1.2.4
Overview of wave and current numerical simulation models
The numerical simulation models are usually classified into four categories
according to the its application domain as follows: deep water - the effect of the
bottom is neglected; transitional region - area between deep water and shallow
water; shallow water region - where the shallow water effect is important; and
human construction works - need to take into account the interaction between
waves on structures. In addition, the models can be divided into two types: Phase
and Phase-averaged models.
The common numerical models for the hydrodynamic and morphological
changes are: GENESIS; UNIBEST, SOBEK 2D, Delft3D; MIKE; NPM, SMS;
CEDAS, EFDC, FVCOM, TELEMAC-MASCARET, etc. … In Vietnam, the
MIKE, DELFT3D and EFDC models are popularly used.
1.2.5
Overview of nearshore sediment transport formulas
Based on field observation data, physical model experiments, theoretical analysis
..., scientists around the world have come up with many semi-empirical formula,
6
each formula has a certain scope of application. Some typical formula are: CERC
Formula ; Kamphuis Formula ...
1.2.6
Overview of coastal protection and stabilization structures
To protect and stable the shore, beach in the world is often used single or various
combinations of the following basic technical solutions: sea dye structure; groins;
breakwater; beach nourishment and mangrove planting
1.3
1.3.1
Overview of Vietnam’s research on the mechanism of coastal
morphological changes and stabilization structures
Research on coastal zone morphological changes
Research on coastal zone morphological changes have been mainly carried out
in the framework of national research programs in recent years, quite detail
explanation of shoreline changes, coastal erosion and deposition along to
Vietnam’s Coastline were described on the map of 1/250,000 and 1/100,000, has
a preliminary explanation of causes to the problems, of which exogenous impact
is the most important.
Research on coastal protection and stabilization structures
In the past, the roof paving embankment constructions are used mainly as passive
solutions. Recent years, many other structural solutions have applied to prevent
coastal erosion and wave reduction such as - groin, but these works only built as
an experiment. There are many studies on the estuaries and coasts stability, but
it was only given a general technical solutions and dike structures. Due to the
complexity and local difference so each region should have its own research, so
far still lack the technical guidelines on spatial layout of structures to prevent
coastal problems...
1.3.2
Previous researches on Nha Trang’s coastal zone
There are quite many previous studies on Nha Trang coastal zone, but no study
has yet enough systematic and reliable data to come up with the hydrodynamic
regime, sediment transport mechanisms and evolution of coastal zone. Recently,
the Protocol Project between the Thuyloi University, Vietnam and the Institute
for Research Development (IRD), France has been measuring in detail of
7
bathymetry, bottom sediments, water level and current velocity. The
characteristic of hydrodynamic regime, suspended sediment transport have been
studied quite well. However, this project have not studied in depth the causes and
mechanisms of coastal morphological changes, especially the role of waves and
total neashore currents to the beach morphological changes.
1.4
Dissertation’s research proposals
This dissertation is aiming to combine the study of empirical field observation
and numerical simulation for addressing following topics: describe and explain
the mechanism of seasonal beach erosion and deposition; unravelling the
hydrodynamic regime, sediment transport mechanisms and find out the main
influencing factors causing beach morphological changes; proposing the best
structural solutions to improve the Nha Trang Beach area.
1.5
Conclusions of Chapter 1
In this chapter the author has studied to clarify:
1. Overview of overseas researches on the mechanism of coastal morphological
changes and stabilization structures includes research history on coastal zone
evolution; research on coastal zone evolution; overview of research methods on
coastal zone morphological changes; overview of wave and current numerical
simulation models; overview of nearshore sediment transport formulas and
overview of coastal protection and stabilization structures
2. Overview of Vietnam’s research on the mechanism of coastal morphological
changes and stabilization structures; research on coastal zone morphological
changes; research on coastal protection and stabilization structures; previous
researches on Nha Trang’s coastal zone
3. This dissertation is aiming to address the mechanism of seasonal beach erosion
and deposition; wave impacts; unravelling the hydrodynamic regime, sediment
transport mechanisms and find out the main influencing factors causing beach
morphological changes based on the detail and reliable measurement data sets;
proposing the best structural solutions to effectively protect and the long-term
stability of Nha Trang Beach area.
8
CHAPTER 2 SCIENTIFIC RESEARCH BASIS ON THE MECHNISMS
OF COASTAL MORPHOLOGICAL CHANGES
2.1
Main factors causing Nha Trang beach morphological changes
The Nha Trang Beach morphological changes are the result of interactions between
endogenous , exogenous and human activities factors. The analysis of key factors
are included topography, geomorphology; distribution of sediment; Cai river
discharge; tidal regime; wave impacts; current flow regime in Nha Trang Bay and
human activities. Among these the steep beach slope causes the large waves can
approach the nearshore area. In the rainy season, Northeast wind-waves pass
through the northern coral area does not carry sediment to the south causing beach
erosion in Xuong Huan area. In contrast during the dry season, Southeast waves
bring sediment from Southeast Nha Trang Bay Islands to deposit along Tran Phu
beach, the distribution of fine sand particles gradually decrease from south to north
indicating this trend. East waves cause longshore sediment movement and maintain
the beach slope. The sediment from freshwater discharge of Cai river has a certain
influence on the amount of sediment along the adjacent beach through the rainy
season. Thus, the preliminary analysis shows that the main causes of seasonal
beach erosion and deposition changes are due to the impact of the waves and
topographic conditions of this area.
2.2
Data collection
The main data sets are using in this dissertation are: bathymetry, water level, river
discharge which were collected from the Protocol Project between the Thuyloi
University and the Institute for Research Development (IRD) in May and
December 2013. The author conducted a field measurement of total current
velocity by using the drifter technique in November 2015.
2.3
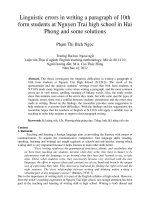
One-line model theory
The one-line model is used the simulate the longshore sediment transport rate in the
study area. The model was first developed by Pelnard-Considere (1956) Figure 2.17.
The governing equations for the longshore sediment transport are shown in
Equations (2.1) and (2.7).
9
y
1
Q
q
t
(D C D B ) x
y ,i y i
Q (D C D B )
x
t
(2.1)
(2.7)
Figure 2.17 Definition sketch for shoreline change calculation.
2.4
2.4.1
Research approaches of coastal zone morphological change
Seasonal variation of shoreline changes by video-camera analysis
In the framework of the Protocol Project between the Thuyloi University and the
Institute for Research Development (IRD) entitled as "Study on hydrodynamic
regime and sediment transport in estuarine and coastal zone of Nha Trang Bay,
Khanh Hoa Province ", a real-time monitoring system of video cameras were
deployed to observed the shoreline changes from March 2013. The photos are
continuous taken and uploaded to the data server, then the shoreline change can
detected by averaged out all photos in every 10 minutes. The dissertation are used
these image data sets and shoreline position that detected from the averaged-image
results to investigate the seasonal changes of Nha Trang beach.
2.4.2
Study on the total nearshore current velocity by drifting buoy method
Total nearshore current velocity is the combination of tidal current flow and nontidal current flow such as wave-induced current. Clarify this total nearshore
current velocity will be able to determine the trend of sediment movement in the
coastal zone. Therefore the author used the drifting buoy method to measure the
total current velocity.
10
2.4.2.1
Drifter buoy selection and design
a) Drifter buoy selection
After reviewing a number of drifting buoys design, the author has selected the
drifting buoy proposed by Davis in 1985 and applying to determine the total
nearshore current velocity measurement in coastal areas Nha Trang Bay.
b) Drifter buoy design (Davis 1985)
GPS Device
PVC pile: d=4cm
Buoy: d=10cm
Steel pile: d=13cm
Cloth
Weight ball: g=0.5kg
Figure 2.20 X-type drifting buoy
configuration by Davis 1985
2.4.2.2
Figure 2.21 Drifting buoy design
Scenarios and field measurements
a) Scenarios: Based on the tidal characteristics and local flow conditions.
b) Field measurements in the Cai estuary and coastal areas of Nha Trang Bay
Figure 2.1 Preparation, setup and deployment of drifting buoy in the
field (11/2015)
11
2.4.3
Coastal erosion and deposition by using the numerical simulation models
2.4.3.1
Introduction
Developing 3D hydrodynamic EFDC (Environmental Fluid Dynamics Code), open
source model has built for Nha Trang Bay areas. The model is then coupling with the
SWAN wave model and the Lagrangian Particle Tracking models (Figure 2.24).
• Boundary condition of discharge, water
level…
• Atmospheric condition
• Bed sediment distribution
• Critical bottom shear stresses
• Wind speed and direction
• Water level
• Drifter configurations
• Initial condition
SWAN
MODEL
•
•
•
•
EFDC
MODEL
Wave height
Wave period
Wave direction
Wave radiation shear…
L.P.T
MODEL
• Bed sediment distribution
• Critical bottom shear stresses
SEDIMENT
TRANSPORT
MODULE
MODEL RESULTS
•
•
•
•
•
•
•
•
Water level
Current velocity
Current/wave shear stress
Temperature, salinity
Water quality
Total current velocity and its tracking
Suspended sediment concentration
Morphological changes
Figure 2.24 Flowchart of numerical model linkages
2.4.3.2
Model grid and boundary conditions
Ke ga
East water level boundary
Tran Phu
Bridge
Dong Trang
Flow boundary
Xuong Huan
Area
Mui Chut
Hon tre Island
South water level boundary
Figure 2.25 Model grid and boundary conditions
12
2.4.3.3
Model calibration with the measurement data in May 2013
The model was running for entire year of 2013 data sets and export the model
results in May to compare with the measured data. The model comparison results
of current velocity at the Station A and Station B data shown a very good
agreement. The Nash index of water level comparison was reached to 96% of
accuracy, it is indicated that the model were well calibrated.
2.4.3.4
Model validation with the measurement data in December 2013
The measured data in December 2013 was used to validate the model again. The
validation results of current velocity at the Station A and Station C was comparable to
the measured data. The Nash index of modeled water level and measured water level at
the Station A and Station C were 95% and 93% of accuracy, respectively. This
demonstrated that the calibrated model was good enough for applying to the study area.
2.4.3.5
SWAN model calibration and validation
a) SWAN model calibration with the measurement data in May 2013
The comparison of modeled wave height and wave period were in order of
magnitude with the measured data. The BIAS and RMSE errors were 0.23m and
0.2m, respectively.
b) SWAN model validation with the measurement data in December 2013
The comparison results between wave height and wave period at the Station A in
December 2013 showed a better fit than the calibrated results during May 2013
due to the northeast wave was large and stability. The BIAS and RMSE errors
were reached to 0.13m and 0.18m, respectively.
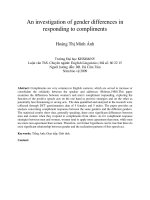
2.4.3.6
Total current velocity validation with the drifting buoy measurement
From November 26, 2015 to November 30, 2015, the author has conducted a
field survey to measure the total trajectory and velocity by using the drifting buoy
method. The survey was also trying to measure all the hydrodynamic factors at
the same time with drifting buoy experiments such as river discharge, water level,
tidal level as well as wind speed and direction. traffic, water, offshore wave and
wind parameters. The compatison results of water level and total trajectory and
velocity shown a good agreement to the measured data
13
500
1000
1500
0
2000
WRU-S02
Mo hinh
Do dac
WRU-S04
WRU-S05
0
500
1000
1500
Khoang cach (m)
2000
Van toc (m/s)
WRU-S03
0.88
0.66
0.44
0.22
0.81
0.54
0.27
0.00
0.51
0.34
0.17
0.00
0.81
0.54
0.27
0.00
0.78
0.52
0.26
0.00
0.81
0.54
0.27
0.00
0.81
0.54
0.27
0.00
100
200
300
400
0
500
Mo hinh
Do dac
WRU-S01
500
1000
1500
0.75
0.50
0.25
WRU-S06
WRU-B12
0.00
0.88
0.66
WRU-S07
WRU-S08
WRU-S09
WRU-S10
Total current
toc (m/s)(m/s)
Vanvelocity
0
0.44
0.22
WRU-B13
0.60
0.45
0.30
0.15
WRU-B14
0.56
0.42
0.28
0.14
WRU-B15
0.78
WRU-S11
0.26
0.00
0
100
200
300
400
Khoang cach (m)
Figure 2.42 Model versus data of
drifter buoy tracking comparison
500
Model
Mo
hinh
Do
dac
Data
0.52
WRU-B16
0
500
1000
1500
Distancecach
(m)(m)
Khoang
Figure 2.43 Model versus data of drifter
buoy total velocity comparison
As a result, the 3D EFDC hydrodynamic model which was coupled with the
SWAN model and Particle Tracking Lagrangian module has been successfully
calibrated and validated with the detail measurement data sets. The model results
have shown a very good comparison to the data and this model is good enough
to apply for the study areas.
2.5
Conclutions of Chapter 2
In this Chapter 2, many different scientific research methods have been carried
out to investigate the hydrodynamic and coastal zone morphological changes.
The following are the main achieved results:
1. The full detail databases were successfully compiled for studying the coastal
zone morphological changes and coastal stability structures for Nha Trang Beach.
2. Successful application the drifter buoy technique to measure the nearshore
total current velocity;
3. The 3D EFDC hydrodynamic model which was coupled with the SWAN
model and Particle Tracking Lagrangian module has been successfully calibrated
and validated for investigating the nearshore hydrodynamic and beach
morphological changes in the coastal areas in Nha Trang Bay.
14
CHAPTER 3 INVESTIGATION OF THE MECHANISMS OF COASTAL
EVOLUTION IN XUONG HUAN BEACH, NHA TRANG BAY
3.1
Analysis of accretion-erosion mechanism of the beach by means of
camera equipments
3.1.1
Data analysis by means of camera equipments
In nearly two years of operation (2013-2014) with a duration of 10 minutes per photo, the
camera equipment obtained thousands of photos of the beach in the study area adjacent to
Hotel 378 with an approximate length of 300 meters. By means of comparing the relative
position of the concrete revetment route with the coastline, we can recognize the accretion
or erosion of the beach. From this database, 8 featured photos were extracted for the purpose
of observation and analysis. With these photos, the qualitative variations (expansion shrinking) on a seasonal basis of the beach in the study area can be identified.
3.1.2
Analysis of top view variation of the beach in the study area
3.1.2.1
Coastline variation in the study area
Figure 3.2 Top view variation of the beach in the study area
In the study area, the erosion of the beach occurs during the north-east monsoon
period, while the shoreline accretion occurs during the rest. This shows that the
shoreline has a seasonsal variation every year.
3.1.2.2
Variation mechanism of the beach width
The analysis of beach width variation is conducted as shown in Figure 3.4. Beach width
in the area near Hotel 378 (zone 1, x < 70 m) is greater than 30 meters, and decreases
southwards (zone 4, x > 300m), which is only about 7 meters.
15
Bồi mạnh
Xói mạnh
Vùng 1
Figure 3.4 Variation of the beach width at some characteristic cross-sections
Based on the above analyses, it can be seen that the beach width in study areas
changes on a seasonal basis with sinusoidal period and amplitudes corresponding to
the bathymetry variation. Accretion process mainly occurs in the period from May
to August and erosion from October to January of next year.
3.2
3.2.1
Calculation of longshore sediment transport in terms of quantity and direction
Calculating the quantity of longshore sediment transport by means of PelnardConsidere emperical formula with the dataset obtained from camera equipments
The method of calculation of longshore sediment Pelnard-Considere is presented in Section
2.3 of Chapter 2. In formula (2.7), the temporal variable value of shoreline position (Δys/Δt)
is determined by means of image analysis techniques from camera surveillance system.
From formula (2.7), with continuous data sets of coastline from May 2013, Qx value over time can be
determined and is indicated by the diagram of longshore sediment transport as shown in Figure 3.6.
0
50
100
150
200
250
300
5
4
3
Y13-06-28
Y13-07-31
Y13-08-26
Y13-09-29
Y13-10-31
Y13-11-28
Y13-12-30
Y14-01-30
Y14-03-02
Q (m3/ngày)
Q (m3/ngay)
2
1
0
-1
-2
-3
-4
-5
0
50
100
150
200
250
300
Khoảngcach
cáchdoc
dọcbo
bờ(m)
(m)
Khoang
Figure 3.6 Diagram for the determination of the longshore sediment discharge in months
16
3.2.2
Determining the direction of longshore sediment transport corresponding to the
combined current regime
By means of drifting buoy method as described in Section 2.4.2 of Chapter 2, using
the self-made ones based on the prototype of Davis in 1985, the drifting orbits of the
buoys in the study area was measured in the period from 25th to 30th November
2015. The result shows that the combined littoral currents is from north to south as
shown in Figure 3.9, with the velocities shown in Table 3.2.
Figure 3.9 Results of orbit measurements of combined littoral currents in the study area
Table 3.2 Measurements of combined littoral currents (m/s)
Buoy name
WRU-B 12
WRU-B 13
WRU-B 14
WRU-B 15
WRU-B 16
3.3
3.3.1
Maximum
velocity Vmax
(m/s)
0.83
0.83
0.56
0.83
0.56
Minimum
velocity Vmin
(m/s)
0.00
0.08
0.14
0.08
0.11
Average velocity
VTB (m/s)
0.21
0.45
0.47
0.47
0.44
Study on the variation of coastal bathymetry in Xuong Huan by means
of numerical model
Hydrodynamic regime in the study area
The simulation results in the south-west monsoon period are shown in Figure 3.12 and Figure
3.13. It can be seen that in this period the combined littoral currents on both sides of Cai
estuary are northward. The currents from Cai river have minor impacts on the coastal zone of
Xuong Huan. During the north-east monsoon period, the simulation results shows that the
littoral currents on both sides of Cai river are southward as can be seen in Figure 3.14 and
17
Figure 3.15. The currents from Cai River have a major impacts on the combined littoral
currents in Xuong Huan as shown in Figure 3.14 (d).
(a)
(b)
(d)
(c)
Figure 3.12 Effects of currents from Cai River on the study area in
south-west monsoon season.
23/5/2013 đến 02/6/2013
23/5/2013 đến 02/6/2013
Vận tốc (m/s)
Vận tốc (m/s)
23/5/2013 đến 02/6/2013
Vận tốc (m/s)
23/5/2013 đến 02/6/2013
Vận tốc (m/s)
23/5/2013 đến 02/6/2013
Vận tốc (m/s)
Figure 3.13 Current rose in the study area in south-west monsoon season
(a)
(b)
(d)
(c)
Figure 3.14 Effects of currents from Cai River on the study area in
north-east monsoon season.
18
3/12/2013 - 13/12/2013
Vận tốc (m/s)
3/12/2013 - 13/12/2013
Vận tốc (m/s)
3/12/2013 - 13/12/2013
Vận tốc (m/s)
3/12/2013 - 13/12/2013
Vận tốc (m/s)
3/12/2013 - 13/12/2013
Vận tốc (m/s)
Figure 3.15 Current rose in the study area in north-east monsoon season
3.3.2
Combined residual littoral currents in the study area
In order to study the flow regime in the coastal area, a cross section of 700m wide was
set up for investigation in the study area. The simulation results shows that the dominant
current direction is northwards during the southwest monsoon from April to September
and southwards during the northeast monsoon from October to March in the next year.
750
Legend
Lưu
lượng qua MCN/giờ
Cat Ngang
LưuMat
lượng
TB ngày
Trung Binh Ngay
3
dư 3(m
chảy (m
dòngchay
Lưu
/s) /s)
Luu lượng
luong dong
625
500
375
250
125
0
-125
-250
-375
Tháng
-500
Jan-13
Feb-13
1/2013 2/2013
Mar-13
3/2013
Apr-13
4/2013
May-13
5/2013
Jun-13
Jul-13
6/2013 7/2013
Date
Aug-13
8/2013
Sep-13
Oct-13
Nov-13
Dec-13
9/2013 10/2013 11/2013 12/2013
Figure 3.17 Residual flow through the cross section in 2013
3.3.3
Results of study on the impacts of waves and combined littoral
currents on the beach in the study area
3.3.3.1
Simulation results of top view bed shear stresses distribution
19
The simulation results shows that the total bed shear stress during the north-east
monsoon season is much greater than those during south-west monsoon season; and
the largest distribution is found in Cai estuary and decreases southwards.
Figure 3.18 Total bed shear stress
distribution during north-east
monsoon season
3.3.3.2
Figure 3.19 Total bed shear stress
distribution during south-west
monsoon season
Simulation results of bed shear stresses distribution at characteristic points
The variations of total bed shear stresses, induced only by waves and only by
currents over time are extracted at 9 survey points (Figure 3.1).
Figure 3.1 Survey points for bed shear stresses
20
Table 3.1 Wave-induced and combined current-induced bed shear stresses (N/m2)
Bed shear stresses in NE
monsoon
Min.
Average
Max.
0.02606
2.59335
11.04081
0.00107
1.50541
7.04616
0.00041
0.58920
3.47106
0.18818
6.98954
24.69806
0.00037
1.24569
6.05634
0.00068
0.51585
3.08132
0.27523
8.19320
29.98253
0.00008
1.25419
6.07702
0.00085
0.46295
2.82096
Point
No.
Point 01
Point 02
Point 03
Point 04
Point 05
Point 06
Point 07
Point 08
Point 09
Bed shear stresses in SW
monsoon
Min.
Average
Max.
0.00018
0.84029
6.14089
0.00006
0.07451
0.62306
0.00014
0.05706
0.48170
0.00006
0.55704
4.03345
0.00006
0.04720
0.41821
0.00006
0.05644
0.43925
0.00008
0.62912
4.65869
0.00013
0.04910
0.41629
0.00002
0.06002
0.42575
5.7
3.8
1.9
0.0
0.33
0.22
0.11
0.00
0.45
0.30
0.15
0.00
3.6
2.4
1.2
0.0
0.219
0.146
0.073
0.000
0.42
0.28
0.14
0.00
4.5
3.0
1.5
0.0
0.222
0.148
0.074
0.000
0.42
0.28
0.14
0.00
2013-05-22
22/5/2013
Ứng
suấtdo
dodong
dòngchay
chảy
Ung suat
Ung suat
Ứng
suấtdo
dosong
sóng
Diem 01
01
Điểm
Diem 02
02
Điểm
Diem 03
03
Điểm
Diem 04
04
Điểm
Diem 05
05
Điểm
Diem 06
Điểm
06
Điểm
Diem 07
Diem 08
Điểm
08
Điểm
Diem 09
2013-05-26
2013-05-30
26/5/2013
30/5/2013
Thoi gian
Thời
gian
2013-06-03
03/6/2013
Figure 3.30 Variations of bed shear
stresses during SW monsoon season
3.3.4
Ung suat
(N/m2)
đáy(N/m2)
suất day
Ứng
Ung suất
suat day
(N/m2)
đáy(N/m2)
Ứng
Ứng
suấtdo
dodong
dòng
chảy
Ung suat
chay
Ung suat
Ứng
suấtdodosong
sóng
8.7
5.8
2.9
0.0
6
4
2
0
2.52
1.68
0.84
0.00
22.2
14.8
7.4
0.0
5.1
3.4
1.7
0.0
2.19
1.46
0.73
0.00
25.2
16.8
8.4
0.0
4.6
2.3
0.0
1.8
0.9
0.0
Diem 01
01
Điểm
Diem 02
02
Điểm
Diem 03
03
Điểm
Diem 04
04
Điểm
Diem 05
05
Điểm
Diem 06
Điểm
06
Điểm
Diem 07
Diem 08
08
Điểm
Điểm
Diem 09
2013-12-02
02/12/2013
2013-12-06
2013-12-10
06/12/2013
10/12/2013
Thoigian
gian
Thời
2013-12-14
14/12/2013
Figure 3.31 Variations of bed shear
stresses during NE monsoon season
Simulation results of accretion-erosion situation in the study area
Simulation results of accretion-erosion situation of the coastal zone in the study area in
2013 are shown in Figure 3.32. The accretion process has the greatest intensity from
May until reaching the maximum amount of aggradation in August. Then an erosion
zone is found at the location of Y-shaped revetment near Hotel 378. It extends
southwards until the end of December.
21
Bồi xói (m)
-0.3 02/2013 0.5
Bồi xói (m)
-0.3 03/2013 0.5
Bồi xói (m)
-0.3 05/2013 0.5
Bồi xói (m)
-0.3 06/2013 0.5
Bồi xói (m)
-0.3 08/2013 0.5
Bồi xói (m)
-0.3 07/2013 0.5
Bồi xói (m)
-0.3 09/2013 0.5
Bồi xói (m)
-0.3 12/2013 0.5
Figure 3.32 Variations of the coastal bathymetry in the study area in 2013
3.4
Conclusion of Chapter 3
In this chapter, the following issues have been clarified: (i) quantitative description
and explanation of seasonal accretion-erosion mechanism in the study area, (ii)
clarification of the hydrodynamic regime and sediment transport mechanism in
the study area. (iii) clarification of the main cause and determination in detail of
the impacts of each factor: waves, combined littoral currents on the variation of the
bathymetry. (iv) in order to limit the variation of the coastal bathymetry and to
replenish the beach in the study area, structural measures must be introduced to
reduce the impact of east and north-east waves on the beach, to prevent the
southward longshore sediment transport in winter and retain the sediment from the
south during the summer.
22
CHAPTER 4 INVESTIGATION OF THE PROPOSALS OF COASTAL
STRUCTURAL SOLUTIONS IN ORDER TO STABILIZE THE XUONG
HUAN BEACH, NHA TRANG
4.1 Present situation of the study area and objectives of the replenishment
4.1.1
Present situation of the beach in the study area
The replenished beach is located at the southward side of Yersin revetment, from
Hotel 378 in north-south direction along Tran Phu street to Tran Phu – Yersin
junction. The beach has a frequently seasonal variation. In winter, the beach is eroded
severely and becomes narrower with a width of 10 meters with a slope of 2%. In
summer, the beach is restored with an approximate width of 40 meters with a gentler
slope of 2%. In addition, because the beach is too narrow and steep in winter, the
wave have significant impacts on the coastal edge and the promenades, endangering
the swimmers and causing instability for coastal structures.
4.1.2
Objectives of the replenishment
The objectives of the beach replenishment are to limit the erosion, restore and increase the
width, lower the steepness of the beach in the study area. It must ensure the aesthetic
requirements, be environmentally friendly and have no adverse effects on the adjacent areas.
4.2
Scientific bases for the proposals
According to the results of experimental studies and numerical simulations in Chapter 3;
Vietnamese Standard TCVN 9901: 2014 Irrigation works - Requirements of sea dike
design and Chapter 7 of the Project - Preliminary design of structures to renovate and
upgrade the beach at the location of Khanh Hoa Provincial People's Committee.
4.3
Proposals of master plans for sand-retaining and wave-attenuating structures
The proposal is to build a breakwater for the attenuation of north-east waves at the
start point of the beach. A system of offshore submerged breakwaters which are
parallel to the shoreline is introduced in order to attenuate the waves from the east,
transport the sediments induced by south-east waves onto the beach and form the
tombolos; together with the groynes, they can retain the sediment transport induced
by the littoral currents during the north-east monsoon period southwards.
4.4 Evaluation of technical efficiency of the layouts for structural measures
4.4.1
Evaluation methods
The technical efficiency of the layout plans for countermeasures is assessed by means
of simulations conducted by the calibrated and verified numerical model introduced in
23
Chapter 2 on the basis of effects on wave attenuation and aggradation.
4.4.2
Bathymetry changes corrensponding the layout plans for coastal structures
4.4.2.1
Simulation results of top view accretion-erosion
The results of image extraction for the study of accretion-erosion in the study area after
12 months (Figure 4.10) shows the 5th altenative has the best efficiency in aggradation as
a result of the southward groyne located at the end point of the system in addition to the
northward groyne and offshore submerge breakwaters, which hinders the combined
littoral currents and retains the sediments in the study area.
Figure 4.1. The accretion-erosion situation in the study area after 12 months
corrensponding to various layout alternatives
4.4.2.2
Comparison of the simulation results of accretion-erosion corresponding
to different cross-sections of the alternatives
The cross sections were selected in order to extract the results of bathymetry
variation in 2013 to find out the impacts of different structural measures on the
accretion-erosion processes in the study area. The simulation results show that
alternative no. 5 has the best efficiency.
4.5
Conclusion of Chapter 4
In this chapter, the structural solutions has proposed for the purpose of stabilizing
and replenishing the beach in the study area. It includes the evaluation of the
effectiveness of the proposed alternatives and the identificaton of the most efficient
one. The selected structural solution is a combination of submerged and semi24
submerged sand-retaining and wave-attenuating structures, and as a result it has no
significant impacts on the landscape of the beach.
CONCLUSIONS AND RECOMMENDATIONS
I.
The obtained results
From the results of overview study, litterature review, field observations and
numerical modelling, the dissertation has achieved the following outcomes.
1. Overview of the study on mechanism of coastal zone evolution and the
structural solution for beach stabilization
Detailed research on typical results as well as the universal methods and procedures
for the studies on the mechanism of coastal zone evolution. The common numerical
models have been applied in order to simulate the flow and the propagation and
transformation of waves. Longshore sediment transport and structural solutions for
coastline stabilization, beach replenishment have also been studied as well. Thereby,
the problem was identified and selected; in addition suitable approaches and
methodology for the study were determined as well.
2. Clarifying the scientific bases for the study of the mechanism of coastal
zone evolution by means of field observations and numerical models
i) Synchronous adoption of many modern, advanced and specialized devices and monitoring
methods. The drifting buoy technology has been applied successfully in Vietnam for the first
time in order to study the combined littoral currents, which opens up the opportunity for the
affordable adoption in large study areas in the conditions of Vietnam.
ii) Selecting and applying the open source hydrodynamic model EFDC successfully
coupled with the wave propagation model SWAN and the Lagrangian particle model
for the simulation of combined flows into an integrated tool, which can be applied to
study the hydrodynamic regime, the longshore sediment transport mechanisms and the
bathymetry change in the study area.
3. Quantification of coastal zone evolution in the study area under the impacts
of waves and combined littoral currents.
Qualitative description and interpretation of the seasonal accretion-erosion mechanism
of the beach were given, in addition to the clarification of the hydrodynamic regime
25