Nghiên cứu xác định hệ phosphoprotein và hệ protein tiết của tế bào lympho t người bằng các kỹ thuật proteomic
Bạn đang xem bản rút gọn của tài liệu. Xem và tải ngay bản đầy đủ của tài liệu tại đây (3.5 MB, 158 trang )
VIETNAM ACADEMY OF SCIENCE AND TECHNOLOGY
INSTITUTE OF BIOTECHNOLOGY
NGUYỄN TIẾN DŨNG
CHARACTERIZATION OF THE HUMAN TLYMPHOCYTE PHOSPHOPROTEOME AND
SECRETOME USING PROTEOMIC
TECHNIQUES
PhD THESIS IN BIOLOGY
Hanoi, 2016
VIETNAM ACADEMY OF SCIENCE AND TECHNOLOGY
INSTITUTE OF BIOTECHNOLOGY
Nguyễn Tiến Dũng
CHARACTERIZATION OF THE HUMAN TLYMPHOCYTE PHOSPHOPROTEOME AND
SECRETOME USING PROTEOMIC TECHNIQUES
Speciality: Biochemistry
Code:
62 42 01 16
PhD THESIS IN BIOLOGY
SUPERVISORS:
1. Dr. Joaquin Abián Moñux
Institute of Biomedical Research of Barcelona, Spain
2. Prof. Dr Phan Văn Chi
Institute of Biotechnology, Vietnam
Hanoi, 2016
Declaration of Authorship
I, Nguyen Tien Dung hereby declare that this thesis is from my own. The
results presented in the thesis are from my own works and the works shared with my
colleagues under their permission. Where I have consulted the work of others, this is
always clearly stated.
Title of the PhD thesis
“Characterization of the human T-lymphocyte phosphoproteome and secretome
using proteomic techniques”
Hanoi, 21/09/2016
Nguyễn Tiến Dũng
i
Acknowledgements
I would like to express my special appreciation and thanks Dr. Joaquin Abian
Moñux and Prof. Dr Phan Van Chi for your supervisions and supports in my PhD
program. I would like to thank you for encouraging my research and for allowing me
to grow as a research scientist. Your advice on my research, my career, and my daily
life are priceless.
I would especially like to thank Dr Montserrat Carrascal not only for your
training, your support in experimental works but also for your advices, sympathy and
help in my daily life in Barcelona.
I would also like to thank my current and former colleagues (Vanessa Casas,
Roberto Pinto, Edita Bueno, Marina Gay, Oriol Vidal, Joan Villanueva, Oscar
Gallardo, Mari Carmen Torres) at CSIC/UAB Proteomics Laboratory, Barcelona,
Spain for all your assistance in training techniques, adapting to the new working
environment and the new life in Barcelona.
I would also like to appreciate my colleagues at Protein Biochemistry
Laboratory, Hanoi, Vietnam for your help in applying the CSIC-VAST PhD program
and in writing my PhD thesis.
I would also like to thank Mrs. Bui Thi Hai Ha, Institute of Biotechnology for
your help in preparing for the thesis defence.
A special thanks to my family. Words cannot express how grateful I am to all of
you for all of the sacrifices that you have made on my behalf.
This work was supported by Spanish National Research Council and Vietnam
Academy of Science and Technology under the bilateral project “Characterization of
the human primary T-lymphocyte phosphoproteome and secretome using proteomic
techniques” - 2012VN0003.
Hanoi, 21/09/2016
Nguyễn Tiến Dũng
ii
CONTENTS
Declaration of Authorship ................................................................................................i
Acknowledgements ........................................................................................................ ii
CONTENTS .................................................................................................................. iii
LIST OF TABLES........................................................................................................ vii
LIST OF FIGURES ..................................................................................................... viii
ABBREVIATIONS .........................................................................................................x
INTRODUCTION ...........................................................................................................1
Chapter 1. BACKGROUND ...........................................................................................4
1.1. Protein phosphorylation............................................................................................4
1.1.1. Functions and roles of protein phosphorylation .................................................... 4
1.1.2. Protein phosphorylation detection ....................................................................... 5
1.1.2.1. Traditional biochemical detection methods ....................................................... 5
1.1.2.2. Mass spectrometry-based detection method ...................................................... 7
1.2. Phosphoproteomics ...............................................................................................8
1.2.1. Phosphopeptide enrichment ................................................................................ 8
1.2.2. Mass spectrometry-based quantification ............................................................ 11
1.2.3. Bioinformatics and data analysis ....................................................................... 13
1.3. T cell signaling and phosphoproteomics .............................................................15
1.3.1. T cell signaling ................................................................................................ 15
1.3.1.1. Overview of T cell receptor signaling ............................................................. 15
1.3.1.2. Roles of phospholipase C-gamma1 in T cell receptor signaling........................ 16
1.3.2. Phosphoproteomic studies of T cells ................................................................. 17
1.3.2.1. Phosphoproteomic studies of primary T cells and LymPHOS .......................... 17
1.3.2.2. Analysis of T cell receptor signaling using human Jurkat T cells...................... 19
1.4. Secretome and phosphosecretome analysis ........................................................20
1.4.1. Secretome and protein secretory pathways ........................................................ 20
iii
1.4.2. Study on secretome .......................................................................................... 22
1.4.2.1. General strategy for large-scale secretome analysis ......................................... 22
1.4.2.2. Phosphorylation study of secretome ............................................................... 22
1.4.2.3. Secretome analysis of T cells ......................................................................... 24
1.5. Proteomic research in Vietnam ...........................................................................25
Chapter 2. MATERIALS AND METHODS.................................................................27
2.1. Samples and materials .........................................................................................27
2.2. Methods ...............................................................................................................29
2.2.1. Methods for phosphoproteome analysis of human primary T cells and update of the
LymPHOS database .................................................................................................. 29
2.2.1.1. Human primary T cell isolation and activation ................................................ 29
2.2.1.2. Protein extraction and digestion ..................................................................... 30
2.2.1.3 Peptide labeling with isobaric tags .................................................................. 32
2.2.1.4. Separation of peptides by Strong cation exchange chromatography .................. 32
2.2.1.5. Phosphopeptide enrichment ........................................................................... 33
2.2.1.6. LC-MSn analysis ........................................................................................... 33
2.2.1.7. Database search and quantitative analysis ....................................................... 34
2.2.1.8. Database and web application structure .......................................................... 35
2.2.1.9. Biological analysis ........................................................................................ 36
2.2.2. Methods for phosphoproteome analysis of human Jurkat T cells ......................... 36
2.2.2.1. Sample preparation ....................................................................................... 36
2.2.2.2. LC-MSn analysis ........................................................................................... 37
2.2.2.3. Database search and quantitative analysis ....................................................... 38
2.2.2.4. Biological analysis ........................................................................................ 38
2.2.2.5. Western blot analysis of LCK ........................................................................ 39
2.2.3. Methods for phosphosecretome analysis of human Jurkat T cells ........................ 39
2.2.3.1. Sample preparation ....................................................................................... 39
2.2.3.2. LC-MSn analysis ........................................................................................... 40
iv
2.2.3.3. Database search and quantitative analysis ....................................................... 41
2.2.3.4. Bioinformatics analysis of phosphosecretome ................................................. 41
Chapter 3. RESULTS ....................................................................................................42
3.1. Characterization of the human primary T cell phosphoproteome – an update of
the LymPHOS database .............................................................................................42
3.1.1. Characterization of the human Primary T cell phosphoproteome ........................ 43
3.1.1.1. Qualitative and quantitative analysis .............................................................. 43
3.1.1.2. Panther-based GO classification ..................................................................... 44
3.1.1.3. Chromosome-based classification .................................................................. 46
3.1.2. LymPHOS2.0 – update of the LymPHOS database ............................................ 47
3.1.2.1. LymPHOS: structure and general information ................................................ 47
3.1.2.2. LymPHOS: protein and peptide views ............................................................ 51
3.2. Phosphoproteome analysis of human Jurkat T cells ...........................................55
3.2.1. Global qualitative analysis ................................................................................ 57
3.2.2. Global quantitative analysis .............................................................................. 61
3.2.3. Biological analysis ........................................................................................... 63
3.2.4. Phosphorylation of LCK................................................................................... 66
3.3. Phosphosecretome analysis of human Jurkat T cells ..........................................70
3.3.1. Identification of proteins and phosphoproteins in the conditioned medium of Jurkat
T-cells ...................................................................................................................... 71
3.3.2. Biological process–based classification of potential secreted phosphoproteins..... 72
3.3.3. Quantitative analysis of secreted phosphoproteins ............................................. 73
Chapter 4. DISCUSSION ..............................................................................................74
4.1. Role of the LymPHOS database .........................................................................74
4.2. Qualitative analysis of human Jurkat cell phosphoproteomes: contribution to the
phosphosite database ..................................................................................................76
4.3. Quantitative analysis of human Jurkat T cell phosphoproteomes: possible roles
of PLCγ1 ....................................................................................................................78
4.4. Human Jurkat T cell phosphoproteome: biological analysis ..............................79
v
4.5. The role of new P-sites of LCK ..........................................................................82
4.6. Characterization of secreted phosphoproteins from human Jurkat T cells .........84
CONCLUSIONS AND PERSPECTIVES ....................................................................90
Conclusions ................................................................................................................90
Perspectives ................................................................................................................91
PUBLICATIONS RELATED TO THE PhD THESIS .................................................92
REFERENCES ..............................................................................................................93
TÓM TẮT LUẬN ÁN .................................................................................................118
vi
LIST OF TABLES
Table
Title
Page
Table 1.1
Phosphopeptide enrichment methods
9
Table 2.1
List of chemicals and enzymes
27
Table 2.2
List of instruments and apparatuses
28
Table 2.3
List of software and tools
28
Table 3.1
General qualitative and quantitative information of human
primary T cell phosphoproteome
44
Table 3.2
Quantitative data included in the LymPHOS database
50
Table 3.3
Collection of new P-sites detected from unique phosphopeptides
in Jurkat T cells
59
Table 3.4
P-sites of LCK detected in the JE6.1 and Jgamma1 cell clones
67
Table 3.5
Secreted phosphoproteins verified by both SignalP and GOA
71
Table 3.6
List of secreted protein containing regulated P-site
73
vii
LIST OF FIGURES
Figure
Title
Page
Figure 1.1
Overview of protein phosphorylation
3
Figure 1.2
Phosphorylation detection in large-scale phosphoproteomics studies
7
Figure 1.3
General phosphoproteomics workflow
8
Figure 1.4
Overview of MS-based quantitative proteomics approaches
12
Figure 1.5
Overview of TCR signaling pathways
16
Figure 1.6
Classical and nonclassical secretion of cardiokines
21
Figure 1.7
General secretome analysis workflow
23
Figure 3.1
The experimental workflow for the charaterization of human primary T
cell phosphoproteome and update of LymPHOS
43
Figure 3.2
Gene Ontology classification of the LymPHOS proteins compared to
the Human Proteome
45
Figure 3.3
Chromosome localization - based classification of human primary T
cell phosphoproteins
47
Figure 3.4
The website interface of the LymPHOS database (lymphos.org)
48
Figure 3.5
Schema of the LymPHOS2.0 database
49
Figure 3.6
Comparison of the Fold-change (fc) values between LymPHOS tools
and DanteR
51
Figure 3.7
Protein view of LymPHOS database
52
Figure 3.8
Peptide view - quantitative summary of LymPHOS
53
Figure 3.9
The workflow for the phosphoproteome analysis of human Jurkat T cells
56
Figure 3.10
LC-MSn identification and quantification of DLLSDLQDIsDSER ER
57
Figure 3.11
Phosphopeptide and phosphoprotein sets identified in JE6.1 and
Jgamma1 clones
58
Figure 3.12
Regulated phosphopeptides detected across time course in the two Jurkat
cell clones
62
viii
Figure
Title
Page
Figure 3.13
KEGG–TCR signaling pathway of phosphoproteins detected in JE6.1
and Jgamma1
63
Figure 3.14
Phosphorylation motifs of the peptides identified and quantified in the
study
64
Figure 3.15
Overrepresented KEGG pathways of proteins containing regulated Psites in JE6.1 and Jgamma1
66
Figure 3.16
Phosphorylation changes at Ser-121 of LCK
68
Figure 3.17
The MS3 spectra for identification of the phosphopeptide
ANsLEPEPWFFK
69
Figure 3.18
Phosphosecretome analysis schema of human Jurkat T cells
70
Figure 3.19
Biological process classification of potential secreted phosphoproteins
72
Figure 3.20
The potential role of Ser-121 of LCK in the late response to Jurkat T
cell activation
84
ix
ABBREVIATIONS
2-DE
Two-dimensional electrophoresis
ACN
Acetonitrile
amu
Atomic mass unit
AOHUPO
Asia Oceania Human Proteome Organization
APS
Ammonium persulfate
CD
Classification determinant
CID
Collision-induced dissociation
Da
Dalton
DTT
Dithiothreitol
ESI
Electrospray ionization
FA
Formic acid
FDR
False Discovery Rate
HCD
Higher-energy collisional dissociation
HILIC
Hydrophilic interaction liquid chromatograph
HPLC
High performance liquid chromatography
HUPO
Human Proteome Organization
IAA
Iodoacetamide
IMAC
Immobilized metal affinity chromatography
iTRAQ
Isobaric tags for relative and absolute quantitation
kDa
Kilodalton
KEGG
Kyoto Encyclopedia of Genes and Genomes
kV
Kilovolt
LC
Liquid chromatography
LCK
Lymphocyte-specific protein tyrosine kinase
Multistage mass spectrometry
MSn
m/z
Mass to charge ratio
MALDI
Matrix-assisted laser desorption ionization
MOAC
Metal-oxide affinity chromatography
x
MS
Mass spectrometry
P-site
Phosphorylation site
PLCγ1
Phospholipase C gamma1
PSMs
Peptide-spectrum match
PTM
Post-translational modification
RP
Reversed phase
S (Ser)
Serine
SAX
Strong anion exchange chromatography
SCX
Strong cation exchange chromatography
SDS-PAGE
Sodium dodecyl sulphate-polyacrylamide gel electrophoresis
SILAC
Stable isotope labeling with amino acids in cell culture
SIMAC
Sequential Elution from IMAC
T (Thr)
Threonine
TCR
T cell receptor
TEMED
Tetramethylethylenediamine
TFA
Trifluoroacetic acid
TMT
Tandem mass tag
TOF
Time of flight
V
Volt
Y (Tyr)
Tyrosine
xi
1
INTRODUCTION
Phosphorylation is one of the most common and important reversible posttranslational modifications (PTMs) regulating protein functions. Phosphorylation and
dephosphorylation result in conformational changes in the structure of enzymes and
receptors, causing them to become activated or deactivated. Protein phosphorylation
thus plays a central role in cellular processes such as cell cycle, cell growth, apoptosis,
and signal transduction. These reversible modifications are modulated by a complex
network of kinases and phosphatases. An abnormal regulation of protein
phosphorylation may result in a number of dysfunctional cellular processes that lead to
various diseases.
Phosphoproteomics aims to identify the collection of cellular phosphoproteins
and describe its phosphorylation dynamics in different conditions. Global
phosphoproteome profiles could be used for the characterization of biological markers
of cellular status that can be useful as prognostic or diagnostic markers in clinical
practice. The characterization of phosphorylation motifs may allow the discovery of
new, physiologically relevant kinases as well as the understanding of the mechanisms
involved in the regulation of protein function. This information is the first step towards
the design of new therapies based on drugs controlling either kinase/phosphatase
activities or the activity of other proteins in key points of the affected pathways.
T lymphocytes (T cells) play a vital role in the adaptive immune response.
Physiological activation of T cells is the consequence of different signaling pathways
initiated by stimulation of the CD3-T cell receptor (TCR) complex and/or other
costimulatory receptors such as CD28. Phosphorylation/dephosphorylation of the
proteins involved is a major event/actor for the transmission of the TCR signal to the
cell nucleus. The CD3-TCR stimulation alone or in combination with other stimuli
initiates TCR-driven early signals, resulting in the formation of the linker for
activation of T cells (LAT) signalosome. The LAT signalosome is the intermediate
2
complex for transmitting TCR-dependent early signals to downstream responses such
as the expression and secretion of interleukin and the regulation of actin and
cytoskeleton. Phospholipase C gamma1 (PLCγ1) is an essential component of the LAT
signalosome, catalyzing the hydrolysis of the membrane lipid phosphatidylinositol 4,5bisphosphate (PIP2) into the second messengers inositol trisphosphate (IP3) and
diacylglycerol (DAG) which are vital for regulation of interleukin-2 (IL-2) gene
expression. Understanding the roles of PLCγ1 in the phosphorylation profile during T
cell activation, thus is important to reveal new mechanisms of how early signals are
transmitted to downstream responses.
Activated T cells mediate cellular and humoral defense against foreign bodies
or autoantigens mostly through their secreted proteins/peptides. The term secretome
refers to this set of proteins/peptides which are secreted from cells into the
extracellular environment. These molecules are known to be involved in various
biological processes, such as intercellular communication, cell adhesion, cell
migration, invasion and metastasis, and angiogenesis. Therefore, the study on the
secretome, especially the phosphosecretome of T cells is essential to extensively
understand T cell functions in cell-mediated immune response.
In this work, we carried out the project “Characterization of the human Tlymphocyte phosphoproteome and secretome using proteomic techniques” with
the following objectives:
1. Characterization of the human primary T cell phosphoproteome – an update of the
LymPHOS database.
2. Phosphoproteome characterization of human Jurkat T cell clones for better
understanding on the role of PLCγ1 in T cell signaling.
3. Characterization of the human Jurkat E6.1 T cell phosphosecretome.
3
New findings
1. This work is a contribution to studies on the human primary T cell
phosphoproteome and to the update of the LymPHOS database. All additional
data from new experiments have been updated to LymPHOS, the first and most
comprehensive database of the human primary T cell phosphoproteome.
2. For the first time, the human Jurkat gamma1 cell clone phosphoproteome has
been introduced. Over 200 new P-sites from both cell clones (the Jurkat E6.1
and Jurkat gamma1 clones) were detected when comparing to the
PhosphositePlus database. The quantitative phosphoproteomic analysis of both
cell clones revealed the important role of PLCγ1 on protein phosphorylation
and on signaling pathways of T cells.
3. Four novel high confidence P-sites of LCK were discovered in Jurkat T cells.
Among these, Ser-121 may related to the role of LCK in processes different to
those occuring at the early stages of TCR-activation through the plasma
membarne complex.
4. Our work presented the first collection of secreted phosphoproteins from human
Jurkat T (the Jurkat E6.1 clone) cells with 125 potential secreted
phosphoproteins were identified and verified. Among them, five proteins
contained regulated P-sites in response to Jurkat T cell activation with
PMA/ionomycin: PA2G4, ALDOA, THRAP3, DOCK2, and stathmin.
4
Chapter 1. BACKGROUND
1.1. Protein phosphorylation
1.1.1. Functions and roles of protein phosphorylation
Phosphorylation is among the most important and well-studied posttranslational modifications (PTMs) of proteins; about one-third of all human proteins
was estimated as phosphoproteins (Cohen, 2001). Protein phosphorylation is mostly
occurred at serine (Ser), threonine (Thr) and tyrosine (Tyr) residues even though there
are also evidences of phosphorylation at histidine, cysteine, and aspartic acid residues,
either as phosphoenzyme intermediates or as stable modifications (Krebs, 1994;
Cohen, 2002).
A
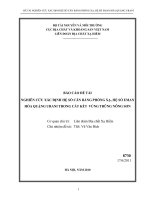
Figure 1.1.
Overview
of protein
B
phosphorylation. A,
mechanism
of protein
phosphorylation and dephosphorylation catalyzed by kinases and phosphatases. B, regulation
of protein function by phosphorylation ().
Phosphorylation of proteins at specific amino acid residues is a key regulatory
mechanism in cells. Phosphorylation and dephosphorylation result in conformational
changes in the structure of enzymes and receptors, causing them to become activated
or deactivated (Figure 1.1). Due to this mechanism, phosphorylation or
5
dephosphorylation of specific proteins by kinases and phosphatases controls cellular
processes, such as cell cycle regulation, cell growth, and cell differentiation (Hunter T,
2000; Schlessinger et al., 2000).
Many efforts have been made to understand biological roles of protein
phosphorylation in the context
of
human diseases such
as cancer and
neurodegenerative disorders (Cohen, 2001; Zheng et al., 2009; Via and Zanzoni,
2015). The fact that protein kinases became in the last decade the second most
important group of drug targets after G-protein-coupled receptors reflects the
importance of this knowledge (Cohen, 2002). The use of several tyrosine kinase
inhibitors (TKIs) which limit the activity of kinases responsible for phosphorylation
events could be a promising strategy for treating these diseases. In the case of cancer,
Dasatinib and Imatinib inhibit Src and other tyrosine kinases, showing better sideeffect profile than conventional cytotoxic chemotherapy (Zhang et al., 2009).
Furthermore, Lapatinib and Trastuzumab could be used together for treatment of HER2 positive breast cancer (Eckstein et al., 2014). In addition, several TKIs are being
tested for treating neurodegenerative disorders such as Nilotinib (for Parkinson’s
disease) and Saracatini (for Alzheimer’s disease) (Hebron and Moussa, 2015).
1.1.2. Protein phosphorylation detection
1.1.2.1. Traditional biochemical detection methods
Labeling proteins with radioisotopes such as 32P or 33P is a traditional method to
analyze protein phosphorylation although it is not now widely used. In this method,
proteins are labeled in vivo using
32
P orthophosphate (Ji H, 1993) or in vitro using
purified protein kinase and (γ-32P) ATP (Aebersold R, 1991). The labeled proteins can
be visualized from SDS-PAGE or 2-DE gels by autoradiography or phosphorimaging.
To identify the phosphorylation sites (P-sites), the labeled proteins are cleaved and the
phosphopeptides are separated by HPLC or 2D thin-layer chromatography. Isolated
phosphopeptides are sequenced by the Edman method, monitoring for a loss of
radioactivity at each cycle of the Edman degradation. The P-sites are detected by
6
comparing the Edman cycle number at which the radioactivity is released with a
list of the protein predicted peptides to identify those that contain serine,
threonine, or tyrosine at the same position in the peptide sequence (Sickmann and
Meyer, 2001; MacDonald et al., 2002).
Two-dimensional gel electrophoresis (2-DE) has been also used to detect
phosphoproteins (Peck et al., 2006). The replacement of the neutral hydroxyl groups
on serine, threonine or tyrosine by negatively charged phosphate groups during
phosphorylation
modifies
protein
charge,
thus
changing
the
mobility
of
phosphoproteins compared to that of nonphosphorylated ones during isoelectric
focusing. Phosphoproteins are detected by staining methods and could be quantified
using densitometry analysis software.
Beside 2-DE, phosphoproteins can be separated and detected using Phos-tag
SDS-PAGE. Phos-tag is a dinuclear metal complex molecule that binds specifically
phosphorylated ions at neutral pH. When using Phos-tag acrylamide for SDSPAGE, migration speed of phosphorylated proteins is decreased due to their binding
with the metal complex thus being separated from non-phosphorylated proteins
(Kinoshita et al., 2009). The phosphorylated proteins emerge as multiple migration
bands, depending on the phosphorylation status, the numbers and the positions of
attached phosphate groups. The Phos-tag-bound phosphoproteins can be visualized
from SDS-PAGE gels or used for downstream procedures such as immunoblotting
or MS analysis (Kinoshita et al., 2014).
Staining proteins with phospho-specific dyes is another method for
phosphoprotein detection (Green et al., 1973). Among the available dyes, ProQ
Diamond, which allows detection of phosphoproteins directly in acrylamide gels, has
been used widely (Steinberg et al., 2003; Taylor et al., 2013). Although the sensitivity
of ProQ Diamond (1- 16 ng) is less than that of radioactive methods, it is still being
used because of its advantages: specificity, convenience and safety, independence of
kinase activity, and compatibleness with the total protein stain, thus enabling the
7
measurement of not only protein expression but also protein phosphorylation levels
(Steinberg et al., 2003).
Phospho-specific antibodies have also been used for phosphorylation detection.
In this technique, the phospho-specific antibodies bind to the amino acid sequence
around the phosphorylated residues of proteins (the phosphorylation motif), allowing
the detection of phosphoproteins by immunological detection methods such as Western
blot (Mandell, 2003). However, successful detection is highly dependent on the specificity
and affinity of the antibody corresponding to the phosphoprotein of interest.
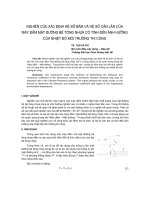
1.1.2.2. Mass spectrometry-based detection method
Mass spectrometry is a powerful analytical technique, enabling not only the
detection of phosphopeptides/phosphoproteins but also the specific location of their
phosphorylation sites. In large-scale phosphoproteomic studies, phosphoproteins are
often digested to produce tryptic peptides prior to MS analysis. Phosphorylation
detection is based on the presence of neutral losses of 80 or 98 Da (corresponding to a
loss of HPO3 and H3PO4) in the spectra of the phosphorylated peptides (Figure 1.2)
(Parker et al., 2010).
Although MS has been used extensively for phosphorylation studies with capacity
of detecting thousands of phosphorylation sites in a single run, it also has several
drawbacks. Firstly, MS faces difficulty in detecting low-abundance phosphopeptides in
tryptic peptide mixtures. Secondly, signals from phosphopeptides are generally weaker
compared to those from non-phosphorylated peptides. Because of these issues,
phosphopeptide enrichment and peptide fractionation are commonly required prior to MS
analysis (Thingholm et al., 2009; Engholm-Keller and Larsen, 2013).
8
Figure 1.2. Phosphorylation detection in large-scale phosphoproteomic studies. The
detection is based on neutral loss of 80 and 98 Da corresponding to a loss of HPO3 and
H3PO4. The figure was adapted from Parker et al., 2010.
1.2. Phosphoproteomics
The last decade developments in MS instrumentation have enabled large-scale
phosphorylation studies of different biological samples, such as whole cells, tissues or
biological fluids. Among the different steps involved in phosphoproteomic studies
(Figure 1.3), those related with phosphopeptide enrichment, MS acquisition, and data
analysis are the most critical (Kanshin et al., 2012; Engholm-Keller and Larsen, 2013).
These steps will be described in more detail in the following sections.
1.2.1. Phosphopeptide enrichment
Phosphorylated proteins are at low stoichiometry, making them difficult to
detect by MS. In the case of signal transduction, this issue is worse due to the
normally low copy number of many proteins belonging to intracellular signaling
cascades (Schwanhausser et al., 2011; Rigbolt and Blagoev, 2012). Thus,
enrichment of phosphopeptides before MS analysis is crucial. Different techniques
have been introduced for enrichment including chemical derivatization-based
9
enrichment, phosphoramidate chemistry (PAC), immobilized metal affinity
chromatography (IMAC), metal oxide affinity chromatography (MOAC), and
immunoprecipitation (Table 1.1).
Samples
Protein mixtures
Protein digestion
Sa mple prepa ra tion
Protein extraction
Phosphoproteomic a na lysis
Peptide
mixtures
Immnoprecipitation
(pTyr)
Phosphopeptide enrichment
(IMAC, MOAC…)
Prefractionation
(SAX, SCX…)
Prefractionation
(SAX, SCX…)
Phosphopeptide enrichment
(IMAC, MOAC…)
LC MS/MS
Data analysis
Figure 1.3. General phosphoproteomic workflow. Protein extracts are digested, and
proteolytic peptides can be processed by several strategies prior to LC-MS analysis. In the
first strategy that is often used for tyrosine phosphorylation study, phosphotyrosine peptides
are enriched by immunoaffinity precipitation and analyzed by LC-MS. In the second strategy,
phosphoserine and phosphothreonine peptides are enriched by IMAC or/and MOAC before
LC-MS analysis. A pre-fractionation (SCX, SAX…) step can be applied either before (right) or
after (center) phosphopeptide enrichment. MS data are analyzed using commercial or open-source
proteomic applications of in-house developed software (adapted from Kanshin et al., 2012).
10
Table 1.1. Phosphopeptide enrichment methods (Engholm-Keller and Larsen, 2013)
Method
Principle
Main properties
IMAC
Electrostatic interaction with
multivalent metal ion
Sensitive to salts and detergents
MOAC
Electrostatic interaction with
metal oxide
High specificity, highly robust
toward salt and detergents.
pTyr-
Selective enrichment of pTyr.
imunoprecipitatio Antibody immunoaffinity
n
Performed at both protein and
peptide levels.
Beta elimination
and Michael
addition
Chemical coupling of beta
eliminated peptides to tag or
solid support
PAC
Chemical coupling of
phosphoderivatives by
reversible covalent linkage to
solid support
Stringent washing steps may
yield higher specificity.
Complexity and may lead to
sample losses or loss of
phosphate
groups.
Not
compatible with pTyr.
Enrichment
of
all
phosphorylated amino acids.
Complexity and may lead to
sample losses.
These enrichment methods are different in specificity, efficiency and
manipulation. Each method has its own advantages and disadvantages and there is not
a single method providing full coverage of all the species in the phosphoproteome. For
instance, IMAC is highly compatible for enrichment of multiply phosphorylated
peptides while MOAC, such as TiO2 chromatography, shows better efficiency for
mono-phosphopeptide enrichment (Thingholm et al., 2009). Strategies such as
SIMAC, based on a sequential elution from IMAC columns and provide a higher
efficiency for phosphopeptide enrichment, have been developed to overcome these
issues (Thingholm et al., 2009).
11
1.2.2. Mass spectrometry-based quantification
Alongside phosphoprotein and P-site detection, phosphoproteomics deals with
the quantitation of phosphorylation changes related to cellular processes or in response
to stimuli. To date, different MS-based quantitative approaches have been applied
including label-free and chemical or metabolical labeling methods (Figure 1.4)
(Bantscheff et al., 2007). In label-free methods, quantitation is carried out based on
precursor signal intensity or on spectral counting. In labeling methods, molecular
labels are attached to proteins or peptides metabolically, enzymatically or using
isotopic and isobaric tags (Figure 1.4) (Engholm-Keller and Larsen, 2013).
In label-free approaches, samples are run separately and quantitative
information can be obtained based on spectral counting or peak intensity measurement.
Spectral counting involves comparing the number of identified spectra from the same
protein across different samples. In the method based on peak intensity measurement,
the ion intensities of the peptides belonging to a given protein are compared. For this
purpose, the ion chromatograms for every peptide are extracted from an LC-MS run,
and their peak areas are integrated over the chromatographic time scale. These values
can then be compared to the corresponding values in other samples for relative
quantification (Wasinger et al., 2013).
Among the labeling methods, the metabolic labeling with stable isotope amino
acids in cell culture (SILAC) and the isobaric labeling using iTRAQ (isobaric Tags for
Relative and Absolute Quantitation) or TMT (Tandem Mass Tag) reagents have been
used widely (Bantscheff et al., 2007; Kanshin et al., 2012). In a typical SILAC
experiment, two populations of cells are cultivated in two different media. The first
cell culture is done in normal medium while the other counterpart is cultured in media
supplemented with amino acids labeled with stable heavy isotopes (13C or 15N). Cells
from different conditions are combined for subsequent MS-based quantitative
proteomic analysis. In this case, pairs of chemically identical peptides but with
different stable-isotope composition are distinguished by mass spectrometer according
to their mass difference. The ratio of peak intensities in the mass spectrum for such
12
peptide pairs provides the abundance ratio of the corresponding proteins in the two
samples (Ong et al., 2002).
Figure
1.4.
Overview
of
MS-based
quantitative
proteomic
approaches
()
In isobaric tag labeling methods, peptides/proteins from different samples are
chemically labeled with different isobaric tags and pooled prior to LC-MS analysis.