Spatial risk assessment method workable under limited atmospheric data availability and its application to ninh thuan nuclear power plant zone planning
Bạn đang xem bản rút gọn của tài liệu. Xem và tải ngay bản đầy đủ của tài liệu tại đây (3.89 MB, 126 trang )
SPATIAL RISK ASSESSMENT METHOD
WORKABLE UNDER LIMITED
ATMOSPHERIC DATA AVAILABILITY
AND ITS APPLICATION TO NINH THUAN
NUCLEAR POWER PLANT ZONE PLANNING
by
HO QUOC DUNG
Supervisor
Professor YOSHIKI MIKAMI
A dissertation submitted in partial fulfilment
of the requirement for the degree of
Doctor of Engineering
in
Information Science and Control Engineering
March 2015, Japan
ABSTRACT
Vietnamese government has a nuclear energy program with the goal of building 14
units of nuclear reactor by 2030. Ninh Thuan has been the location approved by the
government for the construction of the first nuclear power plants (NPP). Estimating
the risk of radionuclide releases in the atmosphere is currently the most essential task
for Vietnamese authorities in order to regulate the area-zones around the NPP
facilities and to propose the policies to protect public health and safety. There is,
however, no existing documented work on such critical assessment and this study is
an attempt to fill this gap. In the first stage, the study has proposed the Simplified
Wind Transport Model that overcomes the restriction of meteorological data
availability as important input requirements for the other current atmospherics
dispersion models. This model aims to estimate the transport paths of the radioactive
materials in the atmosphere based on the widely available data of the wind speed and
wind direction. More than forty thousand simulations for the entire weather
conditions in Ninh Thuan during 14 year period (1996-2009) were carried out and
combined to build up the spatial risk maps around the Ninh Thuan NPP site. In the
second stage of the study, a practical methodology based on conventional and
historical data approach to assess the offsite dose of radioactivity releases in airborne
that enter the human body through inhalation exposure pathway was developed.
Based on the offsite dose estimations, the research seeks to recommend to the
government authorities the plan for arranging the critical zones around the NPP and
the evacuation policy to minimize the risk of the radionuclide release to the public and
to the surrounding environment.
ACKNOWLEDGEMENTS
This PhD thesis is the summary of research activities in Doctoral course at Professor
Mikami’s laboratory, Nagaoka University of Technology, Japan.
I would never have been able to finish my dissertation without the guidance of my
Professor, help from friends, and support from my family.
First and foremost, I would like to express my deepest gratitude to my supervisor,
Professor Yoshiki Mikami, for the insightful guidance and tremendous support of my
study and research, for his patience, encouragement, enthusiasm, and immense
knowledge. It is my honour to be a student under his supervision.
I would like to thank Professor Yuichi Otsuka and Professor Tatsuya Suzuki for their
helpful advice and comments during my research work. I would like to sincerely thank
Professor Li Zhidong, Professor Koichi Yamada for their valuable comments and
discussions to improve my research and modify this thesis.
I would like to thank all members in Mikami laboratory for their kind help and support,
for creating good research environment and friendships. I also thank Nagaoka
University of Technology because of the good support for all international students.
I would like to give many thanks to my family members. There is no word to
acknowledge the encouragement and love of my family members. I could not have
finished the long journey of my study without their love and encouragement.
Finally, I would like to thank my beloved wife, Le Thi Quynh Lien and my lovely son,
Ho Le Minh Nhat. They are always behind me through the good and bad times.
Sincerely,
HO Quoc Dung
March 2015
TABLE OF CONTENT
CHAPTER 1. INTRODUCTION .............................................................................................................. 1
1.1 RESEARCH MOTIVATION ....................................................................................................................... 1
1.2 RESEARCH OBJECTIVES ......................................................................................................................... 6
1.3 OUTLINE OF THE RESEARCH ................................................................................................................. 7
CHAPTER 2. TECHNICAL BACKGROUND ..................................................................................... 11
2.1 RADIONUCLIDE SOURCE TERM .......................................................................................................... 11
2.1.1 Fission Product Characteristics ...................................................................................... 12
2.1.2 Radionuclide Source Terms ............................................................................................. 13
2.2 ATMOSPHERIC TRANSPORT OF RADIONUCLIDES ............................................................................. 17
2.2.1 The Characteristics of Atmospheric Releases ........................................................... 17
2.2.2 Modelling of Atmospheric Transport ........................................................................... 29
2.3 OFFSITE DOSE ASSESSMENT THROUGH DIFFERENT EXPOSURE PATHWAYS ................................ 34
2.3.1 Exposure pathways ............................................................................................................. 34
2.3.2 Inhalation pathway ............................................................................................................. 35
2.3.3 Ingestion pathway ............................................................................................................... 36
2.3.4 External exposure pathway ............................................................................................. 37
CHAPTER 3. RESEARCH SITE CHARACTERISTICS................................................................... 39
3.1 OVERVIEW OF VIETNAM NUCLEAR POWER PLANT PROGRAM ...................................................... 39
3.2 DEMOGRAPHIC AND GEOGRAPHY CHARACTERISTICS OF NINH THUAN ........................................ 44
CHAPTER 4. METEOROLOGICAL DATABASE............................................................................. 49
4.1 METEOROLOGICAL DATABASE COLLECTION .................................................................................... 49
4.2 METEOROLOGICAL DATABASE ANALYSIS ......................................................................................... 52
CHAPTER 5. SIMPLIFIED WIND TRANSPORT MODEL ........................................................... 55
5.1 MODELLING RADIONUCLIDE TRANSPORT......................................................................................... 55
5.1.1 Transport Estimation .......................................................................................................... 55
5.1.2 Dispersion Estimates........................................................................................................... 59
5.2 APPLICATION FOR NINH THUAN NPP SITES .................................................................................... 62
5.2.1 SWTM Simulation ................................................................................................................. 62
5.3 DISCUSSIONS ........................................................................................................................................ 69
5.4 CONCLUSIONS ....................................................................................................................................... 70
CHAPTER 6. REVISED SIMPLIFIED WIND TRANSPORT MODEL ........................................ 73
6.1 SOLAR ALTITUDE ANGLE .................................................................................................................... 73
6.2 ESTIMATING ATMOSPHERIC STABILITY CLASS BY TURNER METHOD ........................................... 77
CHAPTER 7. OFFSITE DOSE ASSESSMENT AND ZONE PLANNING ................................... 81
7.1 HYPOTHETICAL ACCIDENT SCENARIO ............................................................................................... 83
7.1.1 Source Term............................................................................................................................ 83
7.1.2 Released Radionuclide Concentration ......................................................................... 85
7.1.3 Offsite Dose Assessment .................................................................................................... 88
7.2 OFFSITE ZONE PLANNING................................................................................................................... 89
7.2.1 Criteria for Area Zoning Plan ........................................................................................... 91
7.2.2 Zone Planning by Conventional Approach ................................................................. 92
7.2.3 Zone Planning by Historical Data Approach .............................................................. 93
7.3 CONCLUSION...................................................................................................................................... 100
CHAPTER 8. DISCUSSION AND CONCLUSION ......................................................................... 103
8.1 APPLICATIONS AND LIMITATIONS OF RESEARCH RESULTS .......................................................... 103
8.2 CONCLUSION AND FUTURE PLAN .................................................................................................... 105
REFERENCES .......................................................................................................................................... 107
LIST OF ACHIEVEMENTS ..................................................................................................................... 113
LIST OF TABLES
TABLE 1.1: THE METEOROLOGICAL INPUT DATA REQUIREMENT FOR GPM AND PTM ............................. 3
TABLE 1.2: THE COMPARISON OF WEATHER INDICATOR RECORD BETWEEN SURFACE AND UPPER-AIR
STATION IN VIETNAM AND JAPAN........................................................................................................... 5
TABLE 2.1: RADIONUCLIDE CLASSIFICATION SCHEME USED IN THE REACTOR SAFETY STUDY ............. 12
TABLE 2.2: ABWR SOURCE TERMS – RADIONUCLIDE ACTIVITY RELEASE
TO THE
ENVIRONMENT
DURING A LOCA.................................................................................................................................... 15
TABLE 2.3: APWR SOURCE TERMS – RADIONUCLIDE ACTIVITY RELEASE
TO THE
ENVIRONMENT
DURING A LOCA.................................................................................................................................... 17
TABLE 2.4: VALUES OF THE POWER LAW VARIABLE M AS A FUNCTION OF SURFACE ROUGHNESS AND
ATMOSPHERIC STABILITY ..................................................................................................................... 20
TABLE 2.5: DEFINITION OF PASQUILL ATMOSPHERIC STABILITY CATEGORIES ...................................... 24
TABLE 2.6: INTERPRETATION OF FOUR DIFFERENT ATMOSPHERIC STABILITY SCHEMES ....................... 25
TABLE 2.7: STABILITY CLASS AS A FUNCTION OF NRI AND WIND SPEED................................................ 26
TABLE 2.8: HEIGHT OF MIXING HEIGHT FOR DIFFERENT ATMOSPHERIC STABILITY CATEGORIES .......... 28
TABLE 3.1: PLAN CONSTRUCTION NINH THUAN 1 AND 2 NUCLEAR POWER PLANT ............................... 43
TABLE 5.1: COMPARISON OF PUFF AND PLUME DIFFUSION ........................................................................ 61
TABLE 5.2: THE TOTAL COLORED AREA AT DIFFERENT SEASON................................................................ 66
TABLE 6.1: DEFINITION OF PASQUILL ATMOSPHERIC STABILITY CATEGORIES ...................................... 78
TABLE 6.2: INSOLATION AS A FUNCTION OF SOLAR ALTITUDE................................................................... 78
TABLE 6.3: STABILITY CLASS AS A FUNCTION OF NRI AND WIND SPEED................................................ 79
TABLE 7.1: RADIONUCLIDE CLASSIFICATION SCHEME................................................................................. 83
TABLE 7.2: INVENTORY OF IODINE ISOTOPES .............................................................................................. 84
TABLE 7.3: AMOUNT OF IODINE RELEASE TO THE ENVIRONMENT ........................................................... 85
TABLE 7.4: VALUES FOR STANDARD DEVIATION ΣY, ΣZ ............................................................................... 86
TABLE 7.5: ADULT INHALATION THYROID DOSE CONVERSION FACTORS ............................................... 89
TABLE 7.6: DEFINITION OF PASQUILL ATMOSPHERIC STABILITY CATEGORIES ....................................... 95
TABLE 7.7: WEATHER CASE AND ITS OWN PROBABILITY AT 16 DIRECTIONS........................................... 96
TABLE 7.8: STATISTICS OF THE SIMULATION FOR 16 DIRECTIONS ............................................................ 99
LIST OF FIGURES
FIGURE 1.1: THE RELATION AMONG THE MAIN COMPONENTS OF THESIS .................................................... 9
FIGURE 2.1: THE
HOURLY WIND VECTOR AS A FUNCTION OF TIME ON
THREE-MILE ISLAND
SITE.
ARROWS
MARCH 28, 1979,
AT THE
INDICATE DIRECTION TOWARD WHICH THE ONSITE WIND
WAS BLOWING AT THE LOCAL TIME INDICATED. CIRCLES REPRESENT VARYING WIND SPEEDS..... 18
FIGURE 2.2: DIFFERENT WIND PATTERNS AT THE SAVANNAH RIVER SITE, SOUTH CAROLINA ............. 19
FIGURE 2.3: THE EFFECT OF ATMOSPHERIC STABILITY ON PLUMES .......................................................... 22
FIGURE 2.4: THE GAUSSIAN PLUME MODEL SHAPE FOR CONTINUOUS POINT SOURCE ............................ 32
FIGURE 2.5: SIMULATION OF A PLUME COMPOSED OF A SERIES OF PUFFS ................................................ 33
FIGURE 2.6: THE PRINCIPAL EXPOSURE PATHWAYS ................................................................................... 35
FIGURE 3.1: THE NUCLEAR POWER PLANT CANDIDATE SITES ................................................................... 41
FIGURE 3.2: NINH THUAN NUCLEAR POWER PLANT SITES......................................................................... 42
FIGURE 3.3: VIETNAM POPULATION DENSITY IN 2010 ............................................................................. 44
FIGURE 3.4: NINH THUAN’S TOPOGRAPHY .................................................................................................. 45
FIGURE 3.5: POPULATION AROUND NUCLEAR POWER PLANT SITES ....................................................... 46
FIGURE 3.6: THE COMPARISON OF TEMPERATURE BETWEEN NINH THUAN AND OTHER CITIES ........... 47
FIGURE 3.7. THE COMPARISON OF PRECIPITATION BETWEEN NINH THUAN AND OTHER CITIES ........... 47
FIGURE 4.1: THE LOCATION OF NINH THUAN SURFACE STATION ............................................................. 49
FIGURE 4.2: METEOROLOGICAL DATABASE CREATION PROCESS ............................................................... 51
FIGURE 4.3: WIND ROSE ............................................................................................................................... 52
FIGURE 4.4: WEEKLY WIND DIRECTION PATTERNS ..................................................................................... 54
FIGURE 5.1. COORDINATE SYSTEM OF THE SURFACE LAYER ....................................................................... 57
FIGURE 5.2. THE RELEASED PATH OF RADIONUCLIDE AFTER 𝛥𝑡1 + 𝛥𝑡2 + … + 𝛥𝑡𝑛 TIME OF PERIOD
................................................................................................................................................................. 58
FIGURE 5.3. THE SHAPE OF THE CENTERLINE OF THE RADIONUCLIDE PLUME .......................................... 59
FIGURE 5.4. WIND TRANSPORT PATHS AFTER 24 HOURS OF TRANSPORT ................................................ 63
FIGURE 5.5. THE SPATIAL MAPS FOR DIFFERENT SEASON PERIODS ........................................................... 65
FIGURE 5.6: THE CONCENTRATION OF RADIONUCLIDE AT THE GROUND................................................... 67
FIGURE 5.7. THE BOUNDARY OF RADIONUCLIDE TRANSPORT DISTRIBUTION ........................................... 69
FIGURE 6.1: (A) GEOMETRY FOR
ZENITH ANGLE CALCULATION ON A SPHERE. (B)
GEOMETRY
FOR A
DIFFERENT SOLAR ZENITH ANGLE ........................................................................................................ 75
FIGURE 6.2: SOLAR
DECLINATION ANGLES DURING SOLSTICES AND EQUINOXES.
OF
THE FOUR TIMES
SHOWN, THE EARTH-SUN DISTANCE IS GREATEST AT THE SUMMER SOLSTICE................................ 76
FIGURE 7.1: RESEARCH SCHEME ................................................................................................................... 82
FIGURE 7.2: DIFFUSION FACTOR FOR SEVERAL STABILITY CATEGORIES AND WIND SPEED AT EFFECTIVE
HEIGHT H = 30 M ................................................................................................................................. 87
FIGURE 7.3. ZONE PLANNING ........................................................................................................................ 90
FIGURE 7.4. EXCLUSION ZONE AND LOW POPULATION ZONE ESTIMATED BY DETERMINISTIC APPROACH
................................................................................................................................................................. 93
FIGURE 7.5. THE DISTRIBUTED PROBABILITY OF ZONE DISTANCE IN WEST DIRECTION .......................... 98
FIGURE 7.6: THE
COMPARATIVE LOW POPULATION ZONE IN CONVENTIONAL
(SOLID
LINE) AND
HISTORICAL DATA APPROACH (DOTTED LINE)................................................................................. 100
Chapter 1.
INTRODUCTION
1.1 Research Motivation
The principal risks associated with nuclear power arise from human health effects of
radiation. Nuclear power plants (NPP) generate large quantities of highly radioactive
material [1]. These materials can come into contact with people principally through
small releases during routine plant operation, NPP accidents, accidents in transporting
radioactive materials, and escape of radioactive wastes from confinement systems,
and accidents caused by natural disasters [1][2]. Thus, a major concern of people who
live and work around nuclear facilities is the risk of spread of radioactivity to
environment, especially in the case of NPP accidents.
Radionuclide releases to the environment through two main paths: atmosphere
and underground. Among them, accidental releases to the underground environment
make a comparatively small contribution to the overall risk from NPP [3]. However,
the assessment of releases to the atmosphere has been the principal concern.
Atmospheric dispersion modelling is the mathematical simulation that is usually used
to predict how air pollutants disperse in the ambient atmosphere. It is performed with
computer programs to simulate the transport and dispersion processes of
radionuclide. Based on that, the estimation of the consequences due to NPP accident,
taking into account the range of environmental conditions at the time of the accident
and the probability associated with these conditions, can be provided [4]. Currently,
Gaussian Plume Model (GPM) and Puff Trajectory Model (PTM) are perhaps the most
commonly used atmospheric dispersion model types [5].
1
Radionuclide released to the atmosphere as a fine aerosol or gas will create a
plume that is carried downwind [6]. During this transport process, it expands
horizontally and vertically owing to diffusion and turbulent eddies in the atmosphere
[5][7][8]. It is controlled by the prevailing meteorological conditions like wind profile,
temperature profile and stability of the atmosphere [5][7][8]. Atmospheric dispersion
models attempt to express the interrelationships of these factors in terms of
mathematical equations [7]. They must capture the essential physics of the dispersion
process
and
provide
reasonable
and
repeatable
estimates
of
downwind
concentrations [9]. This generally requires detailed knowledge of source
characteristics, such as meteorological conditions, but it is also desirable to keep these
input requirements to a minimum [10] [11].
Being the oldest model among others, GPM assumes the concentration of
radionuclide materials released into the atmosphere described by the Gaussian
distribution [10]. It means that the pollutant distribution has a normal probability
distribution in all three directions (along-wind direction, crosswind direction and
vertical direction) [12]. The Gaussian-plume formulae are derived assuming ‘steadystate’ weather conditions. In other words, meteorological conditions are assumed to
remain constant during the dispersion from source to receptor [13]. The downwind
transport goes along a straight line; the wind speed and the eddy diffusion are
invariant during modeling process.
PTM, however, is a dynamic pollutant tracer model developed to simulate the
behavior of radionuclide released into the atmosphere under the unsteady-state
meteorological condition [14]. The model is based on the three-dimensional Puff
formulation of pollutant dispersion. PTM predicts plume’s trajectory and calculates
the dispersion along that trajectory [14]. In PTM, radionuclide releases can be
represented by a series of puffs of radionuclide materials, which are also transported
by the winds [14]. Each puff initializes a collection of discrete radionuclide particles
representing a sample of the eruption plume and calculates transport, turbulent
dispersion and fallout for each particle [14].
The main limitation of GPM is relatively low in the realistic reflective
characteristic of the simulation results [13]. GPM is derived based on the assumption
2
on steady state of meteorological condition, yet in reality, the wind speed, wind
direction, temperature and atmospheric stability are not constant [13]. The results by
GPM then may not accurately reflect reality. The GPM only can provide a better
representation of reality if conditions do not change rapidly within the hour being
modelled (i.e. conditions are reasonably steady and do not deviate significantly from
the average values for the hour being modelled) [13]. Moreover, the Gaussian curves
of radionuclide concentration are actually determined for distances out to about 1 km,
yet in fact, these curves are commonly extrapolated to 100 km [15]. Therefore, GPM
are most applicable to short-range modelling distances [15]. Despite their theoretical
limitations, the simple Gaussian models for atmospheric dispersion are still widely
used, primarily because they produce results that often agree fairly well with
measured experimental data.
Table 1.1: The meteorological input data requirement for GPM and PTM
Gaussian Plume
Model
Puff-Trajectory
Model
Wind (Speed, Direction)
o
o
Atmospheric Stability
o
o
Wind speed
o
o
Cloud Cover Rate
o
o
Solar Radiation
o
o
Vertical Temperature
o
Vertical Wind (Speed, Direction)
o
PTM models, with progressively increasing levels of mathematical sophistication,
aim to produce results that are more realistic [11]. PTM can avoid most of the
limitations associated with GPM models. PTM can be applied for complex
meteorological condition and be used for long-range modelling distances [11].
However, the complexity of the model makes it require much greater meteorological
input data requirements than GPM (Table 1.1) and it is the main disadvantage of PTM.
This disadvantage gets emphasized when complex terrain conditions are present.
Moreover, as the number of input variables goes up in the PTM models, the room for
3
input data error increases as well [11]. Another disadvantage of PTM is that it is very
sensitive to errors in selecting values for the wind field, which drives the entire
trajectory analysis [11].
Simply put, different atmospheric dispersion models do involve different
meteorological input data demands which may include varying meteorology to
simulate how radionuclides disperse in the ambient atmosphere. The concentrations
of radioactive contaminants are primarily controlled by the meteorological elements
including wind, temperature, precipitation amounts, mixing height and stability of the
atmosphere. Among these, atmospheric stability is again composed of different
meteorological measurements, including wind speed, temperature, cloud cover rate
and solar radiation. These meteorological data is observed and recorded by the
weather station facilities, either on the surface or upper-air. While the general
measurements taken include wind speed, wind direction, precipitation amounts
and cloud cover rate, some extensive thermodynamic information such as solar
radiation and mixing height are not usually recorded because of the lack of recording
instruments. Mixing height data is usually captured by upper air stations, and solar
radiation is measured by pyranometers or actinometers, yet these instruments are not
always equipped in any meteorological station. It is the real case of many developing
countries where the meteorological network systems are not well-equipped. Vietnam
is one typical example. There are in total 174 surface metrological stations in this
country, yet only 9 stations are equipped with upper air instruments and none of them
can operate solar radiation recording [16]. Even in Ninh Thuan province, the location
that the Vietnamese government has a plan to build the NPP in the near future, there is
currently only one surface meteorological station without mixing height and solar
radiation capture capability. There is only the surface meteorological data of the single
site that can be recorded. In such situation, neither GPM nor PTM can be used for
modelling the atmospheric dispersion. Meteorological data from a monitoring site
within the area of interest, therefore, become a crucial component for the design of
atmospheric dispersion modelling.
4
Table 1.2: The comparison of weather indicator record between surface and upper-air
station in Vietnam and Japan
Surface Weather Station
Limited
Full
Wind Profile
o
o
Temperature
o
o
Precipitation (rainfall)
o
o
Air Pressure
o
o
Humidity
o
o
Visibility
o
o
Cloud Cove Rate
o
o
Solar radiation
Upper-Air Weather
Station
o
Vertical Wind
o
Vertical Temperature
o
Vietnam [16][17]
Japan [18]
174
(>=3 hourly)
0
9
(>=12 hourly)
>600
(<=10
minutely)
~690
(<=10
minutely)
31
(<=10 minutely)
The table 1.2 shows the comparison between weather station types. It has
surface weather station and upper-air weather station. In surface weather station,
some station has a fully record of meteorological indicator that is called by fully
surface weather station, the other just record some basic meteorological indicator
such as they just record wind or temperature is called limited surface weather station.
The current weather station network in Vietnam has 174 surface weather stations,
and all of them is the limited surface weather station, no fully surface weather station,
9 upper-air weather station. For surface weather station, these stations record 8 times
per day, but for upper-air weather station, they just records one or two times per day.
Compare with Japan, Japan has around 600 limited surface weather stations, around
700 full surface weather stations and 31 upper-air stations. Most of the station, record
5
every 10 minutes. Therefore, it can say that in Viet Nam the weather station just can
provide a very limited meteorological data for radionuclide risk assessment.
In conclusion, Vietnamese government needs a clear answer about the risk of
radionuclide released from NPP to the public. However, the current tool for risk
assessment which is the atmospheric dispersion model needs the complete
meteorological data. Therefore, to achieve a clear answer about the radiological risk, it
is vital to develop an atmospheric dispersion model that can be workable under the
limited of current atmospheric data in Ninh Thuan NPP sites.
1.2 Research Objectives
Based on the reasons in the previous section, the research objective aims to create a
tool, an atmospheric dispersion model, supporting for risk assessment of toxic
pollutant released in the atmosphere under the limitation of atmospheric database
availability and apply it for Ninh Thuan NPP site.
This study is an attempt to construct a model, namely, Simplified Wind Transport
Model (SWTM) to estimate the transport of radionuclides in the atmosphere for the
nuclear site. It provides overview estimation about how radionuclide transport based
on the historical wind speed and direction. SWTM is designed by efforts to decrease
meteorological input data demands. More specifically, its use avoids the limitations
associated with steady-state models like GPM by taking into account the time-varying
wind condition. The model can also overcome the limitation on the meteorological
data from a monitoring NPP site by providing prediction radionuclide dispersion
based on the widely available data of the wind speed and direction.
In order to demonstrate the usefulness and applicability of SWTM model, the
simulation radionuclides transport in the atmosphere is implemented for Ninh Thuan
2 NPP site in Vietnam through a total of 40,904 meteorological conditions over an
fourteen-year period (1996 - 2009). With the goal of building four units of nuclear
power reactors in Ninh Thuan 2 NPP site under the partnership with Japan, it is a
requisite for Vietnamese policy makers to assess the risk by radioactivity release.
SWTM simulation results are used to produce the spatial risk maps for potential area
6
affected by radioactive release. Based on that, it helps the planners to facilitate
preparedness and mitigation strategies, and to discuss policies on safety and
environment at regional and national levels.
Moreover, this study is an attempt to develop and to evaluate a practical
methodology to assess the offsite dose of a hypothetical nuclear power plant (NPP)
accident at the Ninh Thuan 2 NPP in Vietnam. The dose factor of radioactivity releases
in airborne that enter the human body through inhalation exposure pathway is
primarily focused to evaluate the human dose of interest. Based on the estimation of
offsite dose, this research provides the comparative results of estimating exclusion
zone and low population zone. The results can be used by the government in planning
the critical zones and in producing the evacuation policy in case of NPP accident to
limit and minimize the consequence of the radionuclide to the public and the
environment
1.3 Outline of the Research
This thesis is organized in 8 chapters as follows:
Chapter 1 – Introduction. This chapter introduces the background, the
motivation and the objectives of the research. The outline of this thesis is also briefly
described in this chapter.
Chapter 2 – Technical Background. The technical background chapter introduces
the main component of assessing radiological risk such as radionuclide source term,
atmospheric transport of radionuclides, offsite dose assessment through different
pathway.
Chapter 3 – Research Site Characteristics. The chapter 3 presents an overview of
Vietnam nuclear power plant program and the some characteristics of Ninh Thuan
nuclear power plant site.
Chapter 4 – Meteorological Database. This chapter describes how the
meteorological data is collected. Moreover, this chapter also present the current
7
situation of meteorological database and the preparing input meteorological data
process supporting for atmospheric dispersion model.
Chapter 5 – Simplified Wind Transport Model. This chapter introduces the
proposed atmospheric dispersion model – Simplified Wind Transport model. It
contains the methodology of SWTM and the application of SWTM for Ninh Thuan NPP
site.
Chapter 6 – Revised Simplified Wind Transport Model. This chapter explains the
methodology in order to improve the major weakness point of SWTM. It provides a
more realistic estimation of atmospheric diffusion by applying Pasquill-Turner
method in estimating atmospheric stability class.
Chapter 7 – Offsite Dose Assessment and Zone Planning. This chapter present the
methodology in assessing the offsite dose and the regular in creating zone planning.
This chapter also introduce the different approach in determining the zone planning.
Chapter 8 – Discussion and Conclusion. This chapter presents the overall
conclusions of this research work and describes the future development of this
research in nuclear safety technology and radionuclide risk assessment.
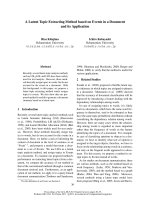
The figure 1.1 below shows the relation among the main component of this thesis.
More specifically, this research is divided into two main components. The first
component is the simplified wind transport model (Chapter 5). The proposing
atmospheric dispersion model can work under the limited of atmospheric data. The
input data of SWTM is just only wind direction and wind speed over the travel time of
radionuclide. Based on the result of SWTM, spatial risk map is created. The second
component (Chapter 6 and Chapter 7) is the revised of SWTM and its application.
Based on the advantage and disadvantage of SWTM that proposed in the first part, this
part focus on improve the weakness point of SWTM in estimating the dispersion. The
second component also introduces some applications of revised SWTM in estimating
offsite dose and the low population zone distance.
8
Meteorological
Database
Wind Speed
Wind Direction
Cloud Cove Rate
Pasquill-Turner Method
Atmospheric Stability
Radionuclide
Source Term
Simplified Wind
Transport Model
(SWTM)
Spatial Risk Map
Revised
RevisedSWTM
of SWTM
Gaussian Plume Model
Revised Spatial
Risk Map
Offsite Dose
Zone Planning
Figure 1.1: The relation among the main components of thesis
9
10
Chapter 2.
TECHNICAL BACKGROUND
2.1 Radionuclide Source Term
The source term is the characterization and quantification of the material released to
the environment [19]. Source term refers to the quantities and compositions of
radioactive materials released, locations of the release points, and the rates of release
during the times considered in the assessment [19]. The released radionuclides may
be gaseous, associated with airborne particles, or dissolved or suspended in aqueous
or other liquids [19]. Operating facilities typically have routine releases of
radionuclides to air via stacks and chimneys and to water bodies via liquid discharge
outfalls [19]. Waste materials that are stored onsite or at disposal facilities may be
released to the air or water, or to the soil and then to groundwater [19]. In all cases,
the particle size and chemical form or solubility of the released activity can be
important for the proper estimation of radionuclide transport in the environment [15].
The release of radioactive substances from a reactor to the environment (the
source term) depends on the following factors [20]:
-
The inventory of fission products and other radionuclides in the core (or the
inventory in experimental devices or other locations such as the spent fuel pool
or isotope production facilities) [20]
-
The progression of core damage (or failure of experimental devices or isotope
production facilities) [20]
11
-
The fraction of radionuclides released from the fuel (or from experimental
devices or other locations), and the physical and chemical forms of released
radioactive materials [20]
-
The retention of radionuclides in the primary cooling system[20]
-
The performance of means of confinement (e.g. emergency ventilation rate,
filter efficiency, leak rate, liquid effluent release rate, radioactive decay due to
time delay of release, deposition on surfaces and resuspension) [20].
2.1.1 Fission Product Characteristics
The large number of fission and activation products that are formed during the fission
process can be grouped into a small set of categories of elements with similar physical
or chemical behaviours [21]. The radionuclide classification scheme used in the
Reactor Safety Study [21] is given in Table 2.1.
Table 2.1: Radionuclide Classification Scheme used in the Reactor Safety Study
Class
Relevant radionuclides
Noble gases
Xe, Kr
Halogens
I, Br
Alkali metals
Cs, Rb
Tellurium group
Te, Se, Sb
Alkaline earths
Sr, Ba
Transition metals
Ru, Mo, Pd, Rh, Te
Lanthanides and actinides
La, Nd, Eu, Y, Ce, Pr, Pm, Sm, Np, Pu, Zr, Nb
The nuclides of interest in source term calculations are gaseous, volatile and
semi-volatile nuclides, since these are the most likely to be released from overheated
fuel elements [20]. The gaseous elements are the noble gas isotopes of krypton and
xenon, and the volatile elements are iodine, caesium and the tellurium group, except
12
antimony [20]. The semi-volatile elements, roughly in order of decreasing volatility,
are: ruthenium, antimony, barium, strontium, cerium and lanthanum, among others
[20]. The rare earths and actinides have much higher boiling points and usually
remain dissolved in the fuel [20].
Precursor sources of radionuclides of interest such as iodine can be determined
from their decay chains and yields [20]. Precursor sources are frequently neglected,
but can be important under some circumstances [20]. For example, the post-shutdown
production of
131I
from
131Te
and the production of
135Xe
from
135I
are of importance
and should be considered [20]. On the other hand, tellurium reacts strongly with some
core materials such as zirconium, delaying its release [20]. Thus, each reactor and
possible accident sequence type must be considered on an individual basis [20].
Frequently, the iodine fractions are increased by some conservative factor to allow for
precursor production [20].
A further consideration is desirable when selecting which radionuclides
contribute significantly to the dose [20]. It usually suffices to consider the following
set of radionuclides [20]:
-
Whole body: noble gases (particularly 88Kr, 135Xe and 133Xe) [20]
-
Thyroid: Iodines (particularly 131I, 133I) [20].
-
Lung/internal: volatile nuclides (e.g.
131I, 132Te, 106Ru, 134Cs, 137Cs)
and, for
scenarios of high core temperatures (>1000𝑜 ), 90Sr [20].
Although some radionuclides deliver a skin dose, they are not major contributors
to the limiting dose, and it is usual to neglect the skin dose [20].
2.1.2 Radionuclide Source Terms
The amount of activity of other radionuclides (e.g. activation products and
transmutation isotopes) usually is significantly less than that of the fission products
[20]. Therefore, other radionuclides do not contribute significantly to the source term
and accident consequences [20]. Thus, the source term for these other radionuclides is
of significantly less importance and in many cases may be omitted from the source
13