Two population means with unknown standard deviations
Bạn đang xem bản rút gọn của tài liệu. Xem và tải ngay bản đầy đủ của tài liệu tại đây (438.02 KB, 21 trang )
Two Population Means with Unknown Standard Deviations
Two Population Means with
Unknown Standard
Deviations
By:
OpenStaxCollege
1. The two independent samples are simple random samples from two distinct
populations.
2. For the two distinct populations:
◦ if the sample sizes are small, the distributions are important (should be
normal)
◦ if the sample sizes are large, the distributions are not important (need
not be normal)
NOTE The test comparing two independent population means with unknown and
possibly unequal population standard deviations is called the Aspin-Welch t-test. The
degrees of freedom formula was developed by Aspin-Welch.
The comparison of two population means is very common. A difference between the
two samples depends on both the means and the standard deviations. Very different
means can occur by chance if there is great variation among the individual samples. In
¯ ¯
order to account for the variation, we take the difference of the sample means, X1 – X2
, and divide by the standard error in order to standardize the difference. The result is a
t-score test statistic.
Because we do not know the population standard deviations, we estimate them using
the two sample standard deviations from our independent samples. For the hypothesis
test, we calculate the estimated standard deviation, or standard error, of the difference
¯ ¯
in sample means, X1 – X2.
The standard error is:
√
(s1)2
n1
+
(s2)2
n2
1/21
Two Population Means with Unknown Standard Deviations
The test statistic (t-score) is calculated as follows:
¯ ¯
(x1 – x2) – (μ1 – μ2)
√
(s1)2
n1
+
(s2)2
n2
where:
• s1 and s2, the sample standard deviations, are estimates of σ1 and σ2,
respectively.
• σ1 and σ1 are the unknown population standard deviations.
¯
¯
• x1 and x2 are the sample means. μ1 and μ2 are the population means.
The number of degrees of freedom (df) requires a somewhat complicated calculation.
However, a computer or calculator calculates it easily. The df are not always a whole
number. The test statistic calculated previously is approximated by the Student's tdistribution with df as follows:
Degrees of freedom
df =
(
( )(
1
n1 – 1
(s1)2
n1
(s1)2
n1
(s2)2
n2
+
2
2
)
2
) + ( )( )
1
n2 – 1
(s2)2
n2
When both sample sizes n1 and n2 are five or larger, the Student's t approximation
is very good. Notice that the sample variances (s1)2 and (s2)2 are not pooled. (If the
question comes up, do not pool the variances.)
NOTEIt is not necessary to compute this by hand. A calculator or computer easily
computes it.
Independent groups
The average amount of time boys and girls aged seven to 11 spend playing sports each
day is believed to be the same. A study is done and data are collected, resulting in the
data in [link]. Each populations has a normal distribution.
Sample
Size
Average Number of Hours Playing Sports Sample Standard
Per Day
Deviation
Girls 9
2
√0.866
Boys 16
3.2
1.00
2/21
Two Population Means with Unknown Standard Deviations
Is there a difference in the mean amount of time boys and girls aged seven to 11 play
sports each day? Test at the 5% level of significance.
The population standard deviations are not known. Let g be the subscript for girls
and b be the subscript for boys. Then, μg is the population mean for girls and μb is the
population mean for boys. This is a test of two independent groups, two population
means.
¯ ¯
Random variable: Xg − Xb = difference in the sample mean amount of time girls and
boys play sports each day.
H0: μg = μb
H0: μg – μb = 0
Ha: μg ≠ μb
Ha: μg – μb ≠ 0
The words "the same" tell you H0 has an "=". Since there are no other words to indicate
Ha, assume it says "is different." This is a two-tailed test.
Distribution for the test: Use tdf where df is calculated using the df formula for
independent groups, two population means. Using a calculator, df is approximately
18.8462. Do not pool the variances.
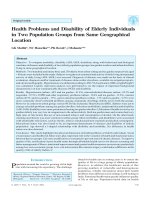
Calculate the p-value using a Student's t-distribution: p-value = 0.0054
Graph:
sg = √0.866
sb = 1
¯ ¯
So, xg – xb = 2 – 3.2 = –1.2
Half the p-value is below –1.2 and half is above 1.2.
Make a decision: Since α > p-value, reject H0. This means you reject μg = μb. The
means are different.
3/21
Two Population Means with Unknown Standard Deviations
Press STAT. Arrow over to TESTS and press 4:2-SampTTest. Arrow over to Stats
and press ENTER. Arrow down and enter 2 for the first sample mean, √0.866 for
Sx1, 9 for n1, 3.2 for the second sample mean, 1 for Sx2, and 16 for n2. Arrow down
to μ1: and arrow to does not equal μ2. Press ENTER. Arrow down to Pooled:
and No. Press ENTER. Arrow down to Calculate and press ENTER. The p-value is
p = 0.0054, the dfs are approximately 18.8462, and the test statistic is -3.14. Do the
procedure again but instead of Calculate do Draw.
Conclusion: At the 5% level of significance, the sample data show there is sufficient
evidence to conclude that the mean number of hours that girls and boys aged seven to 11
play sports per day is different (mean number of hours boys aged seven to 11 play sports
per day is greater than the mean number of hours played by girls OR the mean number
of hours girls aged seven to 11 play sports per day is greater than the mean number of
hours played by boys).
Try It
Two samples are shown in [link]. Both have normal distributions. The means for the
two populations are thought to be the same. Is there a difference in the means? Test at
the 5% level of significance.
Sample Size Sample Mean Sample Standard Deviation
Population A 25
5
1
Population B 16
4.7
1.2
The p-value is 0.4125, which is much higher than 0.05, so we decline to reject the
null hypothesis. There is not sufficient evidence to conclude that the means of the two
populations are not the same.
NOTE
When the sum of the sample sizes is larger than 30 (n1 + n2 > 30) you can use the normal
distribution to approximate the Student's t.
A study is done by a community group in two neighboring colleges to determine which
one graduates students with more math classes. College A samples 11 graduates. Their
average is four math classes with a standard deviation of 1.5 math classes. College B
samples nine graduates. Their average is 3.5 math classes with a standard deviation
of one math class. The community group believes that a student who graduates from
college A has taken more math classes, on the average. Both populations have a
normal distribution. Test at a 1% significance level. Answer the following questions.
4/21
Two Population Means with Unknown Standard Deviations
a. Is this a test of two means or two proportions?
a. two means
b. Are the populations standard deviations known or unknown?
b. unknown
c. Which distribution do you use to perform the test?
c. Student's t
d. What is the random variable?
¯ ¯
d. XA − XB
e. What are the null and alternate hypotheses? Write the null and alternate hypotheses in
words and in symbols.
e.
• Ho : μA ≤ μB
• Ha : μA > μB
f. Is this test right-, left-, or two-tailed?
f.
right
g. What is the p-value?
5/21
Two Population Means with Unknown Standard Deviations
g. 0.1928
h. Do you reject or not reject the null hypothesis?
h. Do not reject.
i. Conclusion:
i. At the 1% level of significance, from the sample data, there is not sufficient evidence
to conclude that a student who graduates from college A has taken more math classes,
on the average, than a student who graduates from college B.
Try It
A study is done to determine if Company A retains its workers longer than Company B.
Company A samples 15 workers, and their average time with the company is five years
with a standard deviation of 1.2. Company B samples 20 workers, and their average
time with the company is 4.5 years with a standard deviation of 0.8. The populations are
normally distributed.
1. Are the population standard deviations known?
2. Conduct an appropriate hypothesis test. At the 5% significance level, what is
your conclusion?
1. They are unknown.
2. The p-value = 0.0878. At the 5% level of significance, there is insufficient
evidence to conclude that the workers of Company A stay longer with the
company.
A professor at a large community college wanted to determine whether there is a
difference in the means of final exam scores between students who took his statistics
course online and the students who took his face-to-face statistics class. He believed
that the mean of the final exam scores for the online class would be lower than that of
the face-to-face class. Was the professor correct? The randomly selected 30 final exam
scores from each group are listed in [link] and [link].
Online Class
67.6 41.2 85.3 55.9 82.4 91.2 73.5 94.1 64.7 64.7
70.6 38.2 61.8 88.2 70.6 58.8 91.2 73.5 82.4 35.5
94.1 88.2 64.7 55.9 88.2 97.1 85.3 61.8 79.4 79.4
6/21
Two Population Means with Unknown Standard Deviations
Face-to-face Class
77.9 95.3 81.2 74.1 98.8 88.2 85.9 92.9 87.1 88.2
69.4 57.6 69.4 67.1 97.6 85.9 88.2 91.8 78.8 71.8
98.8 61.2 92.9 90.6 97.6 100 95.3 83.5 92.9 89.4
Is the mean of the Final Exam scores of the online class lower than the mean of the
Final Exam scores of the face-to-face class? Test at a 5% significance level. Answer the
following questions:
1.
2.
3.
4.
5.
6.
7.
8.
9.
Is this a test of two means or two proportions?
Are the population standard deviations known or unknown?
Which distribution do you use to perform the test?
What is the random variable?
What are the null and alternative hypotheses? Write the null and alternative
hypotheses in words and in symbols.
Is this test right, left, or two tailed?
What is the p-value?
Do you reject or not reject the null hypothesis?
At the ___ level of significance, from the sample data, there ______ (is/is not)
sufficient evidence to conclude that ______.
(See the conclusion in [link], and write yours in a similar fashion)
First put the data for each group into two lists (such as L1 and L2). Press STAT.
Arrow over to TESTS and press 4:2SampTTest. Make sure Data is highlighted and press
ENTER. Arrow down and enter L1 for the first list and L2 for the second list. Arrow
down to μ1: and arrow to ≠ μ2 (does not equal). Press ENTER. Arrow down to Pooled:
No. Press ENTER. Arrow down to Calculate and press ENTER.
Note
Be careful not to mix up the information for Group 1 and Group 2!
1. two means
2. unknown
3. Student's t
¯ ¯
4. X1 – X2
5.
1. H0: μ1 = μ2 Null hypothesis: the means of the final exam scores are
equal for the online and face-to-face statistics classes.
7/21
Two Population Means with Unknown Standard Deviations
2. Ha: μ1 < μ2 Alternative hypothesis: the mean of the final exam scores of
the online class is less than the mean of the final exam scores of the
face-to-face class.
6. left-tailed
7. p-value = 0.0011
8. Reject the null hypothesis
9. The professor was correct. The evidence shows that the mean of the final exam
scores for the online class is lower than that of the face-to-face class.
At the 5% level of significance, from the sample data, there is (is/is not)
sufficient evidence to conclude that the mean of the final exam scores for the
online class is less than the mean of final exam scores of the face-to-face class.
Cohen's Standards for Small, Medium, and Large Effect SizesCohen's d is a measure
of effect size based on the differences between two means. Cohen’s d, named for
United States statistician Jacob Cohen, measures the relative strength of the differences
between the means of two populations based on sample data. The calculated value of
effect size is then compared to Cohen’s standards of small, medium, and large effect
sizes.
Cohen's Standard
Effect Sizes
Size of effect d
Small
0.2
medium
0.5
Large
0.8
Cohen's d is the measure of the difference between two means divided by the pooled
standard deviation: d =
¯ ¯
x1 – x2
spooled
where spooled =
√
(n1 – 1)s21 + (n2 – 1)s22
n1 + n2 – 2
Calculate Cohen’s d for [link]. Is the size of the effect small, medium, or large? Explain
what the size of the effect means for this problem.
8/21
Two Population Means with Unknown Standard Deviations
μ1 = 4 s1 = 1.5 n1 = 11
μ2 = 3.5 s2 = 1 n2 = 9
d = 0.384
The effect is small because 0.384 is between Cohen’s value of 0.2 for small effect size
and 0.5 for medium effect size. The size of the differences of the means for the two
colleges is small indicating that there is not a significant difference between them.
Calculate Cohen’s d for [link]. Is the size of the effect small, medium or large? Explain
what the size of the effect means for this problem.
d = 0.834; Large, because 0.834 is greater than Cohen’s 0.8 for a large effect size. The
size of the differences between the means of the Final Exam scores of online students
and students in a face-to-face class is large indicating a significant difference.
Try It
Weighted alpha is a measure of risk-adjusted performance of stocks over a period of
a year. A high positive weighted alpha signifies a stock whose price has risen while a
small positive weighted alpha indicates an unchanged stock price during the time period.
Weighted alpha is used to identify companies with strong upward or downward trends.
The weighted alpha for the top 30 stocks of banks in the northeast and in the west as
identified by Nasdaq on May 24, 2013 are listed in [link] and [link], respectively.
Northeast
94.2 75.2 69.6 52.0 48.0 41.9 36.4 33.4 31.5 27.6
77.3 71.9 67.5 50.6 46.2 38.4 35.2 33.0 28.7 26.5
76.3 71.7 56.3 48.7 43.2 37.6 33.7 31.8 28.5 26.0
West
126.0 70.6 65.2 51.4 45.5 37.0 33.0 29.6 23.7 22.6
116.1 70.6 58.2 51.2 43.2 36.0 31.4 28.7 23.5 21.6
78.2
68.2 55.6 50.3 39.0 34.1 31.0 25.3 23.4 21.5
Is there a difference in the weighted alpha of the top 30 stocks of banks in the northeast
and in the west? Test at a 5% significance level. Answer the following questions:
1.
2.
3.
4.
Is this a test of two means or two proportions?
Are the population standard deviations known or unknown?
Which distribution do you use to perform the test?
What is the random variable?
9/21
Two Population Means with Unknown Standard Deviations
5. What are the null and alternative hypotheses? Write the null and alternative
hypotheses in words and in symbols.
6. Is this test right, left, or two tailed?
7. What is the p-value?
8. Do you reject or not reject the null hypothesis?
9. At the ___ level of significance, from the sample data, there ______ (is/is not)
sufficient evidence to conclude that ______.
10. Calculate Cohen’s d and interpret it.
1. two means
2. unknown
3. Student’s-t
¯ ¯
4. X1 - X2
5.
1. H0 : μ1 = μ2 Null hypothesis: the means of the weighted alphas are
equal.
2. Ha : μ1 ≠ μ2 Alternative hypothesis : the means of the weighted alphas
are not equal.
6. two-tailed
7. p-value = 0.8787
8. Do not reject the null hypothesis
9. This indicates that the trends in stocks are about the same in the top 30 banks in
each region.
5% level of significance, from the sample data, there is not sufficient evidence
to conclude that the mean weighted alphas for the banks in the northeast and
the west are different
10. d = 0.040, Very small, because 0.040 is less than Cohen’s value of 0.2 for small
effect size. The size of the difference of the means of the weighted alphas for
the two regions of banks is small indicating that there is not a significant
difference between their trends in stocks.
References
Data from Graduating Engineer + Computer Careers. Available online at
Data from Microsoft Bookshelf.
10/21
Two Population Means with Unknown Standard Deviations
Data from the United States Senate website, available online at www.Senate.gov
(accessed June 17, 2013).
“List of current United States Senators by Age.” Wikipedia. Available online at
/>(accessed June 17, 2013).
“Sectoring by Industry Groups.” Nasdaq. Available online at />markets/barchart-sectors.aspx?page=sectors&base=industry (accessed June 17, 2013).
“Strip Clubs: Where Prostitution and Trafficking Happen.” Prostitution Research and
Education,
2013.
Available
online
at
www.prostitutionresearch.com/
ProsViolPosttrauStress.html (accessed June 17, 2013).
“World Series History.” Baseball-Almanac, 2013. Available online
(accessed June 17, 2013).
at
Chapter Review
Two population means from independent samples where the population standard
deviations are not known
¯ ¯
• Random Variable: X1 − X2 = the difference of the sampling means
• Distribution: Student's t-distribution with degrees of freedom (variances not
pooled)
Formula Review
Standard error: SE =
√
(s1)2
n1
Test statistic (t-score): t =
+
(s2)2
n2
¯
¯
(x1 − x2) − (μ1 − μ2)
√
(s1)2
(s2)2
+ n
n1
2
Degrees of freedom:
(
)( )
(s1)2
df =
n1
(
+
(s2)2
n2
)
2
2
2
(s1)2
(s2)2
1
1
+ n −1 n
n1 − 1
n1
2
2
( )(
)
where:
11/21
Two Population Means with Unknown Standard Deviations
s1 and s2 are the sample standard deviations, and n1 and n2 are the sample sizes.
¯
¯
x1 and x2 are the sample means.
Cohen’s d is the measure of effect size:
d=
¯
¯
x1 − x2
spooled
where spooled =
√
(n1 − 1)s21 + (n2 − 1)s22
n1 + n2 − 2
Use the following information to answer the next 15 exercises: Indicate if the hypothesis
test is for
1. independent group means, population standard deviations, and/or variances
known
2. independent group means, population standard deviations, and/or variances
unknown
3. matched or paired samples
4. single mean
5. two proportions
6. single proportion
It is believed that 70% of males pass their drivers test in the first attempt, while 65%
of females pass the test in the first attempt. Of interest is whether the proportions are in
fact equal.
two proportions
A new laundry detergent is tested on consumers. Of interest is the proportion of
consumers who prefer the new brand over the leading competitor. A study is done to test
this.
A new windshield treatment claims to repel water more effectively. Ten windshields
are tested by simulating rain without the new treatment. The same windshields are then
treated, and the experiment is run again. A hypothesis test is conducted.
matched or paired samples
The known standard deviation in salary for all mid-level professionals in the financial
industry is $11,000. Company A and Company B are in the financial industry. Suppose
samples are taken of mid-level professionals from Company A and from Company B.
The sample mean salary for mid-level professionals in Company A is $80,000. The
12/21
Two Population Means with Unknown Standard Deviations
sample mean salary for mid-level professionals in Company B is $96,000. Company
A and Company B management want to know if their mid-level professionals are paid
differently, on average.
The average worker in Germany gets eight weeks of paid vacation.
single mean
According to a television commercial, 80% of dentists agree that Ultrafresh toothpaste
is the best on the market.
It is believed that the average grade on an English essay in a particular school system
for females is higher than for males. A random sample of 31 females had a mean score
of 82 with a standard deviation of three, and a random sample of 25 males had a mean
score of 76 with a standard deviation of four.
independent group means, population standard deviations and/or variances unknown
The league mean batting average is 0.280 with a known standard deviation of 0.06. The
Rattlers and the Vikings belong to the league. The mean batting average for a sample
of eight Rattlers is 0.210, and the mean batting average for a sample of eight Vikings
is 0.260. There are 24 players on the Rattlers and 19 players on the Vikings. Are the
batting averages of the Rattlers and Vikings statistically different?
In a random sample of 100 forests in the United States, 56 were coniferous or contained
conifers. In a random sample of 80 forests in Mexico, 40 were coniferous or contained
conifers. Is the proportion of conifers in the United States statistically more than the
proportion of conifers in Mexico?
two proportions
A new medicine is said to help improve sleep. Eight subjects are picked at random and
given the medicine. The means hours slept for each person were recorded before starting
the medication and after.
It is thought that teenagers sleep more than adults on average. A study is done to verify
this. A sample of 16 teenagers has a mean of 8.9 hours slept and a standard deviation of
1.2. A sample of 12 adults has a mean of 6.9 hours slept and a standard deviation of 0.6.
independent group means, population standard deviations and/or variances unknown
Varsity athletes practice five times a week, on average.
13/21
Two Population Means with Unknown Standard Deviations
A sample of 12 in-state graduate school programs at school A has a mean tuition of
$64,000 with a standard deviation of $8,000. At school B, a sample of 16 in-state
graduate programs has a mean of $80,000 with a standard deviation of $6,000. On
average, are the mean tuitions different?
independent group means, population standard deviations and/or variances unknown
A new WiFi range booster is being offered to consumers. A researcher tests the native
range of 12 different routers under the same conditions. The ranges are recorded. Then
the researcher uses the new WiFi range booster and records the new ranges. Does the
new WiFi range booster do a better job?
A high school principal claims that 30% of student athletes drive themselves to school,
while 4% of non-athletes drive themselves to school. In a sample of 20 student athletes,
45% drive themselves to school. In a sample of 35 non-athlete students, 6% drive
themselves to school. Is the percent of student athletes who drive themselves to school
more than the percent of nonathletes?
two proportions
Use the following information to answer the next three exercises: A study is done to
determine which of two soft drinks has more sugar. There are 13 cans of Beverage A in
a sample and six cans of Beverage B. The mean amount of sugar in Beverage A is 36
grams with a standard deviation of 0.6 grams. The mean amount of sugar in Beverage
B is 38 grams with a standard deviation of 0.8 grams. The researchers believe that
Beverage B has more sugar than Beverage A, on average. Both populations have normal
distributions.
Are standard deviations known or unknown?
What is the random variable?
The random variable is the difference between the mean amounts of sugar in the two
soft drinks.
Is this a one-tailed or two-tailed test?
Use the following information to answer the next 12 exercises: The U.S. Center for
Disease Control reports that the mean life expectancy was 47.6 years for whites born in
1900 and 33.0 years for nonwhites. Suppose that you randomly survey death records for
people born in 1900 in a certain county. Of the 124 whites, the mean life span was 45.3
years with a standard deviation of 12.7 years. Of the 82 nonwhites, the mean life span
14/21
Two Population Means with Unknown Standard Deviations
was 34.1 years with a standard deviation of 15.6 years. Conduct a hypothesis test to see
if the mean life spans in the county were the same for whites and nonwhites.
Is this a test of means or proportions?
means
State the null and alternative hypotheses.
1. H0: __________
2. Ha: __________
Is this a right-tailed, left-tailed, or two-tailed test?
two-tailed
In symbols, what is the random variable of interest for this test?
In words, define the random variable of interest for this test.
the difference between the mean life spans of whites and nonwhites
Which distribution (normal or Student's t) would you use for this hypothesis test?
Explain why you chose the distribution you did for [link].
This is a comparison of two population means with unknown population standard
deviations.
Calculate the test statistic and p-value.
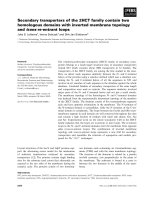
Sketch a graph of the situation. Label the horizontal axis. Mark the hypothesized
difference and the sample difference. Shade the area corresponding to the p-value.
Check student’s solution.
Find the p-value.
At a pre-conceived α = 0.05, what is your:
1. Decision:
2. Reason for the decision:
3. Conclusion (write out in a complete sentence):
15/21
Two Population Means with Unknown Standard Deviations
1. Reject the null hypothesis
2. p-value < 0.05
3. There is not enough evidence at the 5% level of significance to support the
claim that life expectancy in the 1900s is different between whites and
nonwhites.
Does it appear that the means are the same? Why or why not?
Homework
DIRECTIONS: For each of the word problems, use a solution sheet to do the hypothesis
test. The solution sheet is found in Appendix E. Please feel free to make copies of the
solution sheets. For the online version of the book, it is suggested that you copy the .doc
or the .pdf files.
NOTE
If you are using a Student's t-distribution for a homework problem in what follows,
including for paired data, you may assume that the underlying population is normally
distributed. (When using these tests in a real situation, you must first prove that
assumption, however.)
The mean number of English courses taken in a two–year time period by male and
female college students is believed to be about the same. An experiment is conducted
and data are collected from 29 males and 16 females. The males took an average of three
English courses with a standard deviation of 0.8. The females took an average of four
English courses with a standard deviation of 1.0. Are the means statistically the same?
A student at a four-year college claims that mean enrollment at four–year colleges is
higher than at two–year colleges in the United States. Two surveys are conducted. Of
the 35 two–year colleges surveyed, the mean enrollment was 5,068 with a standard
deviation of 4,777. Of the 35 four-year colleges surveyed, the mean enrollment was
5,466 with a standard deviation of 8,191.
Subscripts: 1: two-year colleges; 2: four-year colleges
1. H0: μ1 ≥ μ2
2. Ha: μ1 < μ2
¯ ¯
3. X1 – X2 is the difference between the mean enrollments of the two-year colleges
and the four-year colleges.
4. Student’s-t
5. test statistic: -0.2480
6. p-value: 0.4019
16/21
Two Population Means with Unknown Standard Deviations
7. Check student’s solution.
8.
1. Alpha: 0.05
2. Decision: Do not reject
3. Reason for Decision: p-value > alpha
4. Conclusion: At the 5% significance level, there is sufficient evidence to
conclude that the mean enrollment at four-year colleges is higher than
at two-year colleges.
At Rachel’s 11th birthday party, eight girls were timed to see how long (in seconds)
they could hold their breath in a relaxed position. After a two-minute rest, they timed
themselves while jumping. The girls thought that the mean difference between their
jumping and relaxed times would be zero. Test their hypothesis.
Relaxed time (seconds) Jumping time (seconds)
26
21
47
40
30
28
22
21
23
25
45
43
37
35
29
32
Mean entry-level salaries for college graduates with mechanical engineering degrees
and electrical engineering degrees are believed to be approximately the same. A
recruiting office thinks that the mean mechanical engineering salary is actually lower
than the mean electrical engineering salary. The recruiting office randomly surveys 50
entry level mechanical engineers and 60 entry level electrical engineers. Their mean
salaries were $46,100 and $46,700, respectively. Their standard deviations were $3,450
and $4,210, respectively. Conduct a hypothesis test to determine if you agree that the
mean entry-level mechanical engineering salary is lower than the mean entry-level
electrical engineering salary.
Subscripts: 1: mechanical engineering; 2: electrical engineering
1. H0: µ1 ≥ µ2
2. Ha: µ1 < µ2
17/21
Two Population Means with Unknown Standard Deviations
¯ ¯
3. X1 − X2 is the difference between the mean entry level salaries of mechanical
engineers and electrical engineers.
4. t108
5. test statistic: t = –0.82
6. p-value: 0.2061
7. Check student’s solution.
8.
1. Alpha: 0.05
2. Decision: Do not reject the null hypothesis.
3. Reason for Decision: p-value > alpha
4. Conclusion: At the 5% significance level, there is insufficient evidence
to conclude that the mean entry-level salaries of mechanical engineers
is lower than that of electrical engineers.
Marketing companies have collected data implying that teenage girls use more ring
tones on their cellular phones than teenage boys do. In one particular study of 40
randomly chosen teenage girls and boys (20 of each) with cellular phones, the mean
number of ring tones for the girls was 3.2 with a standard deviation of 1.5. The mean for
the boys was 1.7 with a standard deviation of 0.8. Conduct a hypothesis test to determine
if the means are approximately the same or if the girls’ mean is higher than the boys’
mean.
Use the information from [link] to answer the next four exercises.
Using the data from Lap 1 only, conduct a hypothesis test to determine if the mean time
for completing a lap in races is the same as it is in practices.
1. H0: µ1 = µ2
2. Ha: µ1 ≠ µ2
¯ ¯
3. X1 − X2 is the difference between the mean times for completing a lap in races
and in practices.
4. t20.32
5. test statistic: –4.70
6. p-value: 0.0001
7. Check student’s solution.
8.
1. Alpha: 0.05
2. Decision: Reject the null hypothesis.
3. Reason for Decision: p-value < alpha
4. Conclusion: At the 5% significance level, there is sufficient evidence to
conclude that the mean time for completing a lap in races is different
from that in practices.
Repeat the test in Exercise 10.83, but use Lap 5 data this time.
18/21
Two Population Means with Unknown Standard Deviations
Repeat the test in Exercise 10.83, but this time combine the data from Laps 1 and 5.
1. H0: µ1 = µ2
2. Ha: µ1 ≠ µ2
3. is the difference between the mean times for completing a lap in races and in
practices.
4. t40.94
5. test statistic: –5.08
6. p-value: zero
7. Check student’s solution.
8.
1. Alpha: 0.05
2. Decision: Reject the null hypothesis.
3. Reason for Decision: p-value < alpha
4. Conclusion: At the 5% significance level, there is sufficient evidence to
conclude that the mean time for completing a lap in races is different
from that in practices.
In two to three complete sentences, explain in detail how you might use Terri Vogel’s
data to answer the following question. “Does Terri Vogel drive faster in races than she
does in practices?”
Use the following information to answer the next two exercises. The Eastern and
Western Major League Soccer conferences have a new Reserve Division that allows
new players to develop their skills. Data for a randomly picked date showed the
following annual goals.
Western
Eastern
Los Angeles 9
D.C. United 9
FC Dallas 3
Chicago 8
Chivas USA 4
Columbus 7
Real Salt Lake 3 New England 6
Colorado 4
MetroStars 5
San Jose 4
Kansas City 3
Conduct a hypothesis test to answer the next two exercises.
The exact distribution for the hypothesis test is:
1. the normal distribution
19/21
Two Population Means with Unknown Standard Deviations
2. the Student's t-distribution
3. the uniform distribution
4. the exponential distribution
If the level of significance is 0.05, the conclusion is:
1. There is sufficient evidence to conclude that the W Division teams score fewer
goals, on average, than the E teams
2. There is insufficient evidence to conclude that the W Division teams score
more goals, on average, than the E teams.
3. There is insufficient evidence to conclude that the W teams score fewer goals,
on average, than the E teams score.
4. Unable to determine
c
Suppose a statistics instructor believes that there is no significant difference between
the mean class scores of statistics day students on Exam 2 and statistics night students
on Exam 2. She takes random samples from each of the populations. The mean and
standard deviation for 35 statistics day students were 75.86 and 16.91. The mean and
standard deviation for 37 statistics night students were 75.41 and 19.73. The “day”
subscript refers to the statistics day students. The “night” subscript refers to the statistics
night students. A concluding statement is:
1. There is sufficient evidence to conclude that statistics night students' mean on
Exam 2 is better than the statistics day students' mean on Exam 2.
2. There is insufficient evidence to conclude that the statistics day students' mean
on Exam 2 is better than the statistics night students' mean on Exam 2.
3. There is insufficient evidence to conclude that there is a significant difference
between the means of the statistics day students and night students on Exam 2.
4. There is sufficient evidence to conclude that there is a significant difference
between the means of the statistics day students and night students on Exam 2.
Researchers interviewed street prostitutes in Canada and the United States. The mean
age of the 100 Canadian prostitutes upon entering prostitution was 18 with a standard
deviation of six. The mean age of the 130 United States prostitutes upon entering
prostitution was 20 with a standard deviation of eight. Is the mean age of entering
prostitution in Canada lower than the mean age in the United States? Test at a 1%
significance level.
Test: two independent sample means, population standard deviations unknown.
Random variable:
20/21
Two Population Means with Unknown Standard Deviations
¯ ¯
X1 − X2
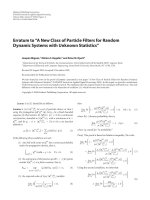
Distribution: H0: μ1 = μ2 Ha: μ1 < μ2 The mean age of entering prostitution in Canada is
lower than the mean age in the United States.
Graph: left-tailed
p-value : 0.0151
Decision: Do not reject H0.
Conclusion: At the 1% level of significance, from the sample data, there is not sufficient
evidence to conclude that the mean age of entering prostitution in Canada is lower than
the mean age in the United States.
A powder diet is tested on 49 people, and a liquid diet is tested on 36 different people. Of
interest is whether the liquid diet yields a higher mean weight loss than the powder diet.
The powder diet group had a mean weight loss of 42 pounds with a standard deviation
of 12 pounds. The liquid diet group had a mean weight loss of 45 pounds with a standard
deviation of 14 pounds.
Suppose a statistics instructor believes that there is no significant difference between
the mean class scores of statistics day students on Exam 2 and statistics night students
on Exam 2. She takes random samples from each of the populations. The mean and
standard deviation for 35 statistics day students were 75.86 and 16.91, respectively. The
mean and standard deviation for 37 statistics night students were 75.41 and 19.73. The
“day” subscript refers to the statistics day students. The “night” subscript refers to the
statistics night students. An appropriate alternative hypothesis for the hypothesis test is:
1.
2.
3.
4.
μday > μnight
μday < μnight
μday = μnight
μday ≠ μnight
d
21/21