A STUDY OF EXCHANGE RATE PASS-THROUGH IN VIETNAM DURING PERIOD 2000-2010
Bạn đang xem bản rút gọn của tài liệu. Xem và tải ngay bản đầy đủ của tài liệu tại đây (478.22 KB, 44 trang )
NATIONAL ECONOMICS UNIVERSITY
ERASMUS UNIVERSITY ROTTERDAM
INSTITUTE OF PUBLIC POLICY AND MANAGEMENT
INTERNATIONAL INSTITUTE OF SOCIAL STUDIES
VIETNAM-NETHERLANDS MASTER’S PROGRAM
IN DEVELOPMENT ECONOMICS (MDE)
THESIS
A STUDY OF EXCHANGE RATE PASS-THROUGH IN VIETNAM
DURING PERIOD 2000-2010
Supervisor
Student
: Dr. Nguyen Phi Lan
: NGO THI HIEN, MDE 18
A thesis submitted for the Master Degree in Development Economics
at the Institute of Public Policy and Management (IPPM)
of National Economics University, Vietnam
Hanoi - 2015
ACKNOWLEDGEMENTS
Firstly, I sincerely thank Dr. Nguyen Phi Lan, my thesis advisor, for guiding
and helping me complete this thesis.
My thanks also go out to all lecturers of The Vietnam – Netherlands Master’s
Program in Development Economics for all the knowledge, devotion and hard work.
I am very thankful to have my family’s and my friends’ constant support
throughout my life and particularly during this program.
Finally, I dedicate this thesis to my father and my beloved children.
Hanoi, thang ……nam ……
Tác giả
Ngo Thi Hien
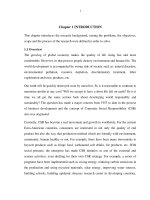
ABSTRACTS
This research investigates the effect of exchange rate pass-through on domestic
prices and import prices in Viet Nam basing on data from 2000 to 2010. This study
applied to a Vector error correction model (VECM), suggested by Johansen (1990).
Using Impulse response function and variance decomposition to estimate exchange
rate pass-through to domestic prices and import prices. The major findings of this
paper are: 1) the effect of exchange rate shock on CPI and import prices are
significant in the long run; 2) in the short run, when exchange rate changes, its
impacts will move to CPI after 2-3 quarters, as well as, the impact of exchange rate
shock to import price has existed in Viet Nam.
TABLE OF CONTENTS
CHAPTER 1......................................................................................................................................................................1
INTRODUCTION...............................................................................................................................................................1
1.1.Problem statement...................................................................................................................................................1
1.3.Research methods and data.....................................................................................................................................2
1.4.Scope and limitations...............................................................................................................................................2
1.5.Expected outcomes of the thesis..............................................................................................................................3
1.6.Structure of the thesis...............................................................................................................................................3
CHAPTER 2......................................................................................................................................................................4
LITERATURE REVIEW.......................................................................................................................................................4
2.1.Theoretical background............................................................................................................................................4
2.2.Empirical study review..............................................................................................................................................6
CHAPTER 3....................................................................................................................................................................10
OVERVIEW ABOUT REGIMES OF EXCHANGE RATE IN VIET NAM.................................................................................10
3.1.Legal frameworks...................................................................................................................................................10
3.2. Exchange rate management policies.....................................................................................................................10
CHAPTER 4....................................................................................................................................................................20
EMPIRICAL STUDY.........................................................................................................................................................20
4.2. Unit root and cointegration tests..........................................................................................................................22
4.3Estimated results.....................................................................................................................................................30
4.5. Variance Decomposition analysis..........................................................................................................................36
Results of Variance decomposition, which show the contribution of innovation in the exchange rate to the
variability of both CPI and Import Prices, are presented in Table 4.9........................................................................36
POLICY RECOMMENDATIONS AND CONCLUDING REMARKS.......................................................................................38
APPENDIX 1. THE RESERVE OF FOREIGN CURRENCY OF VIET NAM............................................................................42
APPENDIX 2. VAR LAG ORDER CRITERIA......................................................................................................................42
......................................................................................................................................................................................42
APPENDIX 3. VEC RESIDUAL SERIAL CORRELATION LM TEST.......................................................................................43
LIST OF ABBREVIATIONS
VAR
VECM
ER
IMF
IFS
GDP
ERPT
M2
CPI
BIDV
BFTV
SBV
WTO
CPI
USD
VND
Vector Autoregressive model
Vector Error Correction Model
Exchange rate
International Monetary Fund
International Financial Statistics
Gross Domestic Product
Exchange rate Pass-Through
Money supply
International Monetary Fund
Bank for Investment and Development of Viet Nam
Joint stock commercial Bank for Foreign Trade of Viet Nam
State Bank of Viet Nam
World Trade Organization
Consumer Price Index of Viet Nam
United States Dollar
Vietnamese Dong
LIST OF FIGURES
CHAPTER 1......................................................................................................................................................................1
INTRODUCTION...............................................................................................................................................................1
1.1.Problem statement...................................................................................................................................................1
1.3.Research methods and data.....................................................................................................................................2
1.4.Scope and limitations...............................................................................................................................................2
1.5.Expected outcomes of the thesis..............................................................................................................................3
1.6.Structure of the thesis...............................................................................................................................................3
CHAPTER 2......................................................................................................................................................................4
LITERATURE REVIEW.......................................................................................................................................................4
2.1.Theoretical background............................................................................................................................................4
2.2.Empirical study review..............................................................................................................................................6
CHAPTER 3....................................................................................................................................................................10
OVERVIEW ABOUT REGIMES OF EXCHANGE RATE IN VIET NAM.................................................................................10
3.1.Legal frameworks...................................................................................................................................................10
3.2. Exchange rate management policies.....................................................................................................................10
CHAPTER 4....................................................................................................................................................................20
EMPIRICAL STUDY.........................................................................................................................................................20
4.2. Unit root and cointegration tests..........................................................................................................................22
4.3Estimated results.....................................................................................................................................................30
4.5. Variance Decomposition analysis..........................................................................................................................36
Results of Variance decomposition, which show the contribution of innovation in the exchange rate to the
variability of both CPI and Import Prices, are presented in Table 4.9........................................................................36
POLICY RECOMMENDATIONS AND CONCLUDING REMARKS.......................................................................................38
APPENDIX 1. THE RESERVE OF FOREIGN CURRENCY OF VIET NAM............................................................................42
APPENDIX 2. VAR LAG ORDER CRITERIA......................................................................................................................42
......................................................................................................................................................................................42
APPENDIX 3. VEC RESIDUAL SERIAL CORRELATION LM TEST.......................................................................................43
LIST OF TABLES
Table 4. 1:
Table 4. 2 :
Table 4. 3:
Table 4. 4:
Table 4. 5
Table 4. 6
Table 4. 7
Table 4. 8
Table 4.9
Variables definition and data sources Error: Reference source not
found
ADF Unit Root Test Results. . .Error: Reference source not found
Johansen Maximum Likelihood Co-integration.Error: Reference
source not found
Johansen Maximum Likelihood Co-integration..Error: Reference
source not found
Results of estimation ERPT into CPI in the long run...........Error:
Reference source not found
Results of estimation ERPT into CPI in the short run..........Error:
Reference source not found
Results of estimation ERPT into Import Prices in the long run
...................................................Error: Reference source not found
Results of estimation ERPT into Import Prices in the short run
...................................................Error: Reference source not found
Variance decomposition of CPI and Import Prices...............Error:
Reference source not found
CHAPTER 1
INTRODUCTION
1.1.
Problem statement
Prices of consumer goods have many problems that interest many
economists. Prices of consumer goods are affected by many factors such as
GDP, import price of goods, money supply, exchange rate, trade policy,
psychological factors or behavior of consumers. There are many studies
investigating the effects of factors on prices of consumer goods in the world.
In facts, the main factors affecting domestic prices are the weakness of
manufacturing and agriculture, rapid population growth, the shocks of energy
prices, fluctuation of exchange rate and monetary policies. These factors have
been existed in the Vietnam’s economy and been studied broadly. However, one
of the important factors that have been rarely researched is the ERPT and its
impacts on the import prices. Therefore, it is necessary to study the effects of
ERPT on import price and CPI in Viet Nam.
In this research, the author will investigate the impacts of exchange rate
pass-through in Viet Nam to domestic prices in order to show “how domestic
prices will change when exchange rate changes by one percent” and “how PTE
will play the leading role in estimating its impacts on domestic prices”.
1.2.
The objectives of the thesis
1.2.1. Objectives
Fredric S. Mishkin (2010) showed that exchange rate plays an important
role in an open economy. Adjustments of exchange rate will affect the inflation
and domestic prices. Studies about how the exchange rate impacts domestic
price in other economies give us other results. In developed countries, this effect
is less substantial than it is in developing countries because the developing
countries with open economies will be affected more significantly by external
shocks. The fluctuation of exchange rate, therefore, surely influences local
prices in developing countries (Pavlo B., 2010).
In Viet Nam, there are not many studies about this factor and their results
are not satisfactory (e.g Vo Van Minh, 2009; Tran Mai Anh and Nguyen Dinh
Minh Anh, 2010). Nhat Trung and Nguyen Hong Nga (2012) showed that Viet
Nam, as a developing country with an open economy, theoretically should have
a substantial effect of exchange rate on domestic prices. However, it contradicts
with the previous studies which conclude the opposite. Hence, the objectives of
this thesis are 1) to examine to see whether the theory is correct with Viet Nam
case, and 2) to investigate exchange rate’s impacts in the short and long run.
1
1.2.2. Research questions
(1) How did exchange rate pass-through in Viet Nam affect
domestic prices?
(2) How did exchange rate pass-through in Viet Nam affect import
prices?
1.3. Research methods and data
1.3.1. Methodology
The vector autoregressive (VAR) model is a general framework used to
describe the dynamic interrelationship among stationary variables. Recently,
economic researchers usually use VAR to investigate time series. For VAR
model, the variables are dependent and they are series. Firstly, I will test the
stationary variables using Augmented Dickey-Fuller test (ADF) and choosing
length of lags. When variable is stationary at the length of lag, we join variable
into model. Some standards are commonly used:
Akaike information criterion (AIC)
Hannan-Quinn criterion (HQC)
Schwarz criterion (SIC)
In fact, VECM is just a special case of the VAR for variables that are
stationary in their differences. It can take into account any co-integration
relationships among the variables.
The VECM can give the long run relationships and the short run
relationships of non-stationary variables and VECM can be applied with many
different types of time series variables and dates. (Phan Thi Hong Thao, 2012)
1.3.2. Data source
The research will use monthly dataset in the period 2000-2010, which is
collected from General Statistic Office (GSO), International Monetary Fund
(IMF), Asia Development Bank (ADB) with VECM methodology and the
model to measure ERPT effect in CPI and import price, in both the short and
long run.
1.4. Scope and limitations
By the year of 1986, Viet Nam started with “Doi Moi” policy, which made
the definition of exchange rate became more popular. In recent years, the
influence of exchange rate’s fluctuation on traded goods and non-traded goods
have increased. Moreover, in an open economy, these influences could be
profoundly vulnerable to external shocks.
With the limitations of data sources, statistic errors and limitations of time,
this thesis covers ERPT in Viet Nam that affects CPI and import price, in the
short and long run only.
2
1.5. Expected outcomes of the thesis
Over the last three decades, transmission mechanisms of the pass-through
exchange rate to local prices have been emerged as a subject for academic
research for various countries, industries, products. Those studies from Knetter
(1989), Campa and Goldberg (2002), Goldberg and Knetter(1997), Licui, Chang
Shu and Jian Chang (2009) mainly focus on cases of developed countries such
as the United States, European area, Japan, and other OECD countries. Only a
few studies investigate ERPT of developing countries such as Nusrate Aziz
(2009), Takagi and Yoshida (2001) or Parsons and Sato (2006). In Viet Nam,
there are a few empirical studies such as Nguyen Cam Nhung (2010), Vo Van
Minh (2009) and Tran Mai Anh- Nguyen Dinh Minh Anh (2010).
However, as mentioned above, the results collected from estimating
equations are different. Usually, the ERPT’s impact in developed countries is
lower than that in developing countries (suggested by Nhat Trung and Nguyen
Hong Nga (2012). In Viet Nam, some previous studies show that the effect of
ERPT on CPI is small (Vo Van Minh 2009; and Tran Mai Anh- Nguyen Dinh
Minh Anh 2010). It seems illogical for a developing country like Viet Nam.
1.6.
Structure of the thesis
The structure of the thesis is as follows:
Chapter 1: Introduction
Chapter 2: Literature review
This chapter will provide theoretical background and review some studies
about exchange rate pass-through in Viet Nam and other countries with
empirical findings.
Chapter 3: Overview about regimes of exchange rate in Viet Nam
This chapter will present about exchange rate regimes in Viet Nam from
before 1989 to present. Besides, this chapter discusses about the import, export,
CPI, money supply and GDP of Viet Nam upon each exchange rate regimes.
Chapter 4: Empirical study
This chapter explains the data, methodology and the model. Also, this
chapter provides empirical results and analysis
Chapter 5: Policy recommendations and concluding remarks
This chapter summarizes the main findings of the thesis and give policy
recommendations based on what the thesis found.
3
CHAPTER 2
LITERATURE REVIEW
2.1. Theoretical background
2.1.1. Integrated markets
In order to investigate ERPT, we will start with the relationship between
exchange rate and domestic price/import price. A partial ERPT means the
transmittance from percentage change of exchange rate to domestic price and
import price is not full. A full ERPT means the whole percentage change of
exchange rate is transmitted to domestic price and import price.
In order to answer the research questions, let’s start with the following
fundamental model- the Law of One Price exchange rate theory (Pavlov 2010,
p11):
Pi = EPi*,
(1)
Where:
P - The local currency of country A
P* - The local currency of country B
E - Exchange rate of A’s currency per unit of B’s
i - The ith goods
In the above equation, we use the law of one price for international goods.
According to this law, all goods must have only one price and in common
currency. This law also assumes profit maximization, no cost for transportation,
distribution and resale. Markets are fully integrated. There is full pass-through.
When the law of one price for all traded goods and preferences are same in
other countries absolute PPP held. In fact, transportation and distribution costs
always exist in the gap between domestic and foreign prices. In case
transportation and distribution cost are constant, prices grow at the same rate,
that means relative PPP would hold, and exchange rate pass-through is
complete.
However, in fact, when comparing prices between two countries,
economists usually use the definition of PPP (Herzberg V., Kapetanios G. and
Price S. (2003). If the price levels in one country increase by a number of
percent, the exchange rate in this country must decrease by the same percentage
and vice versa. In this case, we can guess the pass-through is complete.
In order to keep PPP of a country, save prices and exchange rate should be
changed. For example, if the price levels increase by a number of percent, then
the exchange rate in this country must decrease by the same figure of percent
and vice versa (to keep PPP unchanged). In this case, the pass-through is
complete.
4
In open economies, changes in exchange rates affect producing costs.
Herzberg V., Kapetanios G. and Price S. (2003), Nhat Trung and Nguyen Hong
Nga (2012), Pavlov B. (2010) who show that when the importing country was
large enough, then after exchange rate shock, the prices changed. This means, in
spite of integrated market, the exchange rate pass-through could be incomplete.
It is opposed to theoretic which showed that when the importing country was
large, the exchange rate pass-through is complete.
Also, Nhat Trung and Nguyen Hong Nga (2012) showed that changes of
exchange rate effect on domestic through direct channel and indirect channel:
Devaluation of domestic currency
↓
↓
Direct channel
Indirect channel
↓
↓
↓
↓
Prices of
Prices of
Demand for
Prices of
imported goods imported materials
exported goods
substitute
goods
increases
increases
increases
increase
↓
↓
↓
↓
Prices of consumer goods increase
In the research of Vo Van Minh (2009) who based on the Law of One Price
exchange rate theory to show the equation as follows:
Phm = (1-α) e + (1-α) C fx + α Ph + β y. (2)
Where:
e - Exchange rate
C fx - Marginal cost of production of foreign firm
Ph - The home country price level
y - Market demand
Vo Van Minh has shown that when α = 1, ERPT is full, when α = 0 ERPT
is zero and ERPT is not full at 0< α<1.
Besides, there are many studies that approached specific models and
estimated the effect of relaxation assumptions in developing countries such as
Parsley (1998), Krugman (1978), Hung, Kim and Ohno (1993), etc.
2.1.2. Market segmentation and pricing to market
Bergin and Feenstra (2001) show in general equilibrium models that
preferences are same and demand elasticity is unchanged due to shock of
exchange rate, even in segmented markets. However, imperfect competition and
market segmentation are still insufficient to explain a persistent lack of passthrough. Valerie Herzberg, George Kapetanios and Simon Price (2003, p.11)
5
also comment that final ‘imported’ goods can be thought of as a product
produced with the aid of an intermediate good, imports. Distribution costs are a
large part of the final good. Import cost changes can lead to changes in the
elasticity of demand, where there is an incomplete pass-through in the long run.
2.2.
Empirical study review
There are many studies about ERPT’s effect on import price, CPI, etc.
Most of ERPT empirical studies were done on developed countries. Some of
them are in NIC countries such as Rossi (2002) investigating Turkey, Rabanal
and Schwartz (2001) on Brazil, Peter Rowland on Colombia as well as some
other developing countries. All researches about ERPT, however, could be
classified in three groups:
•The first group includes papers concentrateing on the effects of ERPT on
import prices for material goods for manufacturing such as:
Isard (1977) investigated how exchange rate fluctuation affected
industrial products and found that about 30 percent of exchange rate passthrough to the prices of industrial products. In this study, Isard assumed
perfect substitution between foreign products and domestic products,
homogenous goods and no transportation cost as well as trade barriers. Woo
(1984) studied ERPT’s impact on inflation of the United States. The author
expressed the results of ERPT through four channels, which were: imported
consumer goods, imported inputs, demand and foreign prices.
Some other authors researched ERPT to producer price in the U.S. such as
Phillips (1988), Feinberg (1986) or Hooper (1989). They showed that about 5060% change of nominal ER transferred to prices of produced imports.
•The second group includes economists discussing the effects of ERPT on
general import prices, namely, Hooper and Mann (1989), Campa and Goldberg
(2002), Karim Burhoumi (2005), using the sample of 24 developing countries in
the period 1980-2003, data source from IFS, investigated the differences in how
the long-run ERPT affected import prices in developing countries. He found out
that countries with fixed exchange rate, lower tariff barriers and higher inflation
regimes exhibited a higher long-run ERPT into import prices than countries with
higher tariff barriers, floating exchange rate (ER) and lower inflation regimes.
Nusrate Aziz (2009) investigated the ERPT to import, export and domestic
prices using annual and quarterly data of Bangladesh. The study used VAR
technique to show that ER devaluation of domestic prices was positive and
larger in the long-run than that in the short-run. The study also showed that if
ERPT was one-to-one, it was considered “complete ERPT” and if it was less
6
than one, it was “partial ERPT”. The data sources, used in this study, was from
Bangladesh bureau of statistics and its model was as follows:
Pjtm = Et * Pjtx
Where: Et is defined as the ER and the import prices of a country j (Pjtm) is
a transformation of the export prices of its trading partners Pjtx.
The findings: ERPT to import prices is positive and significant, to export is
negative and significant, to consumer and producer prices are also significant.
Recently, in some countries of ASEAN such as Indonesia, the Philippines,
Singapore or Thailand, some researchers have estimated much higher exchange
rate pass-through into import prices not CPI. Sahminan (2005) investigated the
exchange rate pass-through in import prices in Indonesia, the Philippines,
Singapore and Thailand during period 1974- 2000 and he found that there
existed ERPT into import prices and this ERPT was almost full.
Viet Nam is a member of ASEAN. Hence, it is reasonable to expect equal
levels of exchange rate pass-through into CPI and import prices. We will explain
these assumptions in the following sections.
•The third group includes papers about the effects of ERPT on CPI
(consumer price index) and PPI (producer price index) such as McCarthy
(2000), Papell (1994), Kim (1998) and Heng (1999). Mishkin (1998) shows that
exchange rate may be affected by monetary policies. Also, the exchange rate
impacts CPI and import price even if floating exchange rate policy is applied.
The studies of Leigh and Rossi (2000) and Rabanal and Schwartz (2001)
provide stronger evidence for the impacts of ERPT on PPI than for its impact on
CPI. Alba and Papell (1998) expected the exchange rate pass-through into the
CPI of Malaysia, the Philippines and Singapore are 0.090, 0.165 and -0.082,
respectively. However, Calvo and Reinhart (2000) used monthly data of
Indonesia and Malaysia to investigate the exchange rate pass-through into the
CPI and gave rates of 0.062 and 0.020, respectively. Bergin and Feenstra (2001),
Corsetti and Dedola (2001) showed that ERPT was incomplete for imperfectly
competitive markets. That meant in markets that have price discrimination, the
ER would impact imports price not as much as predicted because manufacturers
could replace foreign inputs with local inputs. Bandura Pavlo (2010) researched
the exchange rate pass-through in Ukraine. The main hypothesis that was tested
is if there is a significant effect of exchange rate on domestic prices of tradable
goods and non-tradable goods, producer goods and services in Ukraine. The
author used monthly series data of Ukrainian interbank exchange rate in the
period 1995-2009 to estimate PTE. The choice of model was VAR and VECM
(Vector Error Correction Model). The author wanted to discriminate between
VAR and VECM based on the existence of the long-run relationship. Milton
7
Friedman (1953) showed that, in floating exchange rate, increasing exchange
rate would make price of foreign products cheaper than if calculated in domestic
currency, and vice versa, the price of domestic products would be more
expensive than if calculated in foreign currency. As a result, this would lead to
increase in import and decrease in export. In his study, Milton Friedman
assumed that the prices of goods in foreign currency of manufacturers remained
constant, and high ERPT still existed at one hundred percent. Decreasing
exchange rate (devaluation of domestic currency) would increase CPI. Peter
Rowland (2003) studied ERPT to import, producer and consumer prices in
Colombia. The study was based on VAR models and aimed to quantify the
impact and dynamic of the ER on domestic prices in Colombia completely. The
study used monthly data from 01/1983 to 10/2002 and nominal ER USD/COP to
study its effect on the different stages of import, producer and consumer prices.
He found out that the import prices would be affected rapidly when ER changed
(as much as 80%) while producer and consumer prices would respond slowly.
In Viet Nam, Vo Van Minh (2009) with “Exchange rate pass-through and
its implications for inflations in Viet Nam” showed the relationship between
inflation persistence and ERPT and relationship between level of volatility of
inflation and ERPT. He estimated the impact of ERPT to inflation, and then,
gave appropriate recommendations. In addition, he used VAR method to
estimate ERPT and dataset from 2001 to 2007. The elasticity of import prices in
the first year average was 0.61 (meaning 61 percentage change of ER was
transferred to import prices), and ERPT average to CPI was 0.08. Besides, Tran
Mai Anh and Nguyen Dinh Minh Anh (2010) with “Estimating the exchange
rate pass-through into inflation in Viet Nam” also used VAR method. They
concluded that the average ERPT to import prices and CPI were 0.13 and 0.065,
respectively.
However, all the results considered are lower than the results of developing
economies and new economies.
Nguyen Cam Nhung (2010) with “exchange rate pass-through into Viet
Nam’s imports: empirical evidence from Japanese trade data” conducted narrow
study on the case of trade with Japan. She used the OLS regression to estimate
ERPT from the exporter’s side. By using the generic regression model such as
Goldberg and Knitter (1997) and Camp and Goldberg (2002) and the HS-9-digit
level commodity data, the author found that ERPT was high for machinery
products in Japanese exports to Viet Nam where US dollar invoicing was not
dominant. In contrast, ERPT was low for electronics products of Japanese
exporters to Viet Nam importers where US dollar invoicing was dominant. The
vehicles industry was low pass-through.
8
In general, there are a few studies to be found in Viet Nam and the results
of researches are yet satisfactory because Viet Nam is a dynamic economy and it
is affected by a broad range factors.
Therefore, this study will use date set from 2000 to 2010 to estimate the
effects of ERPT on domestic prices and import prices (Import prices are for
materials used in manufacturing product). In order to investigate more
comprehensively about impact of ERPT into CPI and Import price as well as the
effect of it in the short and long run, the author will use VAR and VECM to
estimate results of the models.
9
CHAPTER 3
OVERVIEW ABOUT REGIMES OF EXCHANGE RATE IN VIET NAM
3.1. Legal frameworks
Before the year of 1986, Viet Nam economy was still a centrally planned
economy (Nguyen Quang Ngoc, 2006). In which, the economy operated
accordingly to government's directions and its ER regime was multi-ER. In this
period, there were 03 official exchange rates provided by the government and
non-official market-based ER, which existed alongside the official ones. Hence,
official ERs couldn't reflect the value of the country's currency as well as
economic conditions (Nguyen Thi Thu Hang et al. (2010).
Prior to 1989, Vietnamese financial system was provided for by a monobanking system (Nguyen Van Dinh 2010), which was controlled by the State
Bank of Vietnam (SBV). SBV directed all lending activities with credit quoting
for each entity. Besides, there were also two special banks to finance for
infrastructure. The Bank of Investment and Development of Viet Nam (BIDVsince 1958) were responsible for public works, infrastructure projects and
equipment for SOEs. The Bank of Foreign Trade of Viet Nam (BFTV-since
1963) financed for foreign trade and foreign exchange rate transactions (World
Bank 1991).
With Decree no.53/ND in 1988 by the Government, the mono-banking
system was stopped and replaced by a two-tier banking system. SBV has
become the Central Bank and there were four state-owned commercial banks.
3.2. Exchange rate management policies
The management of exchange rate in controlling inflation, stabling
macroeconomic and balance of payment (BOP), has important roles in Viet
Nam's economy. Viet Nam has given much more adjustments to ER since
1989. However, all of the adjustment was around the peg ER. USD is fixed as
a peg currency in Viet Nam, as SBV always announces exchange rate of
VND/USD. Base on international exchange rate between USD and other
foreign currencies, commercial banks build exchange rate between that foreign
currencies and VND.
In addition of reporting ER of VND/USD daily, SBV also helps the
government manage monetary policies and foreign currencies (decree no.53HDBT dated 26/03/1988). According to Ordinance no. 28/2005/UBTVQH11 of
the Standing Committee of the National Assembly - Ordinance on Foreign
Exchange Management: "Socialist Republic of Viet Nam implemented foreign
exchange management policy to create favorable conditions and ensure the
legitimate interests for organizations and individuals engaged in foreign
10
exchange, contribute economic development, implemented objectives of the
policies of national currency, improve the conversion of Viet Nam dong, carry
out purpose on the territory of Viet Nam using only the Viet Nam dong, carry
out commitments made by the Socialist Republic of Viet Nam in the process of
international economic integration, enhance the effectiveness of state
management of foreign exchange and improve foreign exchange management
system of Viet Nam."
The Exchange rate movement in Vietnam is divided into five stages:
Stage 1: Before 1989
In this stage, the Government makes monopoly of foreign exchange. The
Government gave out three official exchange rates.
Official exchange rate: the first official exchange rate is built between
Vietnam Dong and China Yuan Renminbi. After that, base on exchange rate of
China Yuan Renminbi with other currencies, Viet Nam apply “cross rate”
method to calculate exchange rate with other foreign currencies. An important
exchange rate in this time which is established by “cross rate” is Rup clearing.
Exchange rate for internal Draw the final Balance-sheet: this ER is
used in payments among bank and organs for foreign trade, bank and
national budgets for Aids.
Exchange rate for Overseas national currency exchange: It is established
base on official exchange rate with that foreign currency and plus percent of
stimulation.
"Black-market" exchange rate and official exchange rate existed together.
Because of monopoly of foreign exchange, Vietnam’s economy did not
raise. It showed BOP deficit, high inflation and GDP is almost not valuable. In
the stage, Viet Nam traded mostly with Socialist countries. So, foreign trade did
not develop. Balance of payment (BOP) was usually in deficit in this stage.
Figure 3. 1 Import, Export at constant prices 1994 (billions of dong)
Source: (GSO, 2012)
Figure 3.1 shows BOP deficits of Viet Nam. In 1986, we exported 10,147
billion dongs and imported up to 23,268 billion dongs. Similarly, in 1987, 1988,
and 1989 exports were 11,008 billion dongs, 9,903 billion dongs and 27,602
11
billion dongs, respectively, and imports were 27,364 billion dongs, 25,251
billion dongs and 39,652 billion dong, respectively. In each year from 1986 to
1989, trade deficit always passed 10 thousand billion dong.
In figure 3.2 indicates CPI decreased from 774.7% in 1986 to only 36% at
1989 (source, GSO). On the contrary, money supply increased. It was 112
billion dongs in 1986, but in 1988, it quickly jumped up to 2,569 billion dongs,
reaching 7,419 billion dongs in 1989 (ADB, 2012).
Figure 3. 2 CPI (December of previous year = 100) (unit: percent)
Source: (GSO, 2012)
Figure 3. 3 Money supply (M2) and GDP at constant prices 1994 (billions of dong)
Source: (ADB, 2012 and GSO, 2012)
In this period, GDP increased steadily after each year, from 109,189 billion
dongs in 1986 to 125, 571 in 1989 (GSO, 2012).
In general, in the first period of renovation (1986-1989), we can see a big
difference between policies and applications. Unclear ER, hyperinflation and
trade deficit were the main problems of Viet Nam's economy in this period. Also,
in this stage GDP increased and CPI decreased but we also raised the money
supply (M2). Hence, we could not conclude economic growth in this period.
Stage 2: 1990-1995
In 1989-1990 period, the government fixed ER with crawling bands. The
most important thing in real ER regime is Official Exchange Rate (OER). OER
was adjusted by the State Bank based on signals of inflation, interest rate, BOP
and ER in open market. Commercial banks were allowed to establish their ER
12
within 5% of OER. The use of foreign currencies was wider.
Required reserve ratio was also built in 1988 and has been applied since
1992, in accordance with Resolution no.16/NH-QD.
From 1991 to 1993, the government decided pegs ER within horizontal
bands. The State controlled the use of foreign currencies tightly and forbade
moving money outside. The State established official reserve Funds of
foreign currency to stabilize ER. The State also built 2 floors for foreign
currency in Ho Chi Minh City and Ha Noi city. OER in this period was
decided by biding ER on the 2 floors. SBV used powerful means to control
these 2 floors. Commercial banks were allowed to use ER within bands of
less than 0.5% of OER only. With targets of managing monetary policies,
controlling inflation, steadying the value of VND and boosting economic
growth, SBV managed its monetary supplies to fasten money stabilization.
In the early 1990s, SBV converted the currencies, and the three-digit level
of inflation ended. Recession stopped and the economy steadied, as inflation
was calmed down. The ER was pegged rigidly. In the period, unofficial ER
stabilized and caught up with official ER.
In answer to Government’s effort, the economy’s growth is positive and
ER regime is more flexible. Although Viet Nam still had trade deficit (see
Figure 3.4) in this stage but export raised from 11,084 billion dongs in 1990 to
75,106 billion dongs in 1995 and import raised from 14,960 bill dongs in 1990
to 95,925 bill dongs in 1995 (GSO, 2012). Trade deficit was up to 20,819 bill
dongs in 1995. Even when the government had adjusted its ER policy, value of
VND still reduced compare to the value of USD. Besides the targets of monetary
management and control of inflation (or hyperinflation), SBV also tried to
steady the value of VND. In this period, all credit institutions crashed and the
stabilization of VND was the first way SBV used to keep the expectations of
Vietnamese people.
Figure 3. 4 Imports, Exports at constant prices 1994 (billions of dong)
Source: (GSO, 2012)
Finally, the hyperinflation was ended and CPI was also stabilized. CPI
13
changed from 67.1% in 1990 down to 17, 5% in 1992, and then managed around
10% in the following years. Only in 1993 was CPI 5.2%. (GSO.2012). (see
Figure 3.5)
This time, Viet Nam came of embargo period created by the US. The two
sides signed an agreement on trade. That was one of the reasons for Vietnam's
economic achievements such as controlling inflation, stabilizing the economy,
economic growth and its success in supervising the value of VND.
Figure 3. 5 CPI (December of previous year = 100) (unit: percent)
Source: (GSO, 2012)
Figure 3. 6 Money supply (M2) and GDP at constant prices 1994 (billions of
dong)
Source: (ADB, 2012 and GSO, 2012)
Stage 3: 1996-2000
From 1994 to 1996, the government applied conventional fixed peg
arrangements. ER was set based on activities in the interbank market, instead of
on the above mentioned 2 floors. SBV still used its power to control this market.
OER was created base on interbank ER, and ER of commercial banks could be
found within band of 0.5% OER. By the end of 1996, this band was lifted to 1%
OER level, while OER still stick to 11.100VND/USD.
The period of 1997-1998 observed the Asia financial crisis, which also
affected Vietnam's financial system. The State tried to find ways to prevent
these influences. Pegged exchange rate with crawling bands was applied.
Commercial bank's ER bands varied constantly. It was loosen from +/-1% to
14
+/-5% of OER at the beginning of 1997, and up to +/-10% by the end of
1997. In mid-1998, it was then amend from +/-10% to +/-7%. OER changed
from 11.800VND/USD to 12.998VND/USD.
From 1999 to 2000, the government gave out conventional fixed peg
arrangements. OER on one certain day was the average of interbank ERs on
the previous working day. ER bands of commercial banks decreased to 0.1%
of OER.
This is difficult stage for policy makers, in five years only but exchange
rate changes five times. Vietnam’s economy is really unsteady in this time. The
reason makes instability as the Southeast Asian Financial Crisis.
The crisis has impacted on imports and exports of Viet Nam. It threatened
the devaluation of domestic currency and inflation. The growth rate in 1998
decreased to 5.8% compare with 8.8% in 1997. The SBV carried out monetary
policies toward stabilizing the value of domestic currency and controlling
foreign exchange rate. As the results of these goals, money supply was 19% and
bad debt rate decreased by 5%.
In this period, the GDP grew from 213.833 billion dongs in 1996 to
273.666 billion dongs in 2000. Export index indexed were also steady, around
100 percent (more or less 5 percent) (GSO, 2012).
Money supply also rises from 64.678 billion dongs in year of 1996
to 222.882 billion dongs in year of 2000. (ABD, 2012)
Figure 3. 7 Money supply (M2) and GDP at constant prices 1994 (billions of dong)
Source: (ADB, 2012 and GSO, 2012)
Opposite to steadily increased GDP, Imports, Exports and M2 levels, CPI
of this stage experienced a huge change. It began at 4.5% in 1996, was top 9.2%
in 1998 but fell down 0.1% in 1999 and -0.6% in 2000 (GSO, 2012).
Figures 3.7, 3.8 and 3.9 show GDP, Import, Export, Money supply and CPI
changes in this stage. (GSO.2012 and ADB.2012)
Figure 3. 8 Import, Export at constant prices 1994 (billions of dong)
15
Source: (GSO, 2012)
Figure 3. 9 CPI (December of previous year = 100) (unit: percent)
Source: (GSO.2012)
Stage 4: 2001-2005
Pegged ER with crawling peg is submitted by the government. OER is
picked up from 14.000VND/USD to 16.100VND/USD. ER band of
commercial banks is lifted to +/_0.25% at the end of 2006 and lifted to
+/_0.5% in 2007 year.
In this stage, the Government planned for 10 years for economic growth,
stabling macroeconomic, controlling inflation, helping production and
consumption, encouraging investment., Money supply also increased from
222,882 billion dongs in 2000 to 2,789,184 billion dongs in 2010 (ADB,2012).
GDP stayed at constant 1994 price level, from 273,666 billion dongs in 1996 up
to 551,609 billion dongs. (GSO.2012)
The notable event in this period is Viet Nam joined to the World Trade
Organization, which helped Viet Nam's economy develop (maximum GDP
reached 8% in 2006). Meanwhile CPI decreased in comparison with economic
growth. (World Bank.2012)
Figure 3. 10 Import, Export at constant prices 1994 (billions of dong)
16
Source: (GSO.2012)
Figure 3. 11 CPI (December of previous year = 100) (unit: percent)
Source: (GSO, 2012)
Figure 3. 12 Money supply (M2) and GDP at constant prices 1994 (billions of
dong)
Source: (ADB, 2012 and GSO, 2012)
In 2005, monetary policy management was complied with approved goals
and objectives. Exchange rate this time was managed flexibly, which helped
export increase without impeding import. The SBV occurred to stabilize
exchange rates and to facilitate international settlements. The stable exchange
rate had a big impact on investor’s expectations, which help to stop the
exchange from VND to foreign currencies. Also in 2005, the stabilization of
exchange rates with depreciation of VND by 0.86 percent, and the economic
development complied with monetary policies. Stable exchange rate gave the
monetary market stability and put an end to the mass exchange of VND to
foreign currencies in the condition of high inflation.
17
Stage 5: 2006-2012
This time, the government offered pegged ER with crawling bands. OER
was amended 06 times. After amendment number 6, OER increased from
16.100VND/USD at beginning of 2008 to 20.693VND/USD at the beginning of
2011. ER bands of commercial banks were also adjusted to +/-0.75% and to +/3% at the beginning of 2008 and 2011, respectively. Then, they have been
narrowed down to +/-1% since February, 2011.
This time, the government offered pegged ER with crawling bands. OER
was amended 06 times. After amendment number 6, OER increased from
16.100VND/USD at beginning of 2008 to 20.693VND/USD at the start of 2011.
ER bands of commercial banks also were adjusted up to +/_0.75% and +/_3% at
the start of 2008 and 2011, respectively. Then, they have been narrowed to
+/_1% since February, 2011.
Figure 3. 13 Import, Export at constant prices 1994 (billions of dong)
Source: (GSO.2012)
Figure 3. 14 CPI (December of previous year = 100) (unit: percent)
Source: (GSO, 2012)
Figure 3. 15 Money supply (M2) and GDP at constant prices 1994 (billions of dong)
18