Market development strategy for chien thang garment JSC
Bạn đang xem bản rút gọn của tài liệu. Xem và tải ngay bản đầy đủ của tài liệu tại đây (981.96 KB, 77 trang )
G
SUBJECT
MARKET DEVELOPMENT STRATEGY
FOR
CHIEN THANG GARMENT JOINT STOCK
COMPANY
TABLE OF CONTENT
General introduction................................................................................... 8
Reason for the Subject ......................................................................................... 8
Target of project study ......................................................................................... 9
Analytical method ................................................................................................. 9
Structure of the composition: ............................................................................ 10
Chapter 1: Basis of argument for market development strategy in
company’s Marketing activities. .............................................................. 11
1.1 Market strategy of the company. ................................................................ 11
1.1.1 Market Development Strategy................................................................. 11
1.1.2 Suggestions for developing new market. ................................................ 13
1.2 Market Analysis Tools ................................................................................. 14
1.2.1 SWOT Analysis ....................................................................................... 14
1.2.2 Porter’s Five Forces Analysis .................................................................. 16
1.3 Analysis of US Market - one of the key markets for Vietnamese garment
companies. ........................................................................................................... 19
1.3.1 Outcome of textile and garment industry’s export to America since
Vietnam’s accession to the WTO. .................................................................... 19
1.3.2 US’ Policy for textile product import control during Obama’s
government ....................................................................................................... 21
1.3.3 Particular traits of textile sales in US Market.......................................... 22
1.3.4 US Distribution System. .......................................................................... 25
1.3.5 US’ Legal system for imported garment products. ................................. 26
1.4 Analysis of Chigamex’s Business Environment in Vietnam. .................... 30
3
1.4.1 General introduction of Vietnamese textile industry .............................. 30
1.4.2 Opportunities and challenges from Vietnamese textile industry ............ 32
Chapter 2: Overview on developing market of Chien Thang Garment
Company .................................................................................................... 35
2.1 Introduction of Chien Thang Garment Company .................................... 35
2.1.1 History of development ........................................................................... 35
2.1.2 Vision ...................................................................................................... 37
2.1.3 Mission .................................................................................................... 37
2.1.4 Target of consumption development until 2015...................................... 37
2.2 Business and Production activities of Chigamex. ...................................... 38
2.3 Chigamex’s business result .......................................................................... 39
2.3.1 Domestic market ...................................................................................... 40
2.3.2 Export market .......................................................................................... 40
2.4 Analysis of internal factors related to Chigamex’s sales activities for
garment products. ............................................................................................... 43
2.4.1 Structure Organization............................................................................. 43
2.4.2 Human Resource ..................................................................................... 46
2.4.3 Customer relation .................................................................................... 47
2.4.4 Input Material .......................................................................................... 48
2.4.5 Quality control System ............................................................................ 52
2.4.6 Technology and production ..................................................................... 53
2.4.7 Information Technology .......................................................................... 56
2.4.8 Marketing ................................................................................................ 57
2.5 Competitors comparison .............................................................................. 57
4
2.6 Market development activities .................................................................... 61
2.6.1 Domestic market ...................................................................................... 61
2.6.2 US market and Export sales activities of Chigamex ............................... 61
2.6.2.1 Target of export sales activities to US market of Chigamex............ 61
2.6.2.2 Result of Chigamex’s garment product sales in US ......................... 62
Chapter3: Solutions for Sales development of Chigamex’s garment
product in US market. .............................................................................. 66
3.1 Summarize of Analysis result ...................................................................... 66
3.1.1 Opportunities ........................................................................................... 66
3.1.2 Challenges................................................................................................... 66
3.1.3 Strengths .................................................................................................. 67
3.1.4 Weakness ................................................................................................. 67
3.2 Out standings in export and sales activities of the company in US Market67
3.3 Solutions for sales development in US market. ......................................... 69
Chigamex’s Market Development Strategy ..................................................... 69
References .................................................................................................. 74
Appendices:................................................................................................ 75
5
Table List
Table 1: Total revenue of Vietnam textile and garment insdustry export to US
market ....................................................................................................................... 21
Table 2: HTS Categories .......................................................................................... 28
Table 3: Top five biggest garment companies in Vietnam ...................................... 31
Table 4: Production target until 2015 ....................................................................... 38
Table 5: Chigamex’s Financial Report ..................................................................... 40
Table 6: Chigamex’s product consumption report ................................................... 41
Table 7: Export result ............................................................................................... 42
Table 8: Revenue and export growth in main markets ............................................. 43
Table 9: Human resource structure........................................................................... 47
Table 10: Volume of raw material import ................................................................ 49
Table 11: Value of import material .......................................................................... 50
Table 12: ISO 9000:2000 quality standard set ......................................................... 53
Table 13: Production Result ..................................................................................... 56
Table 14: Summary characteristic of some competitors .......................................... 58
Table 15: Competitor’s price comparison ................................................................ 59
Table 16: Competitive condition comparison .......................................................... 60
Table 17: Target of Export to US market ................................................................. 62
Table 18: Export revenue of garment products to US .............................................. 63
Table 19: Export revenue to US market in product type .......................................... 64
Table 20: Consumption in States of America .......................................................... 65
6
Figure list
Figure 1.1: Marketing 4Ps ....................................................................................... 13
Figure 1.2: Porter’s five forces analysis .................................................................. 16
Figure 2.1: Organizational structure ....................................................................... 45
Figure 2.2: Procedures for production and quality control .................................... 55
7
General introduction
Reason for the Subject
Textile industry is one important section of Vietnamese economy with more than
2000 companies, using more than 2 million, export turnover is about 15% total
export turnover of Vietnam, second only to Oil and gas industry. In 2007, export
turnover of textile is 7.75 billion USD. In the first nine months of 2008, encountered
many difficulties as a result of economic recession in the US lead to reduction in
consumers and textile import in US as well as many other countries, domestic
inflation was high, caused a lot of difficulties to textile and garment industry.
Since Vietnam’s accession to WTO on 11th January 2008, Vietnam has the
opportunity to deeply integrate to global economy, attract foreign investment,
develop the economy and focus on export as many barriers, such as import quota to
the US, have been lifted.
Since the time Obama took up the office, he has also been using drastic measures to
textile imported from China. According to US Ministry of Commerce, Chinese
textile export to the US is decreasing, market of Chinese product is reducing, open
opportunities for textile product from India, Indonesia and Vietnam. According to
evaluation, Vietnam is considered to be able to compete with China and India.
Recently, United State International Trade Commission put Vietnam into top 5 of
textile export to the US.
In Vietnam, Chien Thang Garment Joint Stock Company (Chigamex) is one of the
five big companies which have strength of export products. To take full advantage
of the new opportunities in US market and overcome challenges in the economic
crisis period, we have chosen the topic “Market Development Strategy for products
of Garment Companies during WTO integration period - Situation of Chien Thang
Garment Joint Stock Company’s product in US’s market” with the aim to present
analysis, judgments and solutions for Chigamex in particular, as well as for the
other companies in general, in current economic situation.
8
Target of project study
This composition was done with the following targets:
Study theories applied to form company’s strategy.
Generally analyze Vietnam Textile industry in order to find out challenges and
support of the government.
Analyze external factors (world economy, competitors, etc...) to realize
opportunities and challenges for Chigamex.
Analyze Chigamex to realize the company’s Strength and Weakness/
Analyze US market, the world’s biggest textile import market to find out the
most effective approach method for Chigamex.
Suggest solutions for Chigamex in order to increase sales result in US market.
Analytical method
Data acquisition method
This research was done mainly based on secondary figures and data, including:
Internet: Articles which analyze current economic situation, articles on US’s
policy on textile product and articles which analyze consumers’ characteristic in US
market.
Annual report on export, imported material, raw material purchase of Chigamex.
Some information was acquired by interviewing Chigamex’s Export Department
staffs.
Analytical method:
The research was done base on some theories like SWOT Analysis tool, Michael
Porter’s five forces analysis.
9
Structure of the composition:
This composition is present in 3 chapters:
Chapter1: This chapter summarizes theories and tools of market development
and analyzes some external factors which relate to sales development activities of
the company in foreign market.
Chapter 2: Focus on Chigamex’s internal conditions and activities directly
related to Export Sales in US.
Chapter 3: Summarize analysis result of chapter 2, present key targets in market
development and suggest solution of US market development to the company.
10
Chapter 1: Basis of argument for market development
strategy in company’s Marketing activities.
1.1 Market strategy of the company.
1.1.1 Market Development Strategy
In order to quickly enter a market, a quick mover company needs to integrate three
important aspects: Analyze key market, develop plan to enter market and realize the
strategy. This process makes each function become more useful to Marketing
people. Instead of study every factor of Marketing mix, each aspect of the process
will combine itself with the target of each and every Marketing element, help
develop more intelligent Marketing program in continuous competition of the
market today.
In the process of quick moving, the first aspect – Analyze key market will look into
every element of the market. Every element, such as consumer’s market, growth
rate and scale of the industry, competitors or general market will be study carefully.
Analysis of key market will help the company define achievements and outstanding
issues, competition force in the market and in business, specify potential customers,
main customers of the company and how to approach them.
Basically, in this first aspect, matters of Product, Prices and Place (Distribution)
must be placed together in order to define opportunities or holes to be filled in the
market.
The second aspect is plan for enter the market. After answered the questions: “Are
there any chances, any need?” the company has to make a decision and really start
developing a plan. In plan for enter the market, key products need to be considered
from all sides, appearance, price, usefulness to customers, how to approach the
customers, where the strategic location of sales is, how to win the distribution
channels, etc...
11
Same as the first aspect, plan for entering the market normally also using many
factors in Marketing mix and depends a lot on the product itself, price and place of
distribution. Besides, in this second aspect, people pay more attention to
advertisement and promotion. They are used to uniformly develop Marketing
programs as well as sales support.
The third aspect, realize the strategy, everything is combined so the customer can
really see the product or service. Three main factors in this aspect are:
Check the new product or service, check for possibility to widen the brand name,
prolong its life cycle.
Develop a program and Marketing plan, including notice, advertisement on
public media channels.
Invent new and creative Marketing programs with carefully selected partner/
supplier.
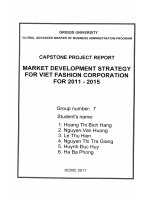
One important thing that need to be carefully taken care of during realize the
strategy is the fluent co-ordinate of 4 Ps
New product should always be looked into carefully and have properly
developed plan.
Price is always the topic of universal interest and therefore should always be
competitive and contain aspects which encourage the customer’s decision to go for
the product.
Place (distribution) is always be the top priority. Distribution is the main force of
Marketing, always require to be fought for to keep the distribution channel strong.
Advertisement and promotion are used to introduce the product, encourage them
to try using the new one. Loyalty programs, in the mean time, should also be active
to keep the customers.
12
Figure 1.1: Marketing 4Ps
1.1.2 Suggestions for developing new market.
Analyze key market:
Growth rate, market size, product.
Competitors
Customers and consumers.
Plan for entering market:
Product strategy
Customer attraction strategy
Distribution strategy
Realize the strategy:
New product development
Marketing program development
13
Co-ordinate with partner.
Using the quick mover strategy will help people to have an overview about 4 Ps of
Marketing mix, to be able to see when the need for product/service arise, when is
the opportunity open for the product/service, how will the product/service be and in
the end, how to help the customer chose and use our product/service.
There are full of brand names in today’s Marketing world. Which company want to
enter a new market will have to take full advantage of their own strength, combine
with the advantage of quickly enter market will help them to have better plan, get to
the customer quicker and have more competitive force in the market.
1.2 Market Analysis Tools
1.2.1 SWOT Analysis
When developing strategy, a company needs to go though five steps:
Define company’s principle
SWOT analysis
Define strategic target
Develop detail tactic
Define control mechanism for the strategy.
SWOT analysis tool is not only helpful for companies in developing a domestic
business strategy, but also play a great role in shaping an international business
strategy when the companies are strong enough. If the company wants to develop,
gain reputation, build a strong brand name then SWOT is one indispensable part in
developing company’s strategy.
SWOT analyzes the factors in external environment (Opportunities and Threats)
that the company has to face, as well as factors in the company’s internal
environment (Strengths and Weakness). This is a difficult task, require a lot of time
14
and effort, costly and also require the ability to gather and analyze information that
is available to the company in an optimum way.
A company may define Opportunities and Threats by analyze data string in the
external environment: Economy, Finance, Politic, Legal system, Social and
Competition in places where that company is operating or planning to enter.
Opportunities may be the potential to develop the market, market holes or strategic
location which may be near the material source, cheap or competent labor. Threats
may be the shrinking market, fierce competition, changes in government’s policy,
unstable politic in key markets or new developed technology make the technology
of the company become obsolete.
Internal environment of the company should be analyze to see where is Strength,
where is Weakness. Strength may be abilities of workforce, resources or advantage
that the company has over the competitors, such as management skill, superior
technology, well recognized brand name, cash availability, reputation with public or
having big share in key market, etc… Weakness may be present in shortcoming,
disadvantage or low skill, lack of resource or low competition strength. It may as
well be an ineffective distribution channel, bad relation with the workforce, lack of
management skill or new product is falling far behind competitors’.
Result of SWOT analysis must be counted on with accuracy, detail, realistic and
feasible. Company will use that result as foundation for the next steps, such as to
define strategic target, develop detail tactic and define control mechanism. Effective
strategies are strategies which are able to take advantage of external opportunities
and internal strength as well as able to neutralize the threats, able to overcome its
own weakness. The company should be able to clear the strategic target, follow that
target by a series of necessary activities. That target must be measurable, realizable
and have a definite duration of operation time. Tactic should be build up in a way
that expresses clearly in detail how the target should be realized. Control
mechanism is the mechanism, the regulations that the company use to control and
15
monitor any of the 5 steps mentioned above. Control mechanism ensures that the
company is doing the right thing, following the correct part to archive the target.
1.2.2 Porter’s Five Forces Analysis
Michael Eugene Porter (born 1947) is a University Professor at Harvard Business
School, with academic interests in management and economics. His main academic
objectives focus on how a firm or a region can build a competitive advantage and
develop competitive strategy. He is also a Fellow Member of the Strategic
Management Society. One of his most significant contributions is the five forces.
In five forces analysis, he uses concepts developed in Industrial Organization (IO)
economics to derive five forces which determine the competitive intensity and
therefore attractiveness of a market. Companies or firms which want to find
advantage over their competitors may use this model in order to have better
understanding about the industry it is operating on.
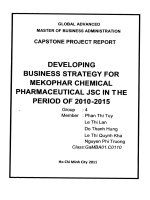
Figure 1.2: Porter’s five forces analysis
16
Companies normally use this model to analyze and consider whether they want to
enter a new market. However, as today’s competitive market is ever changing, this
model is also used when a company would like to find out the areas in the market,
where the company can operate better and gain more benefit.
According to Michael Porter, competitive intensity in any industry are affected by
five forces:
The threat of substitute products: The existence of close substitute products
increases the propensity of customers to switch to alternatives in response to price
increases (high elasticity of demand).
Buyer propensity to substitute
Relative price performance of substitutes
Buyer switching costs
Perceived level of product differentiation
The threat of the entry of new competitors: Profitable markets that yield high
returns will draw firms. This results in many new entrants, which will effectively
decrease profitability. Unless the entry of new firms can be blocked by incumbents,
the profit rate will fall towards a competitive level (perfect competition).
The existence of barriers to entry (patents, rights, etc.)
Economies of product differences
Brand equity
Switching costs or sunk costs
Capital requirements
Access to distribution
Absolute cost advantages
Learning curve advantages
17
Expected retaliation by incumbents
Government policies
The intensity of competitive rivalry: For most industries, this is the major
determinant of the competitiveness of the industry. Sometimes rivals compete
aggressively and sometimes rivals compete in non-price dimensions such as
innovation, marketing, etc.
Number of competitors
Rate of industry growth
Intermittent industry overcapacity
Exit barriers
Diversity of competitors
Informational complexity and asymmetry
Fixed cost allocation per value added
Level of advertising expense
Economies of scale
Sustainable competitive advantage through improvisation
The bargaining power of customers: Also described as the market of outputs. The
ability of customers to put the firm under pressure and it also affects the customer's
sensitivity to price changes.
Buyer concentration to firm concentration ratio
Degree of dependency upon existing channels of distribution
Bargaining leverage, particularly in industries with high fixed costs
Buyer volume
Buyer switching costs relative to firm switching costs
18
Buyer information availability
Ability to backward integrate
Availability of existing substitute products
Buyer price sensitivity
Differential advantage (uniqueness) of industry products
RFM Analysis
The bargaining power of suppliers: Also described as market of inputs. Suppliers
of raw materials, components, labor, and services (such as expertise) to the firm can
be a source of power over the firm. Suppliers may refuse to work with the firm, or
e.g. charge excessively high prices for unique resources.
Supplier switching costs relative to firm switching costs
Degree of differentiation of inputs
Presence of substitute inputs
Supplier concentration to firm concentration ratio
Employee solidarity (e.g. labor unions)
Threat of forward integration by suppliers relative to the threat of backward
integration by firms
Cost of inputs relative to selling price of the product.
1.3 Analysis of US Market - one of the key markets for Vietnamese
garment companies.
1.3.1 Outcome of textile and garment industry’s export to America since
Vietnam’s accession to the WTO.
Since Vietnam joined WTO on 11th, January 2007, the quota for import and export
of textile and garment product has been eliminated. This, beside the advantage it
brings, also has become a disadvantage for Vietnam textile and garment industry.
19
When the US’ Department of Commerce have set up a monitor program for textile
and garment product originated from Vietnam, Vietnamese exporter of textile and
garment product have encountered real problems.
The immediate challenge when became member of WTO is the tariff barrier being
reduce to minimum as commitment with WTO. From 11th January 2007, import tax
for textile and garment product is reduced from 50% to 20%, tax for textile fabric is
reduce from 40% to 12%.
According to Ministry of Industry and Trade, this is the foundation that affects US’s
Department of Commerce give judgment whether textile and garment product from
Vietnam be monitored when imported to US Market. As a result of the monitor
mechanism for textile and garment product, member of WTO became more careful
when using product from Vietnam.
In 2007, many U.S. importers became hesitated in order to follow up the
happenings of the monitoring on export growth of Vietnamese textile apparel goods
from the U.S. monitoring authority. The importers were worried of the reactions of
the U.S. administration authority which caused disadvantages for their imports and
business, therefore, had not hastened to sign contracts and even considered to draw
Viet Nam from the list. This caused a lot of trouble for Vietnam’s garment
companies.
According to US’s Custom data, in 2007, price of products which were monitor
were reduced, but only slightly, more or less 10%. This means that price of
Vietnam’s product were not dumping. As a result, growth rate of textile and
garment product from Vietnam exported to US market were reasonable and
acceptable by the US’s partner.
Revenue of textile and garment product in US market
Although world textile market recently has a lot of fluctuation, Vietnamese
exporters could still manage to grip the chances and became quite successful.
Revenue of textile and garment product exported to US market were 5.4 Billion
20
USD (increases almost 30% compare to previous year). This has made Vietnam the
second biggest textile and garment exporter to the US, only behind China (6.1
Billion USD)
Today, with signals from a healthy economic system of Vietnam and good
reputation of exported textile products, bigger customers from the US have came
back and resumed business with Vietnam. The return of US’s customers is a good
signal, displays that Vietnamese government and garment companies have actively
applied appropriate measures and reduced effect from US’s control mechanism.
Table 1: Total revenue of Vietnam textile and garment insdustry export to US
market
Parameter
Revenue
Total revenue from export in first 6 months 2007
1,635
Total revenue from export in first 6 months 2008
1,973
Unit: Million USD
Total revenue from export to US market in the fist half of 2008 have increased
20.7% compare to that period of 2007. Periodically, middle of the year is the season
of goods deliver, and a higher quantity is expected. Orders for textile and garment
products from American importers have created jobs for many companies. Many
contracts between Vietnamese companies and American partners have been and are
being signed.
1.3.2 US’ Policy for textile product import control during Obama’s
government
Since Barack Obama was elected as US President and Democratic Party were
gaining more and more influence in the Congress, “Free textile trade” seemed to be
narrowed give up place for “Fair textile trade” in the coming years. This trend was
demonstrated by US’s drastic attitude to China.
21
Following WTO regulations, US is forced to eliminate quota for China by the end
of 2008. The newly elected President, however, said that he would support the
application of protectionism against goods from China, as it is a “worthy” action.
This has never been approved by Bush when he was in power. As a result, “special
protectionism” will be in force until 2012.
Yet, since the end of 2008 and beginning of 2009, Vietnam textile and garment
industry have encountered many challenges. First is the new safety regulation for
product imported to the US, with many strict rules and different effective periods,
officially in force since February 2009. Second is the new “rank” of Vietnam textile
products, being put into second place may as well create new barrier. It is difficult
to predict what US government will do to protect their own domestic products.
1.3.3 Particular traits of textile sales in US Market.
Market volume: US is one of the three largest consume markets of textile product in
the world, beside EU and Japan. US have many interesting elements to the textile
market: high population (281Million), high Gross National Income, highly
developed fashion trends, 80% of the population live in urban areas, average
income is around 33 K USD/year.
Americans spend quite a lot of time for shopping. In average, one person in he US
goes for clothes shopping 22 times, purchase 54 sets every year. Meanwhile, an
European goes for clothes shopping 14 times, an Asian goes 13 times/year and a
Mexican goes only 10 times/year. It’s quite clear that American should be the most
interesting customer to every garment product supplier. Aside from that, being a
country with many races, many different cultures and ways of life, US are definitely
the center of the world’s textile and garment product market.
Consumer trends
American youth are nowadays becoming the main consumers. In the next few years,
it is predicted that this trend will be booming, grow even faster than the population
growth. The teens and twens are having higher and higher income, also spending
22
more and more for fashion. This age group attach special important to fashion,
mode and brands. They are also adapted very quickly to Marketing activities on
public media, especially on Internet, cable TV and fashion magazines.
People above 45 have trends to cut down spending on clothes. They tend to look for
alternatives which fit both their requirement and budget. Even though, they are still
the group with high percentage in total consumer of textile and garment products.
The increase of people above 65 is also a good sign for garment companies. These
people don’t pay a lot of attention to fashion but to usefulness and comfortableness.
Consumers in modern society are having less and less time to go to the shops
because time is the thing they don’t have. Even when they’re free, they prefer to
spend their time with family and friends. This trend may be the benefit for
decoration manufacturer but is unfavoring to garment suppliers who sale only in
traditional distribution channel.
Recently, many companies and firms in the US allow employee to wear free clothes
instead of uniform, this also is a good chance for textile industry.
Another opportunity to textile and garment industry is the trend that consumers try
to find the usefulness in low price imported products. This influents the import
products from low cost countries and shifts production factories from the US to
those countries. Under that circumstance, developing countries have good chance to
use their strength and gain advantage.
Customer habit
Same as other products, quality and price play important role in customer’s
decision. Main features which affect garment products are sizes, durability, comfort,
design and brands.
In general, Americans are very practical. They always consider and go for the
option that gives them the best effect. In fashion area, even brand names are highly
valued, they never go too far from the “economic” side. Normally an American will
not chose the second grade product with lower price. American judges the quality
23
via brand names, different compare to people in developing countries. Famous
brands create attraction for the products. Even though, some experts still think that
in the near future, American will not value this aspect highly anymore.
Customer taste
Americans have a habit to go shopping in season. They can start go shopping right
at the start of the season, not waiting for holidays or Christmas to have sale off.
Therefore, a supplier in US market must pay attention to on time delivery, and
distributing carefully selected seasonal products.
Americans are liberal people, they may shopping base on their mood. They like to
have a wide range of selection for different types, matching their aesthetics. It may
change depend on time, on season or weather, but it must match with the fashion
trend.
Nowadays, Americans are likely to chose casuals clothes, such as T-shirt, pullover,
shorts or sport wears. Formal clothes are considered out of date and are not worn in
everyday life.
Market segmentation
Demands are split into market segmentation allow producer to concentrate their
resource, use their strength and gain advantage in each targeted segment. US textile
and garment market are divided into three main segments:
Segment 1: The upper strata often buy products from famous brands, expensive
but high quality. These products normally origin from Europe: France, Germany,
and Italy.
Segment 2: The middle class are easier, but still more interested in well designed
product with higher quality.
Segment 3: Lower class buys products based mainly on the price.
24
Customers in Segment 2 and 3 are the targeted customer of Vietnam textile and
garment industry. In this segment, Vietnam has to compete with China, Thailand,
and Indonesia…
Total money spends for garment products in US market is about 1,004 billion
USD/year. US are ranked forth in the world for this, well behind Germany (1.321 B
USD), United Kingdoms (1,144 B USD). United States, beside that capability, also
a country with many races, culture and taste, have became one of the biggest
consume spot for textile and garment product in the world.
1.3.4 US Distribution System.
US retail trading system has good financial volume and is very well operated. In
US, retail units are divided into seven groups, base on product price.
Special stores: Products in these store have very high quality, are from well
known brands and very expensive. Examples of such a store are: Anntaylor,
Ediebauer…
Department store for clothes and house hold equipments: Sears’ store system
have more than 870 stores, Fedeparted Dept have 459 stores.
Chain store: A chain of stores selling clothes, footwear and jewelry. The network
for these chain stores are the whole US. Examples of such chain stores are
Jcpenney, Kohl’s and Mervyn’s…
Discount stores are organized as super market, have large scale and high revenue,
aim to meet all request from all social class. Wall-mart store has about 3200 stores,
Target super market have about 1000 stores…
Off-price store: this model is similar to the discount store, but price here is even
lower.
Mail Order Store: the model using advertisement and product introduction by
media channels such as Internet, product catalogue, brochures or Television. This
model is operated mainly by telephone, mail service and Internet. Every steps, from
25
order receive, product sales or distribution are done by those mentioned above
media channels. This model is becoming more popular and stronger. Examples are
Blair, Fogdog…
Retail store are stores selling sport equipments and commemorative apparatus,
such as Burlington Coatfty, Today’s Man…
Merging between retail companies are affecting garment producer. Nowadays, most
of garment products are distributed by 20 top retailers in the US. Market share of
special store is 24.9%, department store is 21%, chain store is 13.5%, discount store
is 17.9%, online store is 4.95% and authorized dealer is 2.2%.
1.3.5 US’ Legal system for imported garment products.
Using protectionism for domestic producer in order to keep the employment stable
have always been an priority for US government, regardless of administration
period. US’ policy for imported textile and garment products are described bellow:
Until 1/1/2005, the time of quota elimination for all WTO members, America have
46 different agreements on textile and apparel as the spirit of WTO’s Convention of
textile and apparel. These agreements regulate import by directly control the
quantity of textile and garment products that US’s business partner can export to
their market.
After 1/1/2005, US’s regulations for textile and garment can only be appeared as
certain teams and conditions in bipartite or regional Free trade agreement, or some
“business initiative” signed between US and their business partners. These
agreements allow textile and garment product from other countries approach US
Market on some favor if certain conditions are met. As a result, although free from
the quota control, most of WTO members after 1/1/2005 still have to pay import tax
for textile and garment product if they’re not in those mentioned above agreements.
Regulate import by influencing prices and quantity are two easily recognized traits
in US’s policy. They’re changed to properly apply with every period of global
development on textile and garment product and the international job allocation.
26