ECG hướng dẫn đọc điện tâm đồ hay
Bạn đang xem bản rút gọn của tài liệu. Xem và tải ngay bản đầy đủ của tài liệu tại đây (15.4 MB, 84 trang )
INTRODUCTION TO ECG INTERPRETATION
V8.0 (July 2012)
Frank G. Yanowitz, MD
Professor of Medicine
University of Utah School of Medicine
Director, IHC ECG Services
LDS Hospital & Intermountain Medical Center
Salt Lake City, Utah
Dedicated To:
INTRODUCTION
This booklet is dedicated to the memory of Alan E. Lindsay, MD (1923-1987) master
teacher of electrocardiography, friend, mentor, and colleague. Many of the excellent
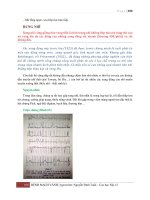
ECG tracings illustrated in this learning program are from Dr. Lindsay's personal
collection of ECG treasures. For many years these ECG's have been used in the training of
medical students, nurses, housestaff physicians, cardiology fellows, and practicing
physicians in Salt Lake City, Utah as well as at many regional and national medical
meetings.
The materials presented in the “Introduction to ECG Interpretation” Booklet are for your information only. All of the
materials are provided "AS IS" and without any warranty, express, implied or otherwise, regarding the materials'
accuracy or performance. You accept all risk of use of, and reliance on, the materials contained in the Booklet.
1
It is an honor to be able to provide this booklet as well as an interactive ECG website on
the Internet in recognition of Dr. Lindsay's great love for teaching and for
electrocardiography: This document and the
ECG website offer an introduction to clinical electrocardiography. testing
ECG terminology and diagnostic criteria often vary from book to book and from one teacher to
another. In this document an attempt has been made to conform to standardized terminology
and criteria, although new diagnostic concepts derived from the recent ECG literature have been
included in some of the sections. Finally, it is important to recognize that the mastery of ECG
interpretation, one of the most useful clinical tools in medicine, can only occur if one
acquires considerable experience in reading ECG's and correlating the specific ECG
findings with the pathophysiology and clinical status of the patient.
The sections in this booklet are organized in the same order as the recommended step-wise
approach to ECG interpretation outlined in Section 2 (p7). Beginning students should first go
through the sections in the order in which they are presented. Others may choose to explore
topics of interest in any order they wish. It is hoped that all students will be left with some of the
love of electrocardiography shared by Dr. Lindsay.
TABLE OF CONTENTS
1. The Standard 12 Lead ECG (p. 4)
7. Atrial Enlargement (p. 55)
2. A "Method” of ECG Interpretation (p. 7)
8. Ventricular Hypertrophy (p. 57)
3. Characteristics of the Normal ECG (p. 12)
9. Myocardial Infarction (p. 61)
4. ECG Measurement Abnormalities (p. 14)
10. ST Segment Abnormalities (p. 73)
5. ECG Rhythm Abnormalities (p. 17)
11. T Wave Abnormalities (p. 77
6. ECG Conduction Abnormalities (p. 46)
12. U Wave Abnormalities (p. 82)
Basic Competency in Electrocardiography
(Modified from: ACC/AHA Clinical Competence Statement, JACC 2001;38:2091)
In 2001 a joint committee of the American College of Cardiology and the American Heart
Association published a list of ECG diagnoses considered to be important for developing basic
competency in ECG interpretation. This list is illustrated on the following page and is also
illustrated on the website with links to examples or illustrations of the specific ECG diagnosis.
Students of electrocardiography are encouraged to study this list and become familiar with the
ECG recognition of these diagnoses. Most of the diagnoses are illustrated in this document.
Basic Competency in Electrocardiography
2
NORMAL TRACING
Normal ECG
TECHNICAL PROBLEM
Lead misplaced
Artifact
SINUS RHYTHMS/ARRHYTHMIAS
Sinus rhythm
Sinus tachycardia
Sinus bradycardia
Sinus Arrhythmia
Sinus arrest or pause
Sinoatrial block, type I
Sinoatrial block, type II
OTHER SV ARRHYTHMIAS
PAC's (nonconducted)
PAC's (conducted normally)
PAC's (conducted with aberration)
Ectopic atrial rhythm or tachycardia (unifocal)
Multifocal atrial rhythm or tachycardia
Atrial fibrillation
Atrial flutter
Junctional prematures
Junctional escapes or rhythms
Accelerated Junctional rhythms
Junctional tachycardia
Paroxysmal supraventricular tachycardia
QRS AXIS AND VOLTAGE
Right axis deviation (+90 to +180)
Left axis deviation (-30 to -90)
Bizarre axis (-90 to -180)
Indeterminate axis
Low voltage frontal plane (<0.5 mV)
Low voltage precordial (<1.0 mV)
HYPERTROPHY/ENLARGEMENTS
Left atrial enlargement
Right atrial enlargement
Biatrial enlargement
Left ventricular hypertrophy
Right ventricular hypertrophy
Biventricular hypertrophy
ST-T, AND U ABNORMALITIES
Early repolarization (normal variant)
Nonspecific ST-T abnormalities
ST elevation (transmural injury)
ST elevation (pericarditis pattern)
Symmetrical T wave inversion
Hyperacute T waves
Prominent upright U waves
U wave inversion
Prolonged QT interval
MI PATTERNS (acute, recent, old)
Interior MI
Inferoposterior MI
VENTRICULAR ARRHYTHMIAS
Inferoposterolateral MI
PVC's
Posterior MI
Ventricular escapes or rhythm
Anteroseptal MI
Accelerated ventricular rhythm
Anterior MI
Ventricular tachycardia (uniform)
Anterolateral MI
Ventricular tachycardia (polymorphous or torsades))
Extensive anterior MI
Ventricular fibrillation
High lateral MI
Non Q-wave MI
AV CONDUCTION
Right ventricular MI
1st degree AV block
Type I 2nd degree AV block (Wenckebach)
CLINICAL DISORDERS
Type II 2nd degree AV block (Mobitz)
Chronic pulmonary disease pattern
AV block, advanced (high grade)
Suggests hypokalemia
3rd degree AV block (junctional escape rhythm)
Suggests hyperkalemia
3rd degree AV block (ventricular escape rhythm)
Suggests hypocalcemia
AV dissociation (default)
Suggests hypercalcemia
AV dissociation (usurpation)
Suggests digoxin effect
AV dissociation (AV block)
Suggests digoxin toxicity
Suggests CNS disease
INTRAVENTRICULAR CONDUCTION
Complete LBBB, fixed or intermittent
PACEMAKER ECG
Incomplete LBBB
Atrial-paced rhythm
Complete RBBB, fixed or intermittent
Ventricular paced rhythm
Incomplete RBBB
AV sequential paced rhythm
Left anterior fascicular block (LAFB)
Failure to capture (atrial or ventricular)
Left posterior fascicular block (LPFB)
Failure to inhibit (atrial or ventricular)
Nonspecific IV conduction delay (IVCD)
Failure to pace (atrial or ventricular)
WPW preexcitation pattern
3
1. THE STANDARD 12 LEAD ECG
The standard 12-lead electrocardiogram is a representation of the heart's
electrical activity recorded from electrodes on the body surface. This section
describes the basic components of the ECG and the standard lead system used
to record the ECG tracings.
The diagram illustrates ECG waves and intervals as well as standard time
and voltage measures on the ECG paper.
ECG WAVES AND INTERVALS: What do they mean?
P wave: sequential depolarization of the right and left atria
QRS complex: right and left ventricular depolarization
ST-T wave: ventricular repolarization
U wave: an electrical-mechanical event at beginning of diastole
PR interval: time interval from onset of atrial depolarization (P wave)
to onset of ventricular muscle depolarization (QRS complex)
QRS duration: duration of ventricular muscle depolarization (width of
the QRS complex)
QT interval: duration of ventricular depolarization and repolarization
PP interval: rate of atrial or sinus cycle
RR interval: rate of ventricular cycle
4
ORIENTATION OF THE 12-LEAD ECG:
It is important to remember that the 12-lead ECG provides spatial information about the
heart's electrical activity in 3 approximately orthogonal directions (think: X,Y,Z):
Right – Left (X)
Superior – Inferior (Y)
Anterior – Posterior (Z)
Each of the 12 leads represents a particular orientation in space, as indicated below (RA =
right arm; LA = left arm, LL = left leg):
Bipolar limb leads (frontal plane):
Lead I: RA (- pole) to LA (+ pole) (Right -to- Left direction)
Lead II: RA (-) to LL (+) (mostly Superior -to- Inferior direction)
Lead III: LA (-) to LL (+) (mostly Superior -to- Inferior direction)
Augmented limb leads (frontal plane):
Lead aVR: RA (+) to [LA & LL] (-) (mostly Rightward direction)
Lead aVL: LA (+) to [RA & LL] (-) (mostly Leftward direction)
Lead aVF: LL (+) to [RA & LA] (-) (Inferior direction)
“Unipolar” (+) chest leads (horizontal plane):
Leads V1, V2, V3: (mostly Posterior -to- Anterior direction)
Leads V4, V5, V6: (mostly Right -to- Left direction)
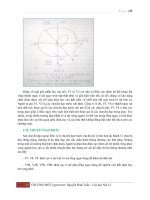
Behold: Einthoven's Triangle! Each of the 6 frontal plane or "limb" leads has a negative
and positive pole (as indicated by the '+' and '-' signs). It is important to recognize that
lead I (and to a lesser extent aVL) are right -to- left in direction. Also, lead aVF (and to a
lesser extent leads II and III) are superior -to- inferior in direction. The diagrams on page 6
further illustrate the frontal plane and chest lead hookup.
5
Note: the actual ECG waveform in each of the 6 limb leads varies from person to person
depending on age, body size, gender, frontal plane QRS axis, presence or absence of
heart disease, and many other variables. The precordial lead sites are illustrated below.
Precordial lead placement
V1: 4th intercostal space (IS) adjacent to right
sternal border
V2: 4th IS adjacent to left sternal border
V3: Halfway between V2 and V4
V4: 5th IS, midclavicular line
V5: horizontal to V4; anterior axillary line
V6: horizontal to V4-5; midaxillary line
(Note: in women, the precordial leads should
be placed on the breast surface not under
the breast to insure proper lead placement)
6
2. A "METHOD" OF ECG INTERPRETATION
This "method" is recommended when reading 12-lead ECG's. Like the approach to doing a
physical exam, it is important to follow a standardized sequence of steps in order to avoid
missing subtle abnormalities in the ECG tracing, some of which may have clinical importance. The
6 major sections in the "method" should be considered in the following order:
1. Measurements
2. Rhythm analysis
3. Conduction analysis
4. Waveform description
5. ECG interpretation
6. Comparison with previous ECG (if available)
1. MEASUREMENTS (usually made in frontal plane leads):
Heart rate (state both atrial and ventricular rates, if different)
PR interval (from beginning of P to beginning of QRS complex)
QRS duration (width of most representative QRS)
QT interval (from beginning of QRS to end of T)
QRS axis in frontal plane (see "How to Measure QRS Axis" on p 8)
2. RHYTHM ANALYSIS:
State the basic rhythm (e.g., "normal sinus rhythm", "atrial fibrillation", etc.)
Identify additional rhythm events if present (e.g., "PVC's", "PAC's", etc)
Remember that arrhythmias may originate in the atria, AV junction, and ventricles
3. CONDUCTION ANALYSIS:
"Normal" conduction implies normal sino-atrial (SA), atrio-ventricular (AV), and
intraventricular (IV) conduction.
The following conduction abnormalities are to be identified if present:
2nd degree SA block (type I, type II, or uncertain)
1st, 2nd (type I or type II), and 3rd degree AV block
IV blocks: bundle branch, fascicular, and nonspecific blocks
Exit blocks: these are blocks just distal to ectopic pacemaker site
4. WAVEFORM DESCRIPTION:
Carefully analyze each of the12-leads for abnormalities of the waveforms in the order
in which they appear: P-waves, QRS complexes, ST segments, T waves, and…. Don't
forget the U waves.
P waves: are they too wide, too tall, look funny (i.e., are they ectopic), etc.?
QRS complexes: look for pathologic Q waves, abnormal voltage, etc.
ST segments: look for abnormal ST elevation and/or depression.
T waves: look for abnormally inverted T waves or unusually tall T waves.
U waves: look for prominent or inverted U waves.
5. ECG INTERPRETATION:
This is the conclusion of the above analyses. Interpret the ECG as "Normal", or
"Abnormal". Occasionally the term "borderline" is used if unsure about the
significance of certain findings or for minor changes. List all abnormalities.
Examples of "abnormal" statements are:
7
Inferior MI, probably acute
Old anteroseptal MI
Left anterior fascicular block (LAFB)
Left ventricular hypertrophy (LVH)
Right atrial enlargement (RAE)
Nonspecific ST-T wave abnormalities
Specific rhythm abnormalities such as atrial fibrillation
Example of a 12-lead ECG interpretation (see below ECG tracing):
HR=67 bpm; PR=0.18 s; QRS=0.09 s; QT=0.40 s; QRS axis = -50° (left axis
deviation)
Normal sinus rhythm; normal SA, AV, and IV conduction; rS waves in leads II,
III, aVF (this means small r waves and large S waves)
Interpretation: Abnormal ECG: 1) Left anterior fascicular block (see p.16)
6. COMPARISON WITH PREVIOUS ECG:
If there is a previous ECG in the patient's file, the current ECG should be compared
with it to see if any significant changes have occurred. These changes may have
important implications for clinical management decisions.
HOW TO MEASURE THE QRS AXIS:
INTRODUCTION: The frontal plane QRS axis represents the average direction of
ventricular depolarization forces in the frontal plane. As such this measure can inform
the ECG reader of changes in the sequence of ventricular activation (e.g., left anterior
fascicular block), or it can be an indicator of myocardial damage (e.g., inferior
myocardial infarction). Determination of the QRS axis requires knowledge of the
direction of the six individual frontal plain ECG leads. Einthoven’s triangle enables us
to visualize this.
In the diagram below the normal range is shaded grey (-30° to +90°). In the adult
left axis deviation (i.e., superior, leftward arrow) is defined from -30° to -90°, and
right axis deviation (i.e., inferior, rightward arrow) is defined from +90° to +180°.
From -90° to ±180° is very unusual and may be due to lead placement error.
8
QRS Axis Determination:
First find the isoelectric lead if there is one; it‟s the lead with equal QRS forces in
both positive and negative direction (i.e., above and below the baseline). Often this
is also the lead with the smallest QRS complex.
The correct QRS axis is perpendicular (i.e., right angle or 90 degrees) to that lead's
orientation (see above diagram).
Since there are two possible perpendiculars for each isoelectric lead, one must chose
the one that best fits the direction of the QRS forces in other ECG leads.
Isoelectric
Lead
I
II
III
aVR
aVL
aVF
More likely axis
Less likely axis
+90
-30
+30
-60
+60
0
-90
+150
-150
+120
-120
+/-180
If there is no isoelectric lead, there are usually two leads that are nearly isoelectric,
and these are always 30° apart on the diagram. Find the perpendiculars for each
lead and chose an approximate QRS axis within the 30° range.
Occasionally each of the 6 frontal plane leads is small and/or isoelectric. An axis
cannot be determined and is called indeterminate. This is a normal variant.
Examples of QRS Axis Determination:
9
An axis in the normal range (-30º to +90º):
Analysis
1.
2.
3.
4.
Lead aVF is the isoelectric lead (equal forces positive and negative).
The two perpendiculars to aVF are 0° and ±180°.
Note that Lead I is all positive (i.e., moving to the left).
Therefore, of the two choices, the axis has to be 0°.
Left Axis deviation (LAD):
10
Analysis
1.
2.
3.
4.
Lead aVR is the smallest and nearly isoelectric.
The two perpendiculars to aVR are -60° and +120°.
Note that Leads II and III are mostly negative (i.e., moving away from the + left leg)
The axis, therefore, has to be -60° (LAD).
Right Axis Deviation (RAD):
Analysis
1.
2.
3.
4.
Lead aVR is closest to being isoelectric (but slightly more positive than negative)
The two perpendiculars to aVR are -60° and +120°.
Note that Lead I is mostly negative; lead III is mostly positive.
Therefore the axis is close to +120°. Because aVR is slightly more positive, the axis is
slightly beyond +120° (i.e., closer to the positive right arm for aVR, ~ +125º)
11
3. CHARACTERISTICS OF THE NORMAL ECG
It is important to remember that there is a wide range of normal variation in the 12
lead ECG. The following "normal" ECG characteristics, therefore, are not absolute. It
takes considerable ECG reading experience to discover all the normal variants. Only
by following a structured "Method of ECG Interpretation" (p7) and correlating the
various ECG findings with the patient's particular clinical status will the ECG become
a valuable clinical tool.
I. Normal MEASUREMENTS (in adults)
Heart Rate: 50 - 90 bpm (some ECG readers use 60-100 bpm)
PR Interval: 0.12 - 0.20s
QRS Duration: 0.06 - 0.10s
QT Interval (QTc >0.39s, < 0.45s in men; >0.39s, <0.46s in women)
Poor Man's Guide to the upper limit of QT: @ 70 bpm, QT 0.40s; for every
10 bpm increase above 70 bpm subtract 0.02s, and for every 10 bpm decrease
below 70 bpm add 0.02s. For example:
QT 0.38 @ 80 bpm
QT 0.42 @ 60 bpm
Frontal Plane QRS Axis: +90° to -30° (in the adult)
II. Normal RHYTHM: Normal sinus rhythm
III. Normal CONDUCTION: Normal Sino-Atrial (SA), Atrio-Ventricular (AV),
and Intraventricular (IV) conduction
IV. Normal WAVEFORM DESCRIPTION:
P Wave: It is important to remember that the P wave represents the sequential
activation of the right and left atria, and it is common to see notched or biphasic P waves
of right and left atrial activation.
P duration < 0.12s
P amplitude < 2.5 mm
Frontal plane P wave axis: 0° to +75° (i.e., P must be up or + in I and II)
May see notched P waves in frontal plane, and biphasic P (+/-) in V1
QRS Complex: The normal QRS represents the simultaneous activation of the right
and left ventricles, although most of the QRS waveform is derived from the larger left
ventricular musculature.
QRS duration 0.10s
QRS amplitude is quite variable from lead to lead and from person to person.
Two determinates of QRS voltages are:
Size of the ventricular chambers (i.e., the larger the chamber, the
larger the voltage; often seen in young aerobic trained athletes)
Proximity of chest electrodes to ventricular chamber (the closer, the
larger the voltage; seen in tall, thin people)
Frontal plane leads:
The normal QRS axis range (+90° to -30°) implies that the QRS
direction must always be positive (i.e., up going) in leads I and II.
Small "septal" q-waves are often seen in leads I and aVL when the
QRS axis is to the left of +60°, or in leads II, III, aVF when the QRS
axis is to the right of +60°.
Precordial leads:
Small r-waves begin in V1 or V2 and increase in size up to V5. The
R-V6 is usually smaller than R-V5.
12
In reverse, the s-waves begin in V6 or V5 and increase in size up to
V2. S-V1 is usually smaller than S-V2.
The usual transition from S>R in the right precordial leads to R>S
in the left precordial leads is V3 or V4.
Small normal "septal" q-waves may be seen in leads V5 and V6.
ST Segment: In a sense, the term "ST segment" is a misnomer, because a discrete
ST segment distinct from the T wave is often not seen. More frequently the ST-T
wave is a smooth, continuous waveform beginning with the J-point (end of QRS),
slowly rising to the peak of the T and followed by a more rapid descent to the
isoelectric baseline or the onset of the U wave. This gives rise to asymmetrical T
waves in most leads. The ST segment occurs during Phase 2 (the plateau) of the
myocardial cell action potentials. In some normal individuals, particularly women, the
T wave looks more symmetrical and a distinct horizontal ST segment is present.
The ST segment is often elevated above baseline in leads with large S waves
(e.g., V2-3), and the normal configuration is concave upward. ST segment
elevation with concave upward appearance may also be seen in other leads;
this is called the early repolarization pattern, and is often seen in young,
male athletes (see an example of "early repolarization" in leads V4-6 in the
ECG below). J-point elevation is often accompanied by a small J-wave in the
lateral precordial leads. The physiologic basis for the J-wave is related to
transient outward K+ current during phase I of the epicardial and midmyocardial cells, but not present in the subendocardial cells. Prominent J
waves are can also be seen in hypothermia (also called Osborn waves)
13
4. ABNORMALITIES IN THE ECG MEASUREMENTS
1. PR Interval (measured from beginning of P to beginning of QRS in the frontal
plane)
Normal: 0.12 - 0.20s
Differential Diagnosis of Short PR: < 0.12s
Preexcitation syndromes:
WPW (Wolff-Parkinson-White) Syndrome: An accessory pathway
(called the "Kent" bundle) connects the right atrium to the right
ventricle (see diagram below) or the left atrium to the left ventricle,
and this permits early and slow activation of the ventricles (a delta
wave) and a short PR interval (see diagram below for example).
LGL (Lown-Ganong-Levine) Syndrome: An AV nodal bypass track
into the His bundle exists, and this permits early activation of the
ventricles without a delta-wave because the ventricular activation
sequence is unchanged; the PR interval, however, is shorter.
AV Junctional Rhythms with retrograde atrial activation (inverted P
waves in II, III, aVF): Retrograde P waves may occur before the QRS
complex (usually with a short PR interval), within the QRS complex (i.e.,
hidden from view), or after the QRS complex (i.e., in the ST segment). It all
depends upon the relative timing from the junctional focus antegrade into
the ventricles vs. retrograde back to the atria.
Ectopic atrial rhythms originating near the AV node (the PR interval is
short because atrial activation originates closer to the AV node; the P wave
morphology is different from the sinus P and may appear inverted in some
leads); these are sometimes called “coronary sinus rhythms”.
Normal variant (PR 0.10 - 0.12s): seen in kids and adolescents
14
Differential Diagnosis of Prolonged PR: >0.20s
First degree AV block (PR interval is usually constant from beat to
beat); possible locations for the conduction delay include:
Intra-atrial conduction delay (uncommon)
Slowed conduction in AV node (most common site of prolonged
PR)
Slowed conduction in His bundle (rare)
Slowed conduction in one bundle branch (when the contralateral
bundle is totally blocked; i.e., 1st degree bundle branch block)
Second degree AV block (some P waves do not conduct to ventricles
and are not followed by a QRS; PR interval may be normal or
prolonged)
Type I (Wenckebach): Increasing PR until nonconducted P wave
occurs
Type II (Mobitz): Fixed PR intervals plus nonconducted P waves
AV dissociation: Some PR's may appear prolonged, but the P waves and
QRS complexes are dissociated (i.e., not married, but strangers passing in
the night).
2. QRS Duration (duration of QRS complex in frontal plane):
Normal: 0.06 - 0.10s
Differential Diagnosis of Prolonged QRS Duration (>0.10s):
QRS duration 0.10 - 0.12s
Incomplete right or left bundle branch block
Nonspecific intraventricular conduction delay (IVCD)
Some cases of left anterior or left posterior fascicular block
QRS duration 0.12s
Complete RBBB or LBBB
Nonspecific IVCD
Ectopic rhythms originating in the ventricles (e.g., ventricular
tachycardia, accelerated ventricular rhythm, pacemaker rhythm)
3. QT Interval (measured from beginning of QRS to end of T wave in the frontal
plane; corrected QT = QTc = measured QT sq-root RR in seconds; Bazet’s formula)
Normal QT is heart rate dependent (upper limit for QTc = 0.46 sec)
Long QT Syndrome: LQTS (based on corrected QTc: QTc 0.45 sec for
males and 0.46 sec in females is diagnostic for hereditary LQTS in the
absence of other causes of long QT):
This abnormality may have important clinical implications since it usually
indicates a state of increased vulnerability to malignant ventricular
arrhythmias, syncope, and sudden death. The prototype arrhythmia of the
Long QT Interval Syndromes (LQTS) is Torsade-de-pointes, a polymorphic
ventricular tachycardia characterized by varying QRS morphology and
amplitude around the isoelectric baseline. Causes of LQTS include the
following:
Drugs (many antiarrhythmics, tricyclics, phenothiazines, and
others)
Electrolyte abnormalities (↓ K+, ↓ Ca++, ↓ Mg++)
CNS disease (especially subarachnoid hemorrhage, stroke, head
trauma)
Hereditary LQTS (at least 7 genotypes are now known)
Coronary Heart Disease (some post-MI patients)
Cardiomyopathy
15
Short QT Syndrome (QTc <0.32 sec): Newly described hereditary disorder with
increased risk of sudden arrhythmic death. The QTc criteria are subject to change.
4. Frontal Plane QRS Axis
Normal: -30 degrees to +90 degrees
Abnormalities in the QRS Axis:
Left Axis Deviation (LAD): > -30°(i.e., lead II is mostly 'negative')
Left Anterior Fascicular Block (LAFB): rS complex (i.e., small r, big S)
in leads II, III, aVF, small q in leads I and/or aVL, and -45 to -90
(see ECG on p 8); in LAFB, the S in lead III is > S in lead II, and the
R in aVL is > R in aVR. This differentiates LAFB from other causes of
LAD with rS complexes in II, III, aVF (e.g., COPD)
Some cases of inferior MI with Qr complex in lead II (making lead II
'negative')
Inferior MI + LAFB in same patient (QS or qrS complex in II)
Some cases of LVH
Some cases of LBBB
Ostium primum ASD and other endocardial cushion defects
Some cases of WPW syndrome (large negative delta wave in lead II)
Right Axis Deviation (RAD): > +90° (i.e., lead I is mostly 'negative')
Left Posterior Fascicular Block (LPFB): rS complex in lead I, qR in
leads II, III, aVF (however, must first exclude, on clinical basis,
causes of right heart overload; these will also give same ECG picture
of LPFB)
Many causes of right heart overload and pulmonary hypertension
High lateral wall MI with Qr or QS complex in leads I and aVL
Some cases of RBBB
Some cases of WPW syndrome
Children, teenagers, and some young adults
Bizarre QRS axis: +150° to -90° (i.e., lead I and lead II are both
negative)
Consider limb lead error (usually right and left arm reversal)
Dextrocardia
Some cases of complex congenital heart disease (e.g., transposition)
Some cases of ventricular tachycardia
16
5. ECG RHYTHM ABNORMALITIES
THINGS TO CONSIDER WHEN ANALYZING ARRHYTHMIAS:
Arrhythmias may be seen on 12-lead ECGs or on rhythm strips of one or more leads.
Some arrhythmias are obvious at first glance and don't require intense analysis. Others,
however, are more challenging (and often more fun)! They require detective work, i.e.,
logical thinking. Rhythm analysis is best understood by considering characteristics of
impulse formation (if known) as well as impulse conduction. Here are some things
to consider as originally conceptualized by Dr. Alan Lindsay:
Descriptors of impulse formation (i.e., the pacemaker or region of
impulse formation)
Site of origin - i.e., where does the rhythm originate?
Sinus Node (e.g., sinus tachycardia; P waves may be hidden in
the preceding T waves at very fast rates)
Atria (e.g., PACs, ectopic atrial rhythms, etc.)
AV junction (e.g., PJCs and junctional rhythms)
Ventricles (e.g., PVCs)
Rate (i.e., relative to the expected rate for that pacemaker location)
Accelerated - faster than expected for that pacemaker site (e.g.,
accelerated junctional rhythms @ HR‟s 60-100 bpm)
Slower than expected (e.g., marked sinus bradycardia, 38 bpm)
Normal (or expected) (e.g., junctional escape rhythm, 45 bpm)
Regularity of ventricular and/or atrial response
Regular (e.g., paroxysmal supraventricular tachycardia - PSVT)
Regular irregularity (e.g., ventricular bigeminy)
Irregular irregularity (e.g., atrial fibrillation or MAT)
Irregular (e.g., multifocal PVCs)
17
Onset (i.e., how does arrhythmia begin?)
Active onset (e.g., PAC or PVC, PSVT)
Passive onset (e.g., ventricular escape beat or rhythm)
Descriptors of impulse conduction (i.e., how does the abnormal
rhythm conduct through the heart chambers?)
Antegrade (forward) vs. retrograde (backward) conduction
Conduction delays or blocks: i.e., 1st, 2nd (type I or II), 3rd degree blocks
Sites of potential conduction delay
Sino-Atrial (SA) block (one can only recognized 2nd degree SA
block on the ECG; i.e., an unexpected failure of a sinus P-wave
to appear, resulting in a pause in rhythm)
Intra-atrial delay (usually recognized as a widened P wave)
AV conduction delays (common)
IV blocks (e.g., bundle branch or fascicular blocks)
Now let's continue with some real rhythms…………..
I. Supraventricular Arrhythmias
Premature Atrial Complexes (PAC's)
Occur as single or repetitive events and have unifocal or multifocal origins.
The ectopic P wave (often called P') is often hidden in the ST-T wave of the
preceding beat. (Dr. Henry Marriott, master ECG teacher and author, likes to
say: "Cherchez le P" which, in French, means: "Search for the P” (on the T
wave), and it's clearly sexier to search in French!)
The P'R interval can be normal or prolonged if the AV junction is partially
refractory at the time the premature atrial impulse enters it.
PAC's can have one of three different outcomes depending on the degree
of prematurity (i.e., coupling interval from previous P wave), and the
preceding cycle length (i.e., RR interval). This is illustrated in the "ladder"
diagrams where normal sinus beats are followed by three possible PACs
(labled a,b,c,d in the diagram below):
18
Outcome #1. Nonconducted (or blocked) PAC; i.e., no QRS
complex because the early PAC finds the AV node still refractory
to conduction. (see PAC 'a' in the upper diagram labeled 1 (p18),
and the nonconducted PAC in ECG shown below (arrow); note
that it‟s hidden and slightly distorts the ST-T wave)
Outcome #2. Conducted with aberration; a PAC conducts to
the ventricles but finds one of the 2 bundle branches or one of
the LBB fascicles refractory. The resulting QRS is usually wide,
and is sometimes called an Ashman beat (see PAC 'b' in the
upper diagram, p18, and the V1 rhythm strip below showing a
PAC with RBBB aberration; note the PAC in the T wave (arrow).
Outcome #3. Normal conduction; i.e., similar to other QRS
complexes in that ECG lead. (See PAC 'c' and „d‟ in the diagram on
p18)
In the lower ladder diagram (p18), labeled „2‟, the cycle length has increased
(slower heart rate). This results in increased refractoriness of all the structures in
the conduction system. PAC 'b' now can't get through the AV node and is
nonconducted; PAC 'c' is now blocked in the right bundle branch and results in
a RBBB QRS complex (aberrant conduction); PAC 'd' occurs later and conducts
normally. RBBB aberration is generally more common because the right bundle
normally has a slightly longer refractory period (RP) than the left bundle. In
diseased hearts either bundle branch or a left bundle fascicle may have the
longest RP and account for the aberration in QRS waveform.
Therefore, the fate of a PAC depends on both 1) the coupling interval
from the last P wave, and 2) the preceding cycle length or heart rate.
The pause after a PAC is usually incomplete; i.e., the PAC actually enters the
sinus node and resets its timing, causing the next sinus P to appear earlier than
expected. (PVCs, on the other hand, are usually followed by a complete pause
because the PVC usually does not perturb the sinus node timing; see ECG below
and the diagram on page 27.)
19
“Incomplete” pause: The PP interval surrounding a PAC is less than 2 normal PP
intervals (because the PAC reset the sinus timing)
“Complete” pause: The PP interval surrounding the PVC is equal to 2 normal PP
intervals because the sinus continued to fire at its normal rate even though it didn‟t
conduct to the ventricle (see the sinus P hidden in the T wave of the PVC).
Premature Junctional Complexes (PJC's)
Similar to PAC's in clinical implications, but less frequent.
The PJC focus in the AV junction captures the atria (retrograde) and the
ventricles (antegrade). The retrograde P wave may appear before, during,
or after the QRS complex; if before, the PR interval is usually short (i.e.,
<0.12s). The ECG tracing and ladder diagram shown below illustrates a
classic PJC with retrograde P waves occurring after the QRS.
20
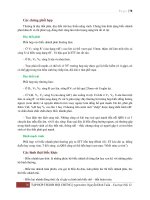
Atrial Fibrillation (A-fib):
Atrial activity is poorly defined; may see course or fine baseline undulations (wiggles)
or no atrial activity at all. If atrial activity is seen, it resembles the teeth on an old
saw (when compared to atrial flutter that often resembles a new saw or a clean
saw-tooth pattern especially in leads II, III, and aVF).
Ventricular response (RR intervals) is irregularly irregular and may be fast (HR
>100 bpm, indicates inadequate rate control), moderate (HR = 60-100 bpm), or
slow (HR <60 bpm, indicates excessive rate control medication, AV node disease, or
drug toxicity such as digoxin). Recent studies indicate that resting HR‟s <110 bpm
may be OK in atrial fibrillation, although not optimal.
A regular ventricular response with A-fib usually indicates high grade or complete AV
block with an escape or accelerated ectopic pacemaker originating in the AV junction
or ventricles (i.e., consider digoxin toxicity or AV node disease). In the ECG shown
below the last 2 QRS complexes are junctional escapes indicating high-grade AV block
due (note: the last two RR intervals are the same indicating the escape rate).
Irregularly-irregular SVT‟s may also be seen in atrial flutter with an irregular
ventricular response and in multifocal atrial tachycardia (MAT). The differential
diagnosis is often hard to make from a single lead rhythm strip; the 12-lead ECG is
best for differentiating these three arrhythmias (see p23).
21
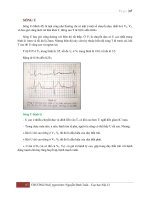
Atrial Flutter (A-flutter):
Regular atrial activity usually with a clean saw-tooth appearance in leads II, III, aVF,
and more discrete looking 'P' waves in lead V1. The atrial rate is usually about
300/min, but may be as slow as 150-200/min or as fast as 400-450/min. The above
ECG also shows LVH and left anterior fascicular block (LAFB).
Untreated A-flutter often presents with a 2:1 A-V conduction ratio. This a commonly
missed arrhythmia diagnosis because the flutter waves are often difficult to find.
Therefore, always think "atrial flutter with 2:1 block" whenever there is a
regular SVT @ approximately 150 bpm! (You aren‟t likely to miss it if you look for
it.). In the 12-lead ECG shown above both 2:1 and 4:1 ratios are seen.
The ventricular response may be 2:1, 3:1 (rare), 4:1, or variable depending upon AV
conduction properties. A-flutter with 2:1 block is illustrated in the rhythm strip below;
one of the flutter waves occurs at the end of the QRS (pseudo RBBB pattern). Atrial
rate =280 bpm, ventricular rate =140 bpm.
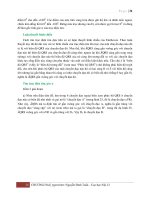
Ectopic Atrial Tachycardia and Rhythms
Ectopic, discrete looking, unifocal P' waves with atrial rates <250/min (not to
be confused with slow atrial flutter).
22
Ectopic P' waves usually precede QRS complexes with P'R interval < RP'
interval (i.e., not to be confused with paroxysmal supraventricular
tachycardia with retrograde P waves shortly after the QRS complexes).
The above ECG shows 3 beats of sinus rhythm, a PVC, a sinus beat, and the
onset of an ectopic atrial tachycardia (note the different P wave morphology)
Ventricular response may be 1:1 (as above ECG) or with varying degrees of
AV block (especially in the setting of digitalis toxicity).
Ectopic atrial rhythms are similar to ectopic atrial tachycardia, but with HR <
100 bpm. The ectopic „P‟ wave morphology is clearly different from the sinus
P wave.
Multifocal Atrial Tachycardia (MAT) and rhythm
Discrete, multifocal P' waves occurring at rates of 100-250/min and with varying P'R
intervals (one should see at least 3 different P wave morphologies in a given lead).
Ventricular response is irregularly irregular (i.e., often confused with A-fib).
May be intermittent, alternating with periods of normal sinus rhythm.
Seen most often in elderly patients with chronic or acute medical problems such as
exacerbation of chronic obstructive pulmonary disease.
If atrial rate is <100 bpm, call it multifocal atrial rhythm.
Look at lead V1 for the discrete multifocal P waves of MAT, and how other leads look just
like a-fibrillation (e.g., leads aVL and V4)
23
Paroxysmal Supraventricular Tachycardia (PSVT)
Basic Considerations: These arrhythmias are circus movement tachycardias that use
the mechanism of reentry; they are also called reciprocating tachycardias. The onset
is sudden, usually initiated by a premature beat, and the arrhythmia stops abruptly which is why they are called paroxysmal tachycardias. They are usually narrow-QRS
tachycardias unless there is preexisting bundle branch block (BBB) or aberrant ventricular
conduction (i.e., rate related BBB). There are several types of PSVT depending on the
location of the reentry circuit. The diagram below illustrates the mechanism for AV
nodal reentrant tachycardia, the most common form of PSVT.
AV Nodal Reentrant Tachycardia (AVNRT): This is the most common form of PSVT
accounting for approximately 75% of all symptomatic PSVTs. The above diagram
illustrates the mechanism involving dual AV nodal pathways, alpha and beta, with
different electrical properties. In the diagram alpha is a fast pathway but has a long
refractory period (RP), and beta is a slower pathway but with a shorter RP. During sinus
rhythm alpha is always used because it is faster, and there is plenty of time between
sinus beats for alpha to recover. An early PAC, however, finds alpha still refractory and
enters the slower beta pathway to reach the ventricles. As it slowly traverses beta,
however, alpha recovers allowing retrograde conduction back to the atria. The
retrograde P wave (sometimes called an atrial echo) is often simultaneous with or just
after the QRS and not easily seen on the ECG, but it can reenter the AV junction because
of beta's short RP and continue the tachycardia.
24
In the ECG shown above 2 sinus beats are followed by PAC (black arrow) that initiates
the onset of PSVT. Retrograde P waves (red arrow) immediately follow each QRS (seen
as a little dip at onset of ST segment)
If an early PAC is properly timed, AVNRT results as seen in the diagram on p24. Rarely,
an atypical form of AVNRT occurs with the retrograde P wave appearing in front of the
next QRS (i.e., RP' interval > 1/2 the RR interval), implying antegrade conduction down
the faster alpha, and retrograde conduction up the slower beta pathway.
AV Reciprocating Tachycardia (Extranodal bypass pathway): This is the second most
common form of PSVT and is seen in patients with the WPW syndrome. The WPW ECG, seen
in the diagram on p. 14, shows a short PR, a delta wave, and somewhat widened QRS.
This type of PSVT can also occur in the absence of the typical WPW pattern if the
accessory pathway only allows conduction in the retrograde direction (i.e.,
concealed WPW). Like AVNRT, the onset of PSVT is usually initiated by a PAC that
finds the bypass track temporarily refractory, conducts down the slower AV junction
into the ventricles, and reenters the atria through the bypass track. In this type of
PSVT retrograde P waves usually appear shortly after the QRS in the ST segment
(i.e., RP' < 1/2 RR interval). Rarely the antegrade limb for this PSVT uses the bypass
track, and the retrograde limb uses the AV junction; the PSVT then resembles a wide
QRS tachycardia and must be differentiated from ventricular tachycardia.
Sino-Atrial Reentrant Tachycardia: This is a rare form of PSVT where the reentrant
circuit is between the sinus node and the right atria. The ECG looks just like sinus
tachycardia, but the tachycardia is paroxysmal; i.e., it starts and ends abruptly.
Junctional Rhythms and Tachycardias
Junctional Escape Beats: These are passive, protective beats originating from
subsidiary pacemaker cells in the AV junction. The pacemaker's basic firing rate is 40-60
bpm; junctional escapes are programmed to occur whenever the primary pacemaker
(i.e., sinus node) defaults or the AV node blocks the atrial impulse from reaching the
ventricles. The ECG strip below shows sinus arrhythmia with two junctional escapes
(arrows). Incomplete AV dissociation is also seen during the junctional escapes.
25