establishment of quality cost system in scancom
Bạn đang xem bản rút gọn của tài liệu. Xem và tải ngay bản đầy đủ của tài liệu tại đây (1.58 MB, 55 trang )
HO CHI MINH CITY OPEN UNIVERSITY
UNIVERSITÉ LIBRE DE BRUXELLES
SOLVAY BRUSSELS SCHOOL OF
ECONOMICS & MANAGEMENT
MBQPM5
DONG VAN TIEP
ESTABLISHMENT OF QUALITY COST
SYSTEM IN SCANCOM
MASTER FINAL PROJECT
MASTER IN BUSINESS QUALITY AND PERFORMANCE MANAGEMENT
Ho Chi Minh City
(2016)
STATEMENT OF AUTHENTICATION
This final report has not been submitted for a degree or diploma in any other
universities. To my best knowledge and belief, the report contains no
materials previously published or written by another person except where
due reference is made in the report itself.
Signature of Student
Dong Van Tiep
Date: 23 April 2016
3
ACKNOWLEDMENT
This is the final report for Master in Business Quality and Performance
Management – Solvay Brussels School of Economics and Management.
The aim of this final report is to establish the quality cost system in
ScanCom Vietnam. The report is the combination of practical experiences of
furniture industry and quality subject studies.
I would like to take this opportunity to thank our Managing Director – Mr.
Edwin Van De Sloot who has supported me in providing me the important
data in cost management and as well as strong support from him to the
team to make the program moved forward.
4
CONTENT
1.
INTRODUCTION ................................................................................. 9
1.1.
Background ........................................................................................ 9
1.2.
The case of ScanCom ..................................................................... 10
1.2.1 Introduction to ScanCom ................................................................ 10
1.2.2 ScanCom’s General Quality Management Process ...................... 10
1.2.3 How quality performance is reviewed and measured in
ScanCom? .................................................................................................. 11
2.
COST OF QUALITY .......................................................................... 15
2.1.
Quality ............................................................................................... 15
2.2.
History and Definition of Cost of Quality (COQ) ........................... 16
3.
IMPLEMENTATION OF QUALITY COST PROGRAM IN SCANCOM:
........................................................................................................... 22
3.1.
Delimitations .................................................................................... 22
3.2. Challenges/difficulties anticipated during the implementation of
Cost of Quality System in ScanCom: ...................................................... 23
3.3.
ScanCom Goals for the implementation of Quality Cost Program .
........................................................................................................... 23
3.4. Implementation steps for the Cost of Quality Program in
ScanCom .................................................................................................... 24
3.4.1. Gain top management commitment ............................................... 24
3.4.2. Constitute the Quality Cost Team: ................................................. 26
3.4.3. Quality Cost Categories .................................................................. 26
3.4.4. Data collection ................................................................................. 27
3.4.5. Collecting Quality Cost Data .......................................................... 28
3.4.6. Quality Cost Data Analysis ............................................................. 31
3.4.7. Build up an improvement proposal plan ...................................... 32
5
3.4.9. Kick-off Meeting for the Implementation of Quality Cost
System .................................................................................................... 32
3.4.10. Quality Cost Training ................................................................ 33
3.4.11. Periodic review of quality costs .............................................. 33
REFERENCES
APPENDICES
6
TABLE OF FIGURE , APPENDIX
No Figure
1
2
Figure 1
Figure 2
3
Figure 3
Figure 4
Figure 5
Figure 6
Figure 7
Figure 8
Figure 9
Figure 10
Figure 11
Figure 12
Figure 13
Figure 14
Figure 15
Appendix 1
CONTENT
PAGE
ScanCom’s top 10 customer claims review
In-line quality inspection reported by the
factories
Final quality inspection reported by the Final
Control Inspector
10
11
In-line quality inspection reported by the factories
12
15
The classification of CoPQ according to
Feigenbaum (1991)
The iceberg of visible and invisible costs
(Krishnan, 2006)
Juran’s Quality Cost Curve
Six Sigma value chart
Quality Cost Categories Applied in ScanCom
ScanCom example of standard rework cost
the maturity level of Quality Cost
the monthly quality cost report to be presented in
QA Monthly Update
16
16
23
25
27
29
32
an example of future quality report for the quality
cost categories in ScanCom
Multiple-Period Trend Graph of individual quality
cost categories
32
IKEA Product Quality Definition
34
38
flow chart of ScanCom Quality Assurance
System
Appendix 2 T
ThThe survey on understanding of Quality Cost
for furniture manufacturers
Appendix 3
11
The rework plan form used in factories of
ScanCom
7
32
39
40
No Figure
Appendix 4
Appendix 5
Appendix 6
Appendix 7
Appendix 8
Appendix 9
CONTENT
PAGE
Loss analysis form used in factories of ScanCom
internal failure cost flowchart for in-line control
internal failure cost flowchart for final control
performance quality measurement in ScanCom
Invisible CoPQ
Classification of COPQ
8
41
42
43
44
44
45
1.
Introduction
This introduction gives the background of the chosen topic and investigates
the case of ScanCom
1.1.
Background
“If we can define it – we can measure it;
If we can measure it – we can analyze it;
If we can analyze it – we can control it;
If we can control it – we can improve it”
(Dahlgaard et. al., 1998, in Krishnan, 2006, p 99)
In the outdoor furniture market today with more and more competition, most
furniture manufacturers are challenged to offer the high quality product to
their customers at the low cost.
Previously many companies had believed that high quality means high
costs, while actually it is the poor quality that costs. Therefore, the term of
Quality Cost becomes more and more important.
Since ScanCom was established in 1995, the quality cost has not been
measured, collected and reported in a correct way. Also ScanCom has a
very limited knowledge on Quality Cost; therefore the understanding of
context is unknown.
It is difficult for us to benchmark the goals of our Quality Cost Program as
when looking into other companies in the same industry in Vietnam; we
realize that most of companies have not implemented the quality cost
management system.
According to the quick survey done in March 2016 by ScanCom Quality
Assurance Department for 8 outdoor furniture companies in Vietnam, 100%
says the knows about Quality Cost, 62.5% says they are applying a Quality
Cost System and 37.5% says they are not, 50% thinks their quality cost is
less than 10% of total production cost and 50% believes their quality cost is
from 15%-20% of total production cost. 100% says they are going to apply
the Quality Cost System in the future; however, none of them has a full
understanding of what the quality cost is.
9
1.2.
The case of ScanCom
1.2.1 Introduction to ScanCom
Founded on the 1st April 1995, ScanCom has grown to become one of the
leading manufacturers of outdoor furniture in the world. With legal
headquarters in Denmark and top management located in Ho Chi Minh City
Vietnam, ScanCom directly employs over 5000 people and over 15,000
people indirectly through contract manufacture.
ScanCom owned sales offices can be seen in Denmark, United Kingdom,
Germany, U.S.A and Vietnam with manufacturing sites in Brazil, Indonesia
and Vietnam.
We credit our achievements to attractive designs, high standards of quality
and social responsibility combined with precise delivery planning and
competitive prices. Always an active and responsible partner, ScanCom is
guided by a firm set of principles that guides us in everything we do.
Source: />1.2.2 ScanCom’s General Quality Management Process
There are five main processes in ScanCom Quality Assurance Management
Process 1: Incoming Control
- Evaluating and selecting suppliers
- Incoming material inspection
- Auditing suppliers
- Equipment Calibration
Process 2: In-line Control
Participating in making production processes
Reviewing and auditing production processes
Inspecting products before packing
Conducting training to QC inspectors and production staff
Making proposals for improving product quality and productivity
Following up on Corrective and Preventive Actions (CAPAs)
10
Process 3: Final Control
Reviewing and updating quality handbook
Designing Final Control Plan
Conducting training to FC inspectors and relevant departments
Conducting pre-shipment inspection
Following up on CAPA
Process 4: System Audit
Conducting training on quality management system (QMS)
Being in charge of internal/external audits
Reviewing and updating key QMS procedures
Following up on CAPAs
Process 5: Quality Improvement
Conducting random audits for critical processes in mass-production
Suggesting product quality improvement during prototype meeting
Following up on FMEA implementation
Raise CAPAs for customer complaints
1.2.3 How quality
ScanCom?
performance
is
reviewed
and
measured
in
In ScanCom we are maintaining two important Quality Reviews; one is QA
Monthly Update and another one is Group Quality Review
QA Monthly Update:
Group QA Senior chairs this meeting with the participation of all Factory QA
Managers and other QA Managers in different areas such as final control,
incoming control, and system audit and quality improvement.
The purpose of this meeting is to follow up the quality performance of all
factories, the major quality problems happening in the month and what
corrective action and preventive action which have been done to correct the
problem as well as to prevent the problem from happening again in the
future. The quality problems include quality issues happening in the
factories and quality claims received from customers.
11
The meeting also is to highlight the major quality systematic problems in
ScanCom and propose action plan for them if any. Normally the quality
systematic problems are found during internal audit program or random
audits of production processes.
Besides, the supplier quality performance is also reviewed in the meeting.
Quality Incoming Manager is responsible for monitoring the quality
performance of suppliers and proposes the action plan to enhance their
performance
Group Quality Review
This meeting is conducted quarterly and chaired by Group CEO. The
attendees include Group CEO, Group Finance Director, Group Commercial
Director, ScanCom Managing Directors, and Group QA Senior Manager.
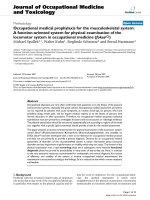
In the meeting, Group QA Senior Manager will report the quality
performance of ScanCom to the executive team. Top ten customer claims
will be discussed in a detailed way; the executive team always requires
detailed corrective action and preventive action for each quality problem
complained by customers.
Figure1: ScanCom’s top 10 customer claims review
Source: ScanCom Quality Assurance Department
12
More importantly, the meeting is to discuss about the quality strategy in the
future by looking into the current quality trend in ScanCom.
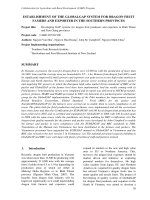
The quality performance is mostly measured basing on the inspection
results of inline inspection and final inspection as specified below:
Inline inspection (100% control): The formula for defect rate is the
amount of defective products found divided by the number of total
amount of products inspected. For example, if 10 chairs out of 200
inspected chairs are defective, the defect rate is 10/200 = 5%.
Figure 2: In-line quality inspection reported by the factories
Source: QA Monthly Report, Quality Assurance Department, ScanCom
Vietnam
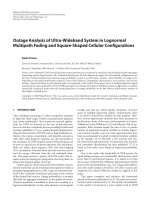
Final inspection (AQLsample size: Critical 0.0, Major 1.5, Minor 4.0):
The formula for defect rate is the amount of defective batches found
divided by the number of total amount of batches inspected. For
example, if 03 batches out of 100 inspected batches are defective,
the defect rate is 03/100 = 3%. The failed batches must be analyzed
in details (percentage of reject points and improvement points) to set
up a proper rework plan.
Figure 3:
Inspector
Final quality inspection reported by the Final Control
13
Source: QA Monthly Report, Quality Assurance Department, ScanCom
Vietnam
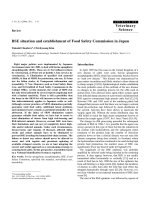
In monetary term of quality performance, ScanCom only maintains
the measurement and follow-up of external failure cost which is being
well-managed through the company’s Axapta system.
Figure 4: In-line quality inspection reported by the factories
Source: QA Monthly Report, Quality Assurance Department, ScanCom
Vietnam
Source: Group Quality Review, Quality Assurance Department, ScanCom
Vietnam
In conclusion, in the past 21 years since it was established in 1995,
ScanCom has not approached and implemented any Quality Cost Program
which is to improve the bottom line or to increase the company’s competitive
advantage.
The outdoor furniture market becomes more and more competitive in term
of pricing, our customers always ask for the high quality product with same
or even cheaper price. Another challenge for ScanCom is that there are
more Chinese furniture manufacturers who are capable of supplying good
quality products with cheap prices due to their proactive investment in
advanced technology of furniture manufacturing.
According to the Business Strategy (Period 2016-2018) presented by
ScanCom Managing Director in Jan 2016, one of the key action plans is to
improve the cost competiveness through continual quality improvement.
14
For this reason, Quality Cost Program will be established to support the
Company Business Strategy.
According to direct interview with some members in the Quality Assurance
Department, most of them think the Cost of Quality is just the quality failure
found during mass production and quality failures detected and claimed by
customers.
Therefore, one of the most important tasks before getting the Quality Cost
program implementation is to train the relevant on the awareness of quality
cost and their categories.
2. Cost of Quality
2.1.
Quality
How quality is defined in ScanCom today?
We follow the philosophy of H.L. Gilmore (defined in Product Conformance
Cost. Quality progress June 1974)
“Quality is the degree to which a specific product conforms to a design or
specification" and the defect is categories into three different levels
Critical defect: A defect that is likely to result in a hazardous or
unsafe condition for an individual using the product, or is
contravening mandatory regulations.
Major defect: A defect that seriously affects the appearance,
performance, durability, or functionality of the product and will
result in customer dissatisfaction – and very likely a claim.
Minor defect: A workmanship defect which is beyond the defined
quality standard – it does not reduce product usability, but affects
appearance, performance or durability, and may affect salability at
full price.
Definition of Quality according to “Quality Gurus”
Quality consists of the capacity to satisfy wants.
(C.D. Edwards, "The Meaning of Quality", in Quality Progress Oct.1968)
Quality is fitness for use.
(J.M. Juran, ed. Quality Control Handbook 1988)
15
Quality is the degree to which a specific product conforms to a design or
specification
(H.L. Gilmore: Product Conformance Cost. Quality progress June 1974)
Quality means conformance to requirements.
(P.B. Crosby: Quality Is Free)
Quality is the degree of excellence at an acceptable price and the control of
variability at an acceptable cost.
(R. A. Broh: Managing Quality for Higher Profits, 1982)
2.2. History and Definition of Cost of Quality (COQ)
COQ History
Philip Crosby once said “Money is the language of management; you need
to show them the numbers.”
This was true when he first said it many years ago & it’s even truer today as
industries have become more competitive & complex.
Joseph Juran also understood the important link between Money & Quality
when he introduced the concept of Quality Cost in his first edition of the
Quality Control Handbook published in 1951.
The concept was further expanded on by Armand Feigenbaum in his 1956
Harvard Business Review essay Total Quality Control when he introduced
the 4 Quality Cost Categories that are commonly referred to today.
Since then, the Cost of Quality concept has been continuously improved
into a fully developed financial model that has many strategic benefits.
COQ Definition
According to Juran’s Quality Control Handbook:
Quality costs are the costs associated with preventing, finding, and
correcting defective work. These costs are huge, running at 20% - 40% of
sales. Many of these costs can be significantly reduced or completely
avoided. One of the key functions of a Quality Engineer is the reduction of
the total cost of quality associated with a product.
Source: Gryna, F. M. “Quality Costs” in Juran, J.M. & Gryna, F. M. (1988,
4th Ed.), Juran’s Quality Control Handbook, McGraw-Hill, page 4.2.
According to Harrington (1987, p 5):
COQ as “all the cost incurred to help the employee do the job right every time and
cost of determining if the output is acceptable, plus any cost incurred by the
16
company and the customer because the output did not meet specifications and/or
customer expectations”.
According to Jack Campanella, he defined in Principles of Quality Costs
as:
The difference between the actual cost of a product or service, and what
the reduced cost would be if there was no possibility of substandard
service, failure of products, or defects in their manufacture.
Over the last several decades, quality costs have been divided into several
categories. The most commonly accepted and comprehensive definitions
have categorized quality cost as prevention, appraisal and failure costs.
Failure costs are usually split into internal failure costs and external failure
costs, bellows are specific definitions of these terms:
Prevention Cost – costs associated with activities specifically designed to
prevent poor quality in products.
Appraisal Cost – costs associated with activities specifically designed to
measure, inspect, evaluate or audit products to assure conformance to
quality requirements.
Internal Failure Cost – costs incurred when a product fails to conform to
a quality specification before shipment to a customer.
External Failure Cost – costs incurred when a product fails to conform to
a quality specification after shipment to a customer.
The Total Quality Cost then is simply the sum of all these cost
categories; Prevention, Appraisal, & Failure Costs (Internal & External).
Figure 5: The classification of CoPQ according to Feigenbaum (1991)
Visible and invisible Cost of Poor Quality
CoPQ can be more or less difficult to identify (Krishnan, 2006), therefore
Feigenbaum (1991), Gryna (1999), Dale and Plunkett (1991) and Giakatis et. al.
(2001) separate the CoPQ into visible and invisible costs regardless of
classifications, stating that visible CoPQ are easy to identify and measure while
invisible CoPQ is difficult to identify and measure. Stated by Krishnan (2006)
17
visible and invisible CoPQ can be visualized as an iceberg, where only a little
amount of the costs can be seen and the rest is hidden under the water, see
figure 3.2. Most often, only visible CoPQ are taken into consideration when talking
about poor quality, thus omit the other costs (Krishnan, 2006). However, when the
data for invisible costs are credible or manageable, and where estimations can be
done, those costs should be included as visible costs (Gryna, 1999).
Figure 6 – The iceberg of visible and invisible costs (Krishnan, 2006)
In 1999, Juran published the 5th addition of Juran’s Quality Handbook. In it
he included the following depiction of the Quality Cost Curve.
Figure 7: Juran’s Quality Cost Curve
This is super important – so the X-Axis is the Quality Level which moves
from 0% conformance on the left to 100% conformance on the right.
18
As you move from 0% conformance to 100% conformance the Prevention
& Appraisal Costs increase linearly. Similarly, the Failure Costs (Internal +
External) begin decreasing sharply.
Then, the Total CoQ (Cost of Quality), which is a sum of these two other
curves also decreases sharply.
One key conclusion that Juran is communicating with this graph is that the
Total CoQ is the lowest, when conformance is 100%. At this point, the Total
CoQ simply equals the Cost of Prevention & Appraisal.
Usage of Quality Costs
Quality costing can be u s e d as a lever t o gain top management
commitment to initiate an improvement project. Top managers
tend to be influenced by data expressed in monetary terms rather
than technical data such as defect rates. Their main area of
interest can be reflected as a strategic business objective in a
company. Their commitment is decisive for the success of a TQM
initiative because many r e s o u r c e s should be invested in quality
improvement projects. In addition to providing a communicating
bridge between line and top management, quality costing can
provide an overall index for managers to evaluate and monitor the
economics, effectiveness and efficiency of quality activities in their
organization. Quality c o s t i n g integrates all the separate quality
activities into a total q u a l i t y system. It forces the entire organization to
examine the performance of each quality activity in terms of costs.
Moreover, quality costing c a n be used as a starting point i n setting
up a quality system except where an organization already has one.
It should be also noted that the usefulness of CoQ reporting does not
have consensus in the literature. Three noted authors on quality
management (“gurus”), namely Deming, Crosby, and Juran, each
have a different attitude to CoQ reporting. Deming’s view is that
cost analysis for quality is a misguided waste of time and measuring
quality costs to seek optimum defect levels is evidence of failure
to understand the problem. Crosby argues that q u a l i t y costs
need to be meas ur ed , not f or management control, but f o r the
development of “quality” thinking within the organization. The more
popular approach is that of Juran who advocates the measurement
of costs on a periodic basis as a management control tool.
Implementation status of Quality Cost System in Mananufacturing
firms
Despite the interest of the academic community and the quality
consultants in CoQ models, the situation in the real world is
19
different. The results of numerous industry surveys or research
studies conf irm that CoQ i s not a widely used c o n c e p t . Quality
cost calculations are n o t c o m m o n even among the r e c i p i e n t s of
th e M a l c o l m Baldridge National Quality Award. On the other
hand, most examples confirm that quality improvement and cost
measurement processes bring about a huge reduction in a company’s CoQ.
In a research concerning Australian manufacturing firms, it is indicated that of the
136 respondents, 35 firms (25.7%) currently measure the cost of quality in some
firms. Among the remaining 101 firms which did not measure cost of quality, 37
firms (27.2%) indicated that they plan to implement a CoQ reporting system in
the future, and a further 64 firms (47.1%) had no plans to implement CoQ
reporting in the future.
In an earlier empirical research, Porter & Rayner studied twenty quality-oriented
manufacturing firms in the North of England. The survey revealed that only seven
(35%) of the sample made any attempt to monitor quality costs. Only “failure” or
“tangible factory” costs were recorded and all figures given appeared to involve
an element of estimation. Estimates ranged from 0.8% to 3% of turnover with a
mean of 1.9 % of turnover. Six companies estimated that such costs had fallen,
in one case from 6.5 % to 1.75 % of turnover. One firm claimed that failure
costs had increased from 0.5% to 0.8% of turnover since gaining certification.
This had been caused by the adoption of tighter specifications, resulting in more
internal rejections.
In 1995 a similar research was performed in 250 companies, in the
manufacturing sector, having a minimum of 50 employees. The situation
concerning CoQ was improved; 86 % of the companies responded, noted that
they did not use BS 6143 standard, however, 78% provided information about the
perceived total cost of quality within their company. It is also interesting to note
that only 59 % of the companies stated that they presented quality cost
information at management review meetings.
In general, very few studies establish an effective empirical relationship among
quality cost components and quality. This is because it is very difficult to observe
the quality data for a particular industrial segment unless firms agree to provide
the required data.
In 1994, Carr & Ponoemon study the relationships among quality cost
components by using 46 paper and pulp manufacturing mills in USA for a period
of 48 months. They observe the following relationships: internal failure is the
most expensive and prevention is the least expensive quality cost component,
the combination of internal and external failure costs is always higher than
prevention and appraisal costs, and the quality reject rate decreases with
increased volume output. Moreover, this study suggests that only internal
failure and external failure costs have a statistically significant
correlation with the level of quality. At the same time, Bell et al.
20
Estimate that q u a l i t y cost in the manufacturing industry is between
5 % and 25 % of sales.
In a recent report concerning a leading wire and cable company
results, partially in agreement with were obtained: The research,
initially, indicated the
statistically significant relationship between
quality and the combination of appraisal and prevention costs.
The final results significantly indicated the following: (i) There is an
inverse relationship between appraisal cost plus prevention cost and
failure cost; (ii) there is a direct relationship between appraisal cost
plus prevention cost and quality and (iii) there is an inverse
relationship between failure cost and quality.
The Goal & Benefits of a COQ Program
The ultimate goal of a COQ System is to reduce the total cost of quality –
which will result in increased profitability & quality for the organization.
This end goal is the foundation for all things Continuous Improvement.
A COQ Program can contribute to the overall increased profitability in the
following ways:
A COQ Program provides cost-benefit justification for needed Corrective
Actions & Improvement projects.
A COQ Program assists you in quantifying the costs associated with
inefficient or incapable processes that result in unwanted variation &
waste.
A COQ Program highlights the importance of Prevention activities as an
investment in cost avoidance, and as a method to reducing quality costs.
A COQ Program Prioritizes & aligns your quality efforts & activities with
your company’s financial goal of profitability.
A COQ Program highlights strengths & weaknesses of the Quality &
Manufacturing System.
A COQ Program reframes improvement opportunities into financial
benefits for ROI analysis.
A COQ Program exposes waste & other opportunities for improvement.
A COQ Program reminds all employees that their actions are always
contributing to the organizations Bottom Line, either positively or
negatively.
A COQ Program drives a holistic perspective to Continuous
Improvement by ensuring that the overall benefits of an improvement
project do not result in unintended consequences somewhere else in the
business.
Souce: />
21
Difficulties during the implementation of COQ
Lack of data or difficulties in collecting data, lack of cooperation from top
management and lack of understanding of COQ principles are common
difficulties identified during the implementation of COQ reporting (Rodchua,
2009; Bamford and Land, 2006 and Elridge et al, 2006). Roden and Dale,
(2001), detailed out difficulties in collecting COQ data as below:
Firm culture and employee attitudes towards COQ system is not
conducive
Lack of information and accountability makes it difficult to collect COQ
data
Complexity in existing accounting system which unable to sort data
according to various divisions also make it difficult to measure COQ
data
Meanwhile Wan and Dale (2002) stressed the importance of
employees as well as firm culture in the implementation of COQ
reporting. This supported earlier findings by Roden and Dale (2001) that
employee responsiveness as well as the culture of the firm played
important roles in the success of COQ implementation. A study by
Arvaiova, M., Aspinwall and M.E., Walker, S.D. (2009) revealed that the
main difficulty faced by telecommunications organizations in the United
Kingdom during the setting up of COQ reporting system was to identify
new quality improvement opportunities. Interestingly, Bamford and Land
(2006) proposed some guidelines to ensure the success of COQ
implementation. The substance of the guidelines is as follows:
Senior management commitment is vital for the success of COQ
project and must be in place before it the implementation begins.
Use existing systems instead of trying to invent new methods for COQ
data collection.
Link COQ to other measures which give more relevance and impact.
Continually improve the COQ reporting system.
3. IMPLEMENTATION OF QUALITY COST PROGRAM IN SCANCOM:
3.1.
Delimitations
This final report delimits to only focus on factories of ScanCom Vietnam.
Therefore, none of the other factories in ScanCom Group were analyzed.
22
The scope of this final report is to investigate the quality cost of outdoor
furniture manufacturing. Further, the scope is defined from delivery of a
component from a supplier until the finished goods is passed to the Logistics
Warehouse for shipping to the customers. The supporting functions in terms of
HR and finance will not be included.
Further, the scope of the final report is to construct and test the given model
from the analysis. The final report can therefore be seen as “Pilot Quality Cost
Program” for further Quality Improvement Projects at ScanCom in the future.
Therefore, the final report delimits from providing the actual quality cost data as
well as a comprehensive evaluation for the suggesting implementation plans.
3.2. Challenges/difficulties anticipated during the implementation of
Cost of Quality System in ScanCom:
3.3.
Lack of cooperation with other departments
Difficulties in accessing to financial data
Difficulties in standardizing a corporate quality cost system
Lack of benchmarking opportunities and consultancy services
Lack of top management support
Difficulties in indentifying new quality improvement opportunities
Identification of activities that relate to quality
Difficulties in analyzing the data collected
Identification of quality cost items
ScanCom Goals for the implementation of Quality Cost Program
ScanCom determines that reducing the cost of quality is one of effective
way to improve the company’s profit. By establishing a measurable and
manageable quality cost system, we can provide a mean to correctly report
the quality cost to ScanCom top management and also to know where the
focused areas for prioritized action plan.
During the implementation of quality cost system, prevention cost many
increase, total quality cost will decrease by the reduction of the internal
failure and external failure cost.
“The core concept here is that more spending in the prevention area results
in lower spending in failure costs; lowered spending in prevention drives
higher failure costs (otherwise known as cost of poor quality or COPQ). To
date, the authors have found no companies where prevention and failure
costs correspond on a 1-to-1 basis. The usual finding is an 8-to-1 ratio, a
23
significant return on investment” Principles of Quality Cost – Forth Edition –
P8 – Douglas C.Wood.
“The goal of any quality cost system, therefore, is to facilitate quality
improvement efforts that will lead to operating cost reduction opportunities.
The strategy for using quality cost is quite simple: (1) take direct attack on
failure costs in an attempt to drive them to zero; (2) invest in the “right”
prevention activities to bring about improvement; (3) reduce appraisal costs
according to results achieved; and (4) continuously evaluate and redirect
prevention efforts to gain further improvement.
This strategy is based on the premise that:
For each failure there is a root cause
Causes are preventable
Prevention is always cheaper”
Source: Principles of Quality Cost – Forth Edition – P9 – Douglas
C.Wood.
3.4. Implementation steps for the Cost of Quality Program in
ScanCom
3.4.1. Gain top management commitment
Understanding the importance of top management commitment like other
improvement program, the cost quality will never be successful from the
bottom or middle of the organization, the presentation was prepared to give
a little knowledge on Cost of Quality and its benefits when being applied in
the organization. Besides, the presentation included some initial major
quality costs and revealed a lot of opportunities for improvements, which
should be sufficient to sell top management on need for implementing the
quality cost program.
The only measurable quality cost that ScanCom has been following up in
the past 05 years is external failure cost which is targeted as 0.5% of sales
turnover. Looking into more details of external failure, the improvement
opportunity is very obvious. The proposed action plan with deadlines was
also presented.
24
Top Management Group (TMG) was convinced and fully agreed with the
proposals of kicking off the quality cost program in ScanCom and has
nominated Group QA Senior Manager to take the lead in coordinating with
relevant departments to make it happen. TMG was really interested in the
monetary terms rather than quality data such reject rate during in-line
control or final control.
“Companies not already engaged in quality cost programs are unaware of
the magnitude of the quality cost dollar and its direct impact on their total
business. Most businesses are profitable, and the management may
believe that if business is profitable there is little need to look more closely
at expenses” Principles of Quality Cost – Forth Edition – P47 – Douglas
C.Wood.
One of the objectives of the quality cost program is to understand where
ScanCom is today with Cost of Quality. Below is Six Sigma value chart
which shows the Cost of Quality Level equivalent to the organization
capability.
SIGMA
DPMO
COPQ
6 Sigma
3.4
<10% of sales
5 Sigma
230
10 to 15% of sales
4 Sigma
6200
15 to 20% of sales
3 Sigma
67000
20 to 30% of sales
2 Sigma
310,000
30 to 40% of sales
CAPABILITY
World Class
Industry Average
Noncompetitive
1 Sigma
Figure 8: Six Sigma value chart. Source: www.sixsigmaspc.com
Edwin Van De Sloot – ScanCom Managing Director fully supported the
program and motivated it to be implemented in ScanCom. However after the
presentation, he came directly to the office of Group Senior QA Manager
and said that: “I actually like your presentation very much but I cannot
imagine that we are spending more than 10% of Sales Turnover (more than
90 USD millions) for quality costs, can you please prove that I am wrong”.
25
3.4.2. Constitute the Quality Cost Team:
As the leader in the Quality Cost Project, Group QA Senior Manager is
allowed to select qualified members from different functions to join the team.
The cross-functional team includes Group QA Senior Manager, Factory QA
Managers, Chief Accountant, Incoming Control Manager and Quality
Improvement Manager. There are many requirements necessary for the
team:
Knowledge of quality-related activities
Understand the financial statement/profit and loss
Willingness to take the challenges
3.4.3. Quality Cost Categories
The next is to allocate the existing costs to the COQ categories which are
prevention, appraisal, internal failure and external failure costs. The current
accounting system used in ScanCom today collect the cost data more than
is needed for calculating the total quality cost. Therefore ScanCom does not
require accounting system changes. But it is necessary train accounting
department on the knowledge of Quality Cost so that the particular cost can
be placed in the correct category identified in the Quality Cost System. It is
very important to make clear the role of accounting department. In the
“Executive guide to understanding and implementing Quality Cost Program”,
Douglas Wood highlighted the role of accounting in page 15 as below:
Match the quality cost definitions to other company cost structures
Ensure that methods of estimating costs are sound
Keep the quality cost system synchronous with other cost systems
a changes are made
Manage report production in an area that focuses on cost reporting
Help establish an internal quality cost procedure that maintain
year-to-year consistency
More importantly, running the quality cost program from the accounting will:
Provide the stamp of financial validity to the program
Assure that collection costs remain within practical limits
Set up a regular opportunity for dialogue between the accountings,
operation and the traditional quality function. It will help put both
the quality manager and the accounting in the flow of
communication to help the operations manager reduce the cost of
quality.
26