optimization of upper making process for cost reduction
Bạn đang xem bản rút gọn của tài liệu. Xem và tải ngay bản đầy đủ của tài liệu tại đây (283.34 KB, 35 trang )
HO CHI MINH CITY OPEN UNIVERSITY
UNIVERSITÉ LIBRE DE BRUXELLES
SOLVAY BRUSSELS SCHOOL OF
ECONOMICS & MANAGEMENT
MBQPM5
TRAN MINH PHUOC
OPTIMIZATION OF UPPER MAKING PROCESS FOR COST REDUCTION
MASTER FINAL PROJECT
MASTER IN BUSINESS QUALITY AND PERFORMANCE MANAGEMENT
Ho Chi Minh City
(2016)
Statement of Authentication
I hereby certify that all material within this report titled “Optimization of upper making
process for cost reduction” is accurate and reflect truly my knowledge, experience and
abilities. All information has not been presented or published by anyone else for assessment.
Signature:
Print name: Tran Minh Phuoc
Date: 19 April 2016
Acknowledgement
Firstly, I would like to express my gratitude to Professor Jacques Martin – General Director of
Solvay Brussels School of Economics & Management (Vietnam). He is pretty persistent in
providing me helpful advice and suggestions to my research of writing. He consistently asks
for my progress submission in order to keep me on track and complete my final report.
I would also like to thank production experts in my company who were providing me the ideas
to validate the feasibility of my optimization initiatives as well as help me collect the data to
understand the current state and future state of the manufacturing environment.
Lastly, I would be grateful to my parents who provide continuous support and encouragement
throughout the period of my study to complete my research and writing of this report. I would
say this is one of my biggest accomplishments and it has been being done thanks to them.
Glossary
DOE
Design of Experiment
PPH
Pair per Worker per Hour
TPM
Total Productive Maintenance
WIP
Work in Process
SOP
Standard Operation Procedure
List of figures
Figure 1:
Organization chart
Figure 2:
Fishbone diagram of cutting
Figure 3:
Fishbone diagram of 2nd process
Figure 4:
Fishbone diagram of stitching
Figure 5:
Bar chart of leather waste in 2014 and 2015
Figure 6:
Bar chart of synthetic waste in 2014 and 2015
Figure 7:
Bar chart of textile waste in 2014 and 2015
Figure 8:
Bar chart of embroidery efficiency rate in 2014 and 2015
Figure 9:
Bar chart of embossing efficiency rate in 2014 and 2015
Figure 10:
Bar chart of PPH of stitching in 2014 and 2015
Figure 11:
Bar chart of leather waste in 4 months of 2015 and 2016
Figure 12:
Bar chart of synthetic waste in 4 months of 2015 and 2016
Figure 13:
Bar chart of textile waste in 4 months of 2015 and 2016
Figure 14:
Bar chart of embroidery efficiency rate in 4 months of 2015 and 2016
Figure 15:
Bar chart of embossing efficiency rate in 4 months of 2015 and 2016
Figure 16:
Bar chart of PPH of stitching in 4 months of 2015 and 2016
List of tables
Table 1:
Raw data of material waste of cutting in 2014 and 2015
Table 2:
Raw data of efficiency rate of 2nd process in 2014 and 2015
Table 3:
Raw data of PPH of stitching in 2014 and 2015
Table 4:
Optimization proposals
Table 5:
Raw data of material waste of cutting in 4 months of 2015 and 2016
Table 6:
Raw data of efficiency rate of 2nd process in 4 months 2015 and 2016
Table 7:
Raw data of PPH of stitching in 4 months of 2015 and 2016
Table 8:
Optimization proposals
Table 9:
Saving
General Introduction
People are living in a fast pace changing of global business environment where the
competition is tougher than ever. A company would gain higher competitive advantage if they
can innovate their products, or lead the market in terms of price. Nike Vietnam is considered
as a leader in footwear in Vietnam with the reputation of one of the most innovative
companies. However, with the stronger competition and higher pressure from rivals who target
to lower the price to gain the market share, that being said, the company should try to keep the
price as reasonable as possible to not only produce best products, but also with good price. In
order to do that, optimization in manufacturing is one of the key drivers to lead the company
to that goal. The objective is to optimize the processes to reduce waste, increase efficiency in
production with the target of decreasing manufacturing cost to support the creation of good
retail price of final products.
The plan is to propose optimization ideas in manufacturing in November 2015 and the data
captured is from January to April 2016.
Contents
Chapter 1: Organizational Introduction ...................................................................................... 1
1.1
History .......................................................................................................................... 1
1.2
Mission ......................................................................................................................... 1
1.3
Organization structure .................................................................................................. 2
1.4
Difficulties and challenges Nike Vietnam are facing .................................................. 2
1.4.1
Inefficient manufacturing process ............................................................................ 2
1.4.2
Labor cost is increasing ............................................................................................ 2
1.4.3
The competition is tougher ....................................................................................... 2
1.5
Objective ...................................................................................................................... 3
Chapter 2: Analyze Inefficient Manufacturing Processes .......................................................... 4
2.1
Causes and effects of the issues ................................................................................... 4
2.2
Data collection and analysis of the inefficient process ................................................ 7
2.2.1
Cutting .................................................................................................................. 7
2.2.2
2nd process ........................................................................................................... 10
2.2.3
Stitching .............................................................................................................. 12
Chapter 3: Optimize the Inefficient Processes .......................................................................... 14
3.1
Optimization proposals .............................................................................................. 14
3.2
Apply proposed optimization ideas ............................................................................ 14
3.2.1
Cutting ................................................................................................................ 14
3.2.2
2nd process ........................................................................................................... 16
3.2.3
Stitching .............................................................................................................. 17
3.3
Data collection and analysis of optimized processes ................................................. 18
3.3.1
Cutting ................................................................................................................ 19
3.3.2
2nd process ........................................................................................................... 21
3.3.3
Stitching .............................................................................................................. 22
Conclusion ................................................................................................................................ 24
Reference .................................................................................................................................. 26
1
Chapter 1: Organizational Introduction
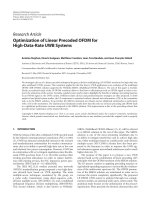
Nike is the world leading brand in the sporting goods industry operating globally, and Nike
Vietnam is one of its liaison offices. Nike Vietnam that was established 20 years ago has been
growing dramatically to become the biggest countries of Nike sourcing and manufacturing
operation, contributing roughly 50% in footwear and 16% in apparel globally with a wide
range of products such as sport shoes, apparels and sport equipment.
Nike Vietnam does not own production plants, they collaborate with factory partners to
manufacture products and with forwarders to distribute products to desired destinations. Every
year, 200 million pairs of Nike shoes are exported, 80 million units of apparels and equipment
are produced to serve the customers around the world. Nike Vietnam work and support factory
partners and forwarders to ensure the manufacturing operations run smoothly, efficiently and
effectively in terms of quality, productivity, cost and delivery.
On the occasion of 20 year anniversary, the Vietnam government honored Nike with a special
medal recognizing its socioeconomic contributions to the country. Nike is the first sport
footwear brand to receive this medal from the Vietnam government. Moreover, Nike Vietnam
also wins top honors as workplace in 2014 and 2015, particularly they were named No. 1 in
Apparel/Footwear Industry, on a list of the 100 best places to work in Vietnam. More than
9,000 professionals across industries all over Vietnam participated in the survey and
companies were measured on Total Reward, Growth Opportunity, Culture & Values,
Leadership, Work & Life Quality and Company Reputation.
1.1 History
1995 Nike Vietnam was established focusing on footwear manufacturing with
footwear factory partners
1997 The company started operating Apparel manufacturing and sourcing
2006 Nike Vietnam took over equipment manufacturing and sourcing from other
countries
2009 Nike Vietnam and Converse Vietnam were merged together to become united
organization.
2013 Vietnam became the biggest country for manufacturing and sourcing of Nike.
2015 Celebrate 20 year anniversary of Nike Vietnam
1.2 Mission
Bring inspiration and innovation to every athlete* in the world
*If you have a body, you are an athlete.
2
1.3
Organization structure
GM
Engineering
Director
Product
Director
Chemical
Director
Footwear
Director
Category
Director
Material
Director
Material
Manager
Apparel
Director
Planning
Director
HR
Manager
Admin
Manager
Production
Director
Quality
Director
Industrial
Director
Figure 1: Organization chart
1.4
Difficulties and challenges Nike Vietnam are facing
1.4.1
Inefficient manufacturing process
The manufacturing process in Nike production can manufacture high quality products, but it is
not running efficiently. For example, the waste material is around 30-40%, the machines are
not utilized 100% their capacity and consume high amount of energy. That leads to high
manufacturing cost and high retail price.
1.4.2
Labor cost is increasing
Footwear industry is a labor intensive industry, which requires hundreds of workers to produce
one pair of shoe from the beginning to the end. To meet the production demand of Nike
Vietnam, around 200000 workers hired to produce Nike Vietnam shoes. However, an increase
in wage has caused the increased labor cost in manufacturing and has put high pressure in
manufacturing cost and retail price.
1.4.3
The competition is tougher
Nike Vietnam has been facing a tough competition due to a rapid growth and a strong price
pressure from rivals from arch opponent Adidas to new competitor - Under Armour.
Especially, Vietnam is a market which the overall income is not so high, as a result, price is
3
one of the most critical factors that impact the customer’s decision before purchasing products.
Nike Vietnam’s product price is around 10% higher than its rivals. Besides that, the rivals
continue developing new products with new technology to attract customers. For example,
Adidas introduced Boost which was a revolutionary cushioning tech that delivered the highest
energy return in running products, while Under Armour launched The Speedform Gemini
product which has cushioning that hasn’t been used in any of the company’s earlier shoes.
These challenges could affect to the growth and position of Nike Vietnam in the market.
1.5 Objective
The inefficient manufacturing process and an increase in labor cost have contributed mainly to
the high manufacturing cost and high retail price. That would put high pressure on Nike
Vietnam since its competitors such as Adidas Vietnam and New Balance Vietnam have gained
the competitive advantage by producing the shoes with more reasonable price to catch the
attention of customers who are price sensitive, especially in Vietnam where the average
income is not so high. In order to compete with the competitors in price competition, it
requires Nike Vietnam to lower the retail price by reducing manufacturing cost. And to reduce
manufacturing cost, Nike Vietnam should accelerate process optimization and automation in
production to eliminate inefficient operations and reduce the number of manpower as well as
increase the productivity. There are specific processes that need to focus which are Cutting,
2nd Process such as Embroidery, Embossing and Stitching. That is a key point that leads me to
carry out this report titled “Optimization of upper making process for cost reduction”
4
Chapter 2: Analyze Inefficient Manufacturing Processes
2.1
Causes and effects of the issues
Cutting
Methods
Tools
No
clear
cutting
guidelines
Limitation
is
sharpness
of
cutting
dies
Material
waste
dies
machines
cutting
well-desgined
Old
Not
Methods
Tools
Figure 2: Fishbone diagram of cutting
There are several causes to material waste and inefficiency.
No clear guidelines for workers to cut efficiently
Previously, there are no clear standard guidelines to guide the workers how to cut efficiently,
they just do the job based on their experience. As a result, skilled workers can make cut more
components with less wasted material, compared to new workers who produce lots of material
waste.
Limitation in sharpness of cutting dies
A lot of cutting dies are made and adjusted by hand, therefore for some of the curved area,
those cutting dies cannot cut the material completely, and it requires 2nd cutting by special
cutting dies to cut to the desired shape. It is not only efficient (2nd cutting), but also waste in
material.
5
Not well designed cutting dies
Many components are cut by single cutting die, it means each time, only component is cut and
made. It is not efficient compared to multiple components can be cut at the same time. And
also, it would be risky in wrong nesting between components if the workers are not skilled
enough. They can place cutting die differently with what it should be done.
Old machines
There is a number of outdated cutting machines which are still being utilized in production.
Particularly, due to the construction and size of the machines, it is quite difficult to determine
clearly the material stretchiness, especially for leather material. As a result, workers cannot
place the material completely properly according to the stretchiness direction and that lead to
defective parts. Besides that, those types of machines also has lower cutting precision and that
is potential to cause material lost/waste due to the fact that lower cutting precision leads to
unqualified parts and material waste
2nd process
Methods
Man
Machines
are
not
set
up
properly
capacity
under
run
are
Machines
Methods
Operators
do
not
control
the
machine
well
well
machines
the
maintain
not
do
Operators
Low
efficiency
and
productivity
Man
Figure 3: Fishbone diagram of 2nd process
After using fish bone analysis, there are a number of causes to the inefficiency and low
productivity of 2nd process identified
6
Machines are run under their capacity
Operators do not control the machine well
Machines are not set up properly
Machines are not maintained well
Stitching
Methods
Manual
process
Low
PPH
flow
process
process
Unclear
Methods
stitching
Messy
Methods
Figure 4: Fishbone diagram of stitching
There are three main causes to the low efficiency of stitching process
Messy stitching process
The layout was not well organized where things were messy and not following 5S. As a result,
it caused the inefficiency since the following things were not ready and available even though
the previous stuff was already done.
Manual process
Stitching operation is a complex and labor intensive process. And the majority of the process
is still done by manually. Therefore, there is no surprise that this process need to be optimized
to increase the efficiency.
7
Unclear process flow
There was not clear process flow in stitching process, what should be the next destination after
the previous task is finished. Instead of going into one direction, it could run with multi
direction. Therefore, the efficiency is not high.
2.2
Data collection and analysis of the inefficient process
2.2.1
Cutting
2014
2015
Month
Material waste (%)
Material waste (%)
Leather
Synthetic
Textile
Leather
Synthetic
Textile
January
35
35
33
33
30
29
February
37
27
30
40
30
30
March
40
30
29
44
28
31
April
43
35
31
33
37
29
May
44
30
35
40
34
30
June
38
27
37
35
25
33
July
50
34
30
37
28
28
August
48
30
28
45
27
27
September
39
32
39
37
25
30
October
35
34
30
39
30
26
November
40
39
29
35
29
27
December
43
35
28
34
33
30
Average (%)
41.00
32.33
31.58
37.67
29.67
29.17
Table 1: Raw data of material waste of cutting in 2014 and 2015
8
60
50
40
2014
30
2015
20
2014
2015
10
0
Figure 5: Bar chart of leather waste in 2014 and 2015
45
40
35
30
25
2014
20
2015
15
2014
10
2015
5
0
Figure 6: Bar chart of synthetic waste in 2014 and 2015
9
45
40
35
30
25
2014
20
2015
15
2014
10
2015
5
0
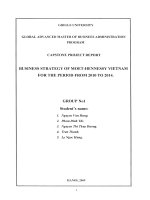
Figure 7: Bar chart of textile waste in 2014 and 2015
In order to capture the material waste in cutting, it is advised to categorize the waste in
different type of material used. And regarding to specific material, there are action plans to
improve the efficiency. According to the data collection, the average waste of leather in 2014
is 41% in 2014, compared to 37.67% in 2015. Whereas, the waste of synthetic in 2014 is
32.33%, in comparison to 29.67%. Lastly, that figure waste of textile in 2014 is 31.58% which
is a higher than 29.17% in 2015. The company had done improvement activities to decrease
the inefficiency from 2014 to 2015, but the waste figure is still high and need to lower down to
make the cutting process more efficient.
10
2.2.2
2nd process
Month
January
February
March
April
May
June
July
August
September
October
November
December
Average (%)
2014
2015
Efficiency rate (%)
Efficiency rate (%)
Embroidery Embossing Embroidery Embossing
80
85
82
89
78
84
79
85
80
80
77
87
75
77
81
85
77
80
82
82
82
79
80
84
79
83
83
86
74
82
78
79
81
80
80
85
75
86
78
83
72
82
80
85
83
80
80
87
78.00
81.50
80.00
84.75
Table 2: Raw data of efficiency rate of 2nd process in 2014 and 2015
84
82
80
78
76
74
72
70
2014
2015
2014
2015
68
66
Figure 8: Bar chart of embroidery efficiency rate in 2014 and 2015
11
90
88
86
84
82
80
2014
78
2015
76
2014
74
2015
72
70
Figure 9: Bar chart of embossing efficiency rate in 2014 and 2015
There are two main processes in supporting process (2nd process) which are embroidery and
embossing. These processes are run by machines with the control of operators. Normally, the
machine is designed to run with 100% efficiency and capacity, however, due to several
reasons, the machines do not run as well as expected. And the table and charts above show the
efficiency rate of those processes in 2014 and 2015. And based on the data, there will be
action plans to boost the efficiency.
12
2.2.3
Stitching
Month
January
February
March
April
May
June
July
August
September
October
November
December
Average (%)
2014
Pair/Worker/Hour
(PPH)
2
2.1
1.9
2
2.2
1.9
2.3
2
2.2
2
1.8
2.4
2.07
2015
Pair/Worker/Hour
(PPH)
2.2
2.1
2.4
2.3
2
2.3
2.5
2.5
2.4
2.1
2.2
2.6
2.30
Table 3: Raw data of PPH of stitching in 2014 and 2015
3
2.5
2
2014
1.5
2015
1
2014
2015
0.5
0
Figure 10: Bar chart of PPH of stitching in 2014 and 2015
The inefficient stitching process would lead to high waste in process (WIP), require higher
number of workers and as a result, the productivity is low. In order to measure the efficiency
rate of stitching, there is one standard measure that is PPH. PPH indicates the efficiency of
13
stitching line by taking the total output/ total workers/ total working hours. The data above
shows the PPH 2.07 and 2.3 in 2014 and 2015 respectively. With the labor cost is increasing,
there should be a plan to increase PPH to make the process more efficient.
14
Chapter 3: Optimize the Inefficient Processes
3.1
Process
Cutting
2nd
process
Optimization proposals
Causes
Optimization initiatives
No clear guidelines
for workers to cut
efficiently
Limitation in
sharpness of cutting
dies
Not well designed
cutting dies
Cutting machine is
out of date
Machines are run
under their capacity
Operators do not
control the machine
well
Machines are not set
up properly
Machines are not
maintained well
Messy stitching
process
Stitching
Set up clear SOP, guidelines with visible information to
show operators how to cut in the most efficient way
Using laser cut machine
Redesign cutting dies which is to group the die to cut
multiple components at the same time
Purchase new machines with higher efficiency
Run DOE (design of experiment) to figure out the
optimal setting of the machine to reach the peak capacity
Train and guide the operators follow the SOP strictly
Require machine technical experts to set up the
machines, create the SOPs, guidelines and require TPM
team to follow and supervise strictly the standard
Train the TPM team how to maintain the machine
properly according to the guideline from the suppliers
Relay out the process
Manual process
Unclear process flow
Apply computer stitching with pallet to increase the
efficiency and reduce manpower
Apply auto conveyor between 2 sides of the line to
strictly control the process flow
Table 4: Optimization proposals
3.2
Apply proposed optimization ideas
3.2.1 Cutting
Cutting has been considered as one of the processes that should be optimized and improved
the most. That is because it produces lots of waste in material and loss in efficiency. The most
efficient cutting method is to ensure that the yield rate is as high as possible based on how the
cutting dies can be placed to minimize the waste. Therefore, in order to gain higher efficiency
and material usage in cutting, there are several actions need to be done.
15
Set up clear SOPs, guidelines with visible information to show how to cut in the most
efficient way
Previously, there are no clear standard guidelines to guide the workers how to cut efficiently,
they just do the job based on their experience. As a result, skilled workers can make cut more
components with less wasted material, compared to new workers who produce lots of material
waste. Reducing material waste to save material cost is a prioritized task for Nike Vietnam
engineers. Understanding that using software to optimize the use of material is a proven
solution to reduce waste in the textile industry. Thus, they work with manufacturing partners
and an IT solution company to build exclusively software that can help to calculate and
provide the best nesting method which can bring the best possible efficiency. Thanks to the
new software, all the components are scanned in a scanning system and the software
automatically arrange and calculate the best efficient method with visible guideline for
workers to cut more efficiently.
Using laser cut machine
Laser cutting machine has been used for industrial manufacturing applications with a number
of advantages
Clean cut edges without burr or dust formation
Cutting of extremely fine contours and practically radius-free inner edges
Low thermal influence, i.e., no delamination
Cutting of various material thicknesses and combinations in one operation
No material deformation due to contactless material processing
High level of precision and positional accuracy of the cut edges due to automatic
recording
Maximum utilization of circuit boards because no space has to be kept free for
cutting channels
With these advantages, the use of laser cutting machine in manufacturing would probably help
the company gain more material yield, higher efficiency and less defects.
Redesign cutting dies, which is to group the die to cut multiple components at the same
time
Instead of using single cutting dies to cut single component each time, it is recommended to
redesign cutting dies which is to group single cutting dies to group dies that can cut a number
of components at the same time and also set up the most efficient nesting on the cutting dies.
16
That said single cutting dies will be connected according to the most efficient nesting to
prevent the workers from nesting inefficiently. This would not only reduce material waste, but
also increase the cutting efficiency and productivity.
Purchase new machines with higher efficiency
There are a number of outdated cutting machines which are still being utilized in production.
Particularly, due to the construction and size of the machines, it is quite difficult to determine
clearly the material stretchiness, especially for leather material. As a result, workers cannot
place the material completely properly according to the stretchiness direction and that lead to
defective parts – waste if the stretchiness is not correct. Besides that, those types of machines
also has lower cutting precision and that is potential to cause material lost/waste due to the fact
that lower cutting precision leads to unqualified parts and material waste. Therefore,
upgrading to new machines is a necessary action.
3.2.2 2nd process
2nd process has been playing a very critical role in creating more attractive design and building
eye catching features in finished products. However, it has been reported these machines at 2nd
process are under-utilized and consequently the efficiency and productivity are not as high as
expected. In order to boost the efficiency and productivity of 2nd process, the following actions
should be done.
Run DOE (design of experiment) to figure out the optimal setting of the machine to
reach the peak capacity
Running DOE is considered as` systematic method in figuring out the optimal setting of
machines that can reach their designed capacity based on specific. It is defined that DOE is a
systematic method to understand the relationship between factors affecting a process/machine
and the output of that process/machine. In other words, it is used to assess the input factors
and find cause-and-effect relationships that are critical to the output in order to be optimized
(Khan, n.d, 2013). For example, we have figure the optimal setting for no-sew pressing
process (a part on 2nd process) which is as below in order to gain perfect bonding
o Pressure: 5.5kg/cm2
o Time: 30 seconds
o Temperature: 145oC
Require machine technical experts to set up the machines, create the SOPs, guidelines
and require TPM team to follow and supervise strictly the standard