the goal definition of energy saving base on establishmentenergy management system following guideline of iso 50001 2011
Bạn đang xem bản rút gọn của tài liệu. Xem và tải ngay bản đầy đủ của tài liệu tại đây (1.33 MB, 46 trang )
HO CHI MINH CITY OPEN UNIVERSITY
UNIVERSITÉ LIBRE DE BRUXELLES
SOLVAY BRUSSELS SCHOOL OF
ECONOMICS & MANAGEMENT
MBQPM5
CHAU MAI LOAN
THE GOAL DEFINITION OF ENERGY
SAVING BASE ON ESTABLISHMENT
ENERGY MANAGEMENT SYSTEM
FOLLOWING GUIDELINE OF ISO 50001-2011
MASTER FINAL PROJECT
MASTER IN BUSINESS QUALITY AND PERFORMANCE MANAGEMENT
Page 1 of 45
UNDERTAKING CONFIRMATION
I confirm that master project work title “The goal definition of energy saving base
on establishment Energy Management System following guideline ISO
50001:2011” is my own work. Project contains and development are not previous
document of any person except for reference document and acknowledgment
mentioned.
Signature of student.
Châu Mai Loan
25 Apr, 2016
Page 2 of 45
ACKNOWLEDGMENTS
First of all, I sincerely thank very much all MBQPM professors: Mr. Philippe
Debroux, Mr. Jean-Philippe Pireaux, Mr. Rohan Wright, Mr. Le Quang An, Mr.
Michel Brotto, Mr. Pierre Crapanzano, Mr. Gaetan Dartevelle, Mr. Paolo Braguzzi,
Ms. Antigoni Papadimitriou & Mr. David Vallat, Mr. Jacques Martin for training &
sharing the useful and positive knowledge to my business.
Moreover, I would like to thank Management Boards of Open University and
Solvay Brussels have approved and opened this course with subjects to be
supported intensive management knowledge.
I also thank my classmate of MBQPM 5 for discussion and group work together
under good team spirit during last time. Beside I would like to thank administration
team Ms Hien & Ms Ha of MBQPM for support and information relevant to each
subject in time.
Special and sincerely thank to Professor Mr. Jacques Martin for helpful
recommendation in class time and my final project.
Now I am preparing for report of final project. In my final project, I have mentioned
definition of goal energy saving base on establishment energy management
system following ISO 50001:2011. There are two steps: Technical development
and management development.
Technical development is issued the equipment list of significant energy using to
meet Pareto rule 80:20 for control electric consumption
Management development is issued the objectives and target is compliance with
SMART. However, something may be still missing and not perfect. Please help me
to share your recommendation.
Thank you very much again.
In closing, I wish you all the best
Page 3 of 45
TABLE CONTENTS
No.
Contents
Page
1
LIST OF ABBREVIATION AND/OR SYMBOLS
4
2
COMPANY INTRODUCTION
5
3
THE KEY MANUFACTURING PROCESS
7
4
SWOT ANALYSIS FOR ENERGY
8
5
DEVELOPMENT THE ENERGY MANAGEMENT SYSTEM
10
6
CONCLUSION
22
7
REFERENCE DOCUMENT
23
8
APPENDIX
24
Page 4 of 45
1- LIST OF ABBREVIATION AND/OR SYMBOLS:
-
Abbreviation list of job & business:
S.E.A: Southeast ASEAN.
SHE-Main: Safety, Health, Environment and Maintenance.
QMS: Quality Management System.
Dept.: Department.
SC, QC, QA, Pro & WH: Supply Chain, Quality Control, Quality Assurance,
Production & Warehouse.
BMR: Batch Manufacturing Record.
PIC: Personal in charge.
CIP: Cleaning and sanitizing in place.
RM: Raw material & PM: Packaging material.
CAR: corrective action request.
CAP: corrective action & preventive action.
VS: versus
Abbreviation list of energy management system:
En: Energy.
EnMS: Energy management system.
EnPI: Energy performance index (Energy productivity index).
SEU: Significant energy use.
ES: Energy saving potential.
RE: Using possibility of renewable energy.
EE: Energy exchange with society.
EC: Electricity consumption (Kwh)
EUM: Energy use mark.
AC: Alternating current.
DC: Direct current.
Equipment: Equip
Page 5 of 45
2- COMPANY INTRODUCTION:
Our organization is factory environment and our factories to produce cosmetic
products. I control the production operations of two factories Soap and liquid.
We are managed by the cosmetics large multinational corporation. Our
organization has the two distribution chain, the first is the retail product and
another is the professional product in the both local production and import site.
We have been shared vision and value from the global Division:
Vision: “Global leader in brands and technologies”.
Values:
“Customers, we put our customers at the center of what we do.
People, we value, challenge and rewards our people.
Financials, we drive excellent sustainable financial performance.
Sustainability, we are committed to leadership in sustainability.
Family business, we build our future on our business foundation”.
2.1.
Policy of Vietnam factories:
- Protect safety and health for employees, customers, suppliers and all relate
parties.
- Prevent the wastes of nature resources and minimize the impact on the
environment from all our business activities.
- Engage pro-actively in early research and development to energy
efficiency.
- Promote innovative technologies and processes to minimize energy use
and encourage continuous energy conservation.
- Comply with regulation of Vietnam and the global multinational corporation
standard.
- Improve continuously our quality, energy, safety, health and environment
management system to achieve objectives and targets.
- Provide our products and services to meet customer requirement and
exceed their expectations.”
2.2.
Organization structure of Vietnam factories:
Operations
Manager (Viet
Nam)
Direct to
report
Operations Manager
(S.E.A)
Administrator
QMS
SC
(QC &
Manager
QA)
Manager
SHE &
Main
Manager
Pro
Manager
Custom
Planning
Service Procurement
Supervisor
Manager Supervisor
Page 6 of 45
Functional and operation flowchart
Documentation
KPIs (Objectives
& Targets
Key
planning
capacity
Production
operation
Delivery
products
to SC
Requirements
SC
Dept.
QMS
Dept.
SHE & Main
Dept.
Functional Departments
En.SHE
Policy
Marketing
(Retail & Professional)
HR Dept.
Purchasing
Dept.
Goal
Finance
Dept.
Supporting Departments
Company
Strategy
Board of Management
Q&
Company (BOM)
Sale (Retail &
Professional)
2.3.
Procurement
& planning
Operational Supporting
Output
Input
Note:
BOM members: Operations Manager, HR Manager, CFO, GM (General
Manager).
Page 7 of 45
3- THE KEY MANUFACTURING PROCESS :
Planning, Pro,
Procurement, SC,
QA, QC
There are 252 working
days in one operation
year. However, there are
only 6 working days that
operated factories with
energy source to be DO
and the rest to be
electric power
Production Plan
Issue daily BMR
Pro, QC, SC
Delivery to
Warehouse & QC
Pro, QC, SC
The
main
power
consumption
is
electricity consumption.
Energy = Electric power.
Weigh raw material
Checked
by QC
No
Electric
consumption
saving
by
EnMS
establishment
QC, SC & Pro
Yes
Receiving RM
Soap compressor
Soap
QC plan
Mixing
Test
No
Liquid
Yes
QC plan
No
Transfer tank
Test
Yes
Fillers (Bottle, Jar,
Tube or Sachet)
Evaporation
Identify equipment to be significant Energy Use
QCin
planoperation of liquid & soap factoryQC plan
No
Test
Check
Yes
QC plan
No
Check
Filling box & Date
code print
Labeling & Date
code print
Yes
Packing
QC plan
No
Check
Yes
Delivery
Page 8 of 45
4- SWOT ANALYSIS FOR ENERGY
Weakness:
Strengths:
Good human resources,
team work and leadership.
- Powerful finance.
- Good quality with cGMP
certificate & safety, health
and environmental
protection standards.
- SAP system integration.
Good service and high
product quality in SHE
protection way.
-
-
Internal
Technical analysis is
limited knowledge of
maintenance department.
- Set-up budget for getting
certificate and evaluated
period.
Negative potential: limited
ideas and control by nonmaintenance department.
Helpful
Harmful
Opportunities:
-
-
Energy saving: Reduce
our environmental impact
and make our business
more sustainable.
Low variable cost
approach is more suitable
to emerging markets as
Vietnam economic.
More chances for
success competition of
our business.
Threats:
-
External
Energy is the first of
“humanity’s top ten
problems for next 50
years”.
Primary electric energy is
made from hydropower,
fresh water material of this
is limited and sometime
cut power off in dry
season.
Negative Potential: COG
can be increase in shorttime at dry season due to
replacement of other
power.
Page 9 of 45
Harmful threats :
Water resources in the world ( Water resource report – Le Quoc Tuan
4/2013)
WATER PERCENTAGE ON EARTH
Salt
water
97%
Freshwater, we
can treated for
use 1%
Fresh water
volume is
used for
industrial,
agricultural
and life
activities is
limited
Freshwater,
we can't treat
for use, 2%
Some pictures about surface water pollution and waterless at Africa
Page 10 of 45
Vietnam surface water (Vietnam national hydrological meteorological station)
- Volume 840 billion m³.
- Almost headwaters of rivers are located at out of Viet Nam country and
there are more water volume than 60 %. For example: Mekong rivers
have be around 95% volume from other countries and Hong rivers have
be around 40% form China rivers.
5- DEVELOPMENT THE ENERGY MANAGEMENT SYSTEM:
Energy management system model:
Energy policy
Energy
planning
Management
review
Implementation
And operation
Checking
The EnMS internal
audit
Monitoring,
measurement and
analysis
Nonconformities,
corrective and
preventive action
Page 11 of 45
Application Deming circle PDCA for Energy management system
establishment with electric saving.
-
In order to get success in EnMS establishment, we follow ISO 5001
standards for built-up them.
Base on ISO 50001, there are 2 parts for EnMS establishment:
Technique & management.
ISO 50001
Standards
Technical
development
Plan:
- Define the SEU equip.
calculation.
- Equip. list & electric
consumption plan
Energy
management
system
Objective &
target for
energy saving
Management
development
Plan:
- Policy
- Resources.
- Action plan
Do:
- Training
- Definition: EnPI method.
- Documentation.
Do:
- Collect data report of
actual electric consumption.
- Assemble factors that they
are involved electric
consumption.
Act
Plan
Check
Do
Check:
Relevant variables
Act:
- Corrective / Preventive
actions or improvement.
- Make decision the SEU
equip. list by Pareto
validation
Check:
- Corrective /
Preventive actions.
- R² of energy baseline
Act:
Development objective
& target under SMART
condition.
Project team
The active list of
significant energy use
equip.
Standardization:
Objective & target of
energy saving.
Page 12 of 45
5.1.
Technical development:
5.1.1
Define calculation of significant energy use equipment:
Mark Matrix of SEU equip
Energy consumption (EC) /
day (Kwh)
EC ≥ 200
Mark (C)
Mark Formula
6
Not Available
100 ≤ EC ˂ 200
5
50 ≤ EC ˂ 100
4
30 ≤ EC ˂ 50
3
20 ≤ EC ˂ 30
2
EC ˂ 20
1
SEU Mark
-
Plan:
((CxE) + P +I)≥4
Including:
C: Mark of Electric consumption.
E: Mark of energy saving potential.
P: Mark of using possibility of renewable energy and P = 1
because we have defined main energy = electricity power.
I: Mark of energy exchange with society and I = 1
because we have defined main energy = electricity power.
Energy saving potential (ES)
Mark (E)
1
Energy saving potential –ES
(%)
ES ≥ 30%
2
20% ≤ ES ˂ 30 %
3
3
10% ≤ ES ˂ 20 %
2
4
ES ˂ 10 %
1
No.
4
Page 13 of 45
Using possibility of renewable energy (RE) & energy exchange with
society (EE)
1
Renewable energy –
RE (Kwh)
RE ≥ 50
2
30 ≤ RE < 50
30 ≤ EE < 50
4
3
20 ≤ RE < 30
20 ≤ EE < 30
3
4
1 ≤ RE < 20
1 ≤ EE < 20
2
5
RE < 1
EE < 1
1
No.
Energy exchange with
society –EE (Kwh)
EE ≥ 50
Mark P or I
5
Explanation: We have defined SEU equipment to be C ≥ 2 or C = 1 and we
will review opportunity of electric saving with mark E ≥ 2.
-
Equip list & electric consumption plan:
-
Measurement:
Electricity consumption (KWh) = Capacity * Load factor * Using
time.
Energy saving (%) = 100% - Percentage of (Electricity
consumption of plan / Actual electricity consumption).
5.1.2
-
Equip list is all equipment that they are used electric power in
their operation. Reference appendix 1 at column equipment
Electric consumption plan: Electric consumption forecast is made
for each equipment in daily working of them with 2 criteria to be
electric consumption (Kwh) / day and how many hours for this
day. Reference appendix 1 at column Electricity consumption
2016 (Plan).
Do:
Collect data report of actual electric consumption:
Collect the data of actual electricity consumption (Kwh) each other
use time by daily working as the above defined equipment list.
The uninterrupted recorded data is at least 12 weeks if we have
not the past data.
Reference appendix 1 at column Electricity Consumption of 12
weeks form Jan, 2016 to Apr,2016 (Actual)
Page 14 of 45
-
5.1.3
Assemble factors that they are involved electric consumption:
There are two factors that they have involve in electric
consumption and these are design capacity (Kw) and load factor
(form manufacturing or formula load factor = actual electric
consumption / theory electric consumption).
Reference appendix 1 at columns capacity (Kw) and Electricity
Consumption of 12 weeks form Jan, 2016 to Apr, 2016
(Actual).
Check:
-
Check whether any relevant variable is impacted to the actual data &
keep report for meeting & discussion about corrective action/ preventive
action or improvement.
- There are some relevant variable as following:
Production process.
Cleaning & sanitizing process.
Maintenance plan & operation.
Input voltage.
Weather & seasons.
- Reference appendix 1 at column Relevant variables
- Example about change Soap production process.
First time investment, return conveyor had been installed like “Before” due
to low cost and machine can work to get quality product. In addition, energy
consumption checking, we should install more conveyor length as “After
trial by hand” in order to get the grind time of each batch form 19.5
minutes to 15.6 minutes. That mean, electric consumption of this
equipment is reduced for one batch volume.
Before
Mixer +
Rolling
Mill
Grinder
Bar
Soap
Maker
Return of the redundant edges
Cutter
After trial
by hand
Compressor
Soap
Piece
Return of the redundant edges
Smoothly and make easy to homogenous
Before
After
Page 15 of 45
5.1.4
-
-
Action:
If there is any corrective action/ preventive action or improvement then it
is applied immediately. However, actual data collection will be keep for
re-valuation SEU equipment and will issue the new SEU equipment list
at least from 4 months to 12 months because the stable specification of
data statistics.
Make decision the SEU equipment list as
Appendix 1: It is easy make by excel file after “Plan, Do, Check”
step.
Each equipment will have energy use mark. From that,
equipment will defined SEU equipment or not as “Plan” step
mentioned.
Reference appendix 1 at column SEU with “Yes” answer to be
SEU equipment.
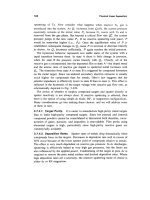
Review the SEU equipment list: Pareto for validation of
technical development. Base on Appendix 1 energy input and
energy review, we have:
Quantity of SEU equipment is compared with total equipment list:
Equip. type
SEU Equip.
Non-SEU Equip.
Total Equip.
Quantity (machine)
19
75
94
Percentage (%)
20.21
79.79
100.00
Controlled Quantity Of SEU Equipment
80
75
120.00%
100.00%
70
100.00%
60
50
40
80.00%
79.79%
60.00%
30
19
20
40.00%
20.00%
10
0
0.00%
Non-SEU Equip.
SEU Equip.
Quantity control
percetage plus (%)
Page 16 of 45
Summary: SEU equipment must be controlled is 19 machines with
percentage 20.11% and the rest equipment shouldn’t be focused
79.79%. It meet with Pareto rule 80:20
Energy saving of SEU equipment is compared with non-SEU
equipment:
Equip. type
Electric saving
(Kwh)
127.32
2.70
130.02
SEU Equip.
Non-SEU Equip.
Total Equip.
Percentage (%)
97.92
2.08
100
Electric Saving (kwh)
140
100.50%
127.32
100.00%
120
100.00%
99.50%
100
99.00%
80
98.50%
60
98.00%
97.92%
40
97.50%
20
2.70
0
97.00%
96.50%
SEU Equip.
Electric Saving
(kwh)
Non-SEU
Equip.
percetage plus (%)
As result, If the SEU equipment is controlled with 20.21% / total
equipment then it get electric saving result 97.97% / total electric
saving under the above technical development method.
Therefore, the SEU equipment list is active with EMS.
5.2.
Management development:
5.2.1
Plan:
Page 17 of 45
-
-
Policy: being relevant efficiency energy use. There are already mention
energy in our policy. We make sure when EMS development is aligned
with policy for get success.
Resource: Initialization of any project must be appointed “Project leader”
& defined project team. Due to special knowledge of this system with
electric engineering knowledge, so he must be member of SHE-Main
department as our organization. In addition, EMS development need to
define the SEU equipment list so any department must be involved for
use electric in their daily working. I mention the project team:
Project leader
(SHE & Main
Manager)
Operations Manager
(Support & Approval)
Production team
SC team
(Production
(SC manager &
manager &
SC leader)
supervisors)
-
SHE & Main
members
Procurement &
planning
supervisor
However, It is forgotten make decision and authorize for audit team of
EnMS for further operation of EMS.
Action plan:
They are defined by project team.
Condition of action plan: How to control or limit impact of the
relevant variables. Detail action plan is defined at appendix 2.
5.2.2
-
QMS team
(QC & QA
manager &
supervisors)
Do:
Training:
External training: Understand ISO 50001 in whole employee:
+ Awareness ISO 50001 for all employees of factories.
+ Internal audit for authorized audit team and backup employees.
Internal training:
+ Train about technical knowledge & technical development and trainer
is project leader.
+ Discussion the detail action plan of appendix 2.
Page 18 of 45
-
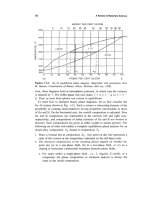
EnPI definition by project team: Base on ISO 50001, it should establish
energy baselines for controlling and evaluation EnPI.
Rule:
+ The production volume (x - kg) & actual electric consumption (y) data
of analysis must be collected in uninterrupted 12 months and at least
uninterrupted 12 weeks.
+ Build-up the energy baseline y = ax + b – simple linear regression &
getting R² result.
Note: 0.5 ≤ R² ≤ 0.8 is a safety or R² ≥ 0.8 is more safety.
(Reference document:
)
+ Reference 3, 4, 5 & 6: Establish energy baseline and get result of
0.7183 ≤ R² ≤ 0.9823. Therefore, Baselines are high reliability.
Formula:
% EnPI = ((y¡'– y¡)/x'¡)*100%
Including:
y'¡ = ax'¡ + b : Calculated energy consumption (Kwh).
x: Actual production volume (kg) that it has used y (Kwh)
x'¡: Actual production volume (kg, collect by monthly) that the i
equipment can be used y'¡ (Kwh).
y¡: Actual energy consumption of i equipment (Kwh, collect by
monthly)
a & b: Constant ( a & b values are taken from energy baseline).
R²: Determination coefficient.
% EnPI evaluation method:
+ If result of % EnPI > 0 then utilized energy of equipment is efficiency
and the efficiency value is commensurate with this percentage.
+ If result of % EnPI = 0 then utilized energy of equipment is stable
+ If result of % EnPI < 0 then utilized energy of equipment is not
efficiency and it is commensurate with this percentage. Therefore,
corrective action and preventive action must be discussed and
executed.
-
Documentation:
At least documentation:
EMS procedure for technical development.
Work instruction for energy baseline and EnPI.
5.2.3
-
Check:
Corrective action / Preventive action: Review or validation any the detail
action that can get more energy saving if any.
Page 19 of 45
-
Check determination coefficient form appendix 3, 4, 5 & 6, the result
0.7183 ≤ R² ≤ 0.9823. Therefore, Baselines are high reliability.
5.2.4
-
Act: Standardization objective of energy saving with clear target.
The SEU equipment is compliance for EMS with energy saving 19 SEU
equipment will are controlled and
- Detail action plan for each equipment to be available.
- All R² of all energy baselines are high reliability.
Therefore, objectives and target of energy saving can develop in SMART
condition. However, we should set-up target with 80% - 85% of % energy
saving.
Page 20 of 45
SMART
S
M
A
Measurable
100%
with
Attainment
quantification
- Subject:
Energy
saving.
- Align to
policy
1
T
Time-bound
Align to policy
Relevant
Objective
Base on the respective
total production volume
(kg), Electricity
consumption reduction
% of factories vs 2015
Target
Tangible
Team & individual person,
department be in charge
Detail level
No
R
Energy
saving
form
appendix
1
5%
6.24 %
2
Base on the respective
liquid mixing volume
(kg), electricity
consumption reduction
% of liquid mixing area
vs 2015
5.22 %
6.53 %
3
Base on the respective
liquid filling volume (kg),
electricity consumption
1.00
0%
Responsibility
Management
team and EMS
team leader
- Liquid mixing
production
operator & SHEMain. Team.
- Production
supervisor of
liquid mixing.
- Liquid filling
production
operator & SHE-
Periodic report
Deadline
- Monthly report.
- Meeting & discussion if any
nonconformity for problem
solving.
- Visual management with
update result by monthly.
Daily report & monthly report
31
Dec,16
Daily report & monthly report
31
Dec,16
31
Dec,16
Page 21 of 45
4
5
6
(Kwh) of liquid filling
area / electricity
consumption (kwh) of
liquid filling area 2015
Base on the respective
soap volume (kg),
electricity consumption
reduction % of soap
production vs 2015
Base on the respective
liquid production volume
(kg), Electricity
consumption reduction
% of liquid factories vs
2015
Base on the respective
liquid production volume
(kg), Electricity
consumption reduction
% of liquid factories vs
2015
2.86 %
3.57 %
7.77 %
9.71 %
3.4 %
4.24 %
Main. Team.
- Production
supervisor of
liquid filling.
- Soap production Daily report & monthly report
operator & SHEMain. Team.
- Soap production
supervisors
- SHE-Main.
Daily report & monthly report
Team of liquid
factory.
- HR Admin.
- SHE-Main.
Team of soap
factory.
- HR Admin.
Daily report & monthly report
31
Dec,16
31
Dec,16
31
Dec,16
Page 22 of 45
6- CONCLUSION:
ISO 50001 is clear standard about EMS establish.
Development EMS can help us to get benefits:
-
Reduction processing cost that is part of cost of goods due to reduction
energy use.
- Easy to set-up objective & target for energy saving under SMART
condition.
- Opportunity of Improvement for other objectives and targets.
The company can develop sustainable under challenge economy and
competitive environment.
1- Strictly follow the energy
management procedure.
2- Documentation and application
of monitoring, measurement &
analysis methods.
3- Documentation & application
work instruction of SEU
equipment and checklist report.
4- Daily record about actual
production volume, energy
consumption & operated status of
SEU equipment.
5- Evaluation of new equipment
design if any.
1- EMS
establishment for
saving electricity
using.
2- Objectives &
targets of electricity
saving.
Implementation &
operation of energy
planning
1- Success EMS
establishment for saving
electricity using.
2- Meet targets of energy
objectives as design in
advance.
1- Policy
2-Documentation & application energy
management procedure.
3- Monthly report & meeting about
EnPI, objective results and CAR &
CAP if any.
4- Internal audit: Twice / year.
5- Management review: Twice / year.
6- Re-evaluation energy using of
equipment.
6- External audit to get certificate
Page 23 of 45
7- REFERENCE DOCUMENT:
Economic Intelligence & Knowledge Management- Professor Davit Vallat.
Henkel document & data.
ISO 50001:2011.
Process Managment for Continuous Improvement. – Professor Michel
Brotto.
Quality, Performance and Sustainable Development – Professor Gaetan
Dartevell.
Strategy and Business Environment – Professor Jacques Martin.
Page 24 of 45
8- APPENDIX:
E
P
I
Relevant
variables
Using
time/
day
(Hour)
Kwh/
Day
Using
time/
day
(Hour)
Kwh/
day
Double
Jacket mixer
200L
Unimix
Mixer 200L
Double
jacket
mixer 1000L
Fluid
mixer
Sower mixer
Water pump
9.3
0.53
4
19.72
4
19.72
0
1
1
1
1
3
No
9.7
0.51
4
19.79
4
19.79
0
1
1
1
1
3
No
23
0.39
5
44.85
4.2
37.674
16.0
3
2
1
1
8
Yes
2.6
0.86
7
15.65
7
15.75
0
1
1
1
1
3
No
18.5
1.5
0.65
0.79
4
4
48.10
4.75
4
3.5
48.10
4.16
0
12.5
3
1
1
2
1
1
1
1
5
4
Yes
Yes
Saving
(%)
Load
factor
SUE
5
6
Production
4
Liquid Mixing
3
C
EUM
2
Electricity
consumption
2016 (Plan)
Capacity
(Kw)
1
Electricity
Consumption of 12
weeks form Jan, 2016 to
Apr,2016 (Actual)
Equipment
Controller
Area
No
Appendix 1: Energy input & energy review
1- Batch
mixing
production
instruction.
2- CIP
procedure.
3- Main.
Plan &
operation.
4- Input
voltage.
1- CIP
procedure.
2- Main.
Plan &
operation.
3- Input
voltage.