Liquid-Phase Adsorption Of Phenols Using Activated Carbons Derived From Agricultural Waste Material
Bạn đang xem bản rút gọn của tài liệu. Xem và tải ngay bản đầy đủ của tài liệu tại đây (1.68 MB, 16 trang )
Available online at www.sciencedirect.com
Journal of Hazardous Materials 150 (2008) 626–641
Liquid-phase adsorption of phenols using activated carbons
derived from agricultural waste material
Kunwar P. Singh a,∗ , Amrita Malik a , Sarita Sinha b , Priyanka Ojha a
a
Environmental Chemistry Section, Industrial Toxicology Research Centre, Post Box 80, MG Marg,
Lucknow 226001, India
b National Botanical Research Institute, Rana Pratap Marg, Lucknow 226001, India
Received 12 August 2005; received in revised form 7 March 2007; accepted 8 May 2007
Available online 22 May 2007
Abstract
Physical and chemical properties of activated carbons prepared from coconut shells (SAC and ATSAC) were studied. The adsorption equilibria and
kinetics of phenol and 2,4-dichlorophenol from aqueous solutions on such carbons were then examined at three different temperatures (10, 25 and
40 ◦ C). Adsorption of both phenol and 2,4-dichlorophenol increased with an increase in temperature. The experimental data were analyzed using the
Langmuir and Freundlich isotherm models. Both the isotherm models adequately fit the adsorption data for both the phenols. The carbon developed
through the acid treatment of coconut shells (ATSAC) exhibited relatively higher monolayer adsorption capacity for phenol (0.53 mmol g−1 ) and 2,4dichlorophenol (0.31 mmol g−1 ) as compared to that developed by thermal activation (SAC) with adsorption capacity of 0.36 and 0.20 mmol g−1 , for
phenol and 2,4-dichlorophenol, respectively. The equilibrium sorption and kinetics model parameters and thermodynamic functions were estimated
and discussed. The thermodynamic parameters (free energy, enthalpy and entropy changes) exhibited the feasibility and spontaneous nature of the
adsorption process. The sorption kinetics was studied using the pseudo-first-order and second-order kinetics models. The adsorption kinetics data
for both the phenol and 2,4-dichlorophenol fitted better to the second-order model. An attempt was also made to identify the rate-limiting step
involved in the adsorption process. Results of mass transfer analysis suggested the endothermic nature of the reaction and change in the mechanism
with time and initial concentration of the adsorbate. The results of the study show that the activated carbons derived from coconut shells can be
used as potential adsorbent for phenols in water/wastewater.
© 2007 Elsevier B.V. All rights reserved.
Keywords: Adsorption; Equilibria; Kinetics; Phenols; Activated carbons; Coconut shell
1. Introduction
Discharge of wastewater/effluent containing organic pollutants into natural surface waters poses serious risk to aquatic
organisms and human beings besides imparting a carbolic odor
to the receiving water. Phenols find their way into surface water
from industrial effluents such as those from coal tar, gasoline,
plastic, rubber-proofing, disinfectant, pharmaceutical and steel
industries, domestic wastewaters, agricultural runoff and chemical spillage [1]. Contamination of groundwater aquifers with
phenolic compounds has been reported [2]. The health effects
∗
Corresponding author. Tel.: +91 522 2508916; fax: +91 522 2628227.
E-mail addresses: kpsingh ,
(K.P. Singh).
0304-3894/$ – see front matter © 2007 Elsevier B.V. All rights reserved.
doi:10.1016/j.jhazmat.2007.05.017
following repeated exposure to low levels of phenol in water
include liver damage, diarrhea, mouth ulcers, dark urine and
hemolytic anemia. In animals, spilling of dilute phenol solution
on the portion greater than 25% of the body surface may result
in death [3]. Phenols have been registered as priority pollutants
by the US Environmental Protection Agency (USEPA) with a
permissible limit of 0.1 mg L−1 in wastewater [4]. According to
the Bureau of Indian Standards [5] (BIS), the permissible limit
of phenol for drinking water is 1.0 g L−1 .
The methods used for the treatment of water/wastewater
containing phenolic wastes include microbial degradation [6],
chemical oxidation [7], photocatalytic degradation using TiO2
[8], sonophotochemical [9], ultrasonic degradation [10], enzymatic polymerization [11] and adsorption [12], etc. Among
these, adsorption offers an efficient and economically feasible
technology for the removal of contaminants from wastewa-
K.P. Singh et al. / Journal of Hazardous Materials 150 (2008) 626–641
ters. Selective adsorption utilizing biological materials, mineral
oxides, and activated carbon or polymer resins has developed
great interest among the researchers and environmentalists.
Activated carbon has been utilized as an efficient sorbent for
odor removal, solvent recovery, decolorization, dechlorination,
ozone annihilation, H2 S/CS2 removal, gold recovery, filtration,
condensed deviling, fuel gas cleaning, industrial wastewater
treatment, drinking water conditioning, etc. Activated carbons
can be prepared from a variety of materials. The most commonly
used raw materials for the preparation of activated carbons in
commercial practice are peat, coal, lignite, wood and agricultural
by-products. Production of activated carbon from agricultural
by-products serves a double purpose by converting unwanted,
surplus agricultural waste to useful, valuable material and provides an efficient adsorbent material for the removal of organic
pollutants from water/waste water.
Activated carbons have a large adsorption capacity for a
variety of organic pollutants but are expensive due to difficult
regeneration and higher disposal cost [12–18]. In view of the
high cost and tedious procedure for the preparation and regeneration of activated carbon, there is continuing search for the
development of adsorbents using cheaper raw materials. Many
researchers have studied the feasibility of less expensive activated carbons prepared from spent oil shake [14], bagasse fly
ash [1], tamarind nut [15], soyabean hulls [16], salvinea molta
Mitchell [17], and coconut husk [18] for the removal of phenolic
compounds.
For any sorbent to be feasible, it must combine high and
fast adsorption capacity with inexpensive regeneration [12].
The present study is aimed towards the development of an
industrially viable, cost effective and environmentally compatible adsorbent for the removal of phenol from wastewater.
For this purpose, the coconut shells, which are by-product of
coconut based industries, were converted into an inexpensive
carbonaceous adsorbent. To evaluate the efficiency of developed
adsorbents, adsorption batch and kinetic studies were performed.
2. Materials and methods
All reagents and chemicals used in the study were of AR
grade. Stock solutions of the test reagents were prepared by
dissolving the desired amount of phenol/2,4-dichlorophenol in
double distilled water. pH of the test solution was adjusted using
reagent grade dilute sulfuric acid and sodium hydroxide.
2.1. Adsorbent development and characterization
The raw material, i.e. coconut shells (agricultural waste materials) was collected from the local market of Lucknow City,
India. The collected material was thoroughly washed with double distilled water to remove any extraneous depositions and
dried at room temperature. Two types of carbonaceous material
were prepared. First type of carbon was prepared by treating one
part of coconut shells with two parts (by weight) of concentrated
sulfuric acid and the same were kept in an oven maintained at
150–165 ◦ C for a period of 24 h. The carbonized material was
washed well with double distilled water to remove the free acid
627
and dried at 105–110 ◦ C for 24 h and subjected to thermal activation at different temperatures viz., 200, 400, 600 and 800 ◦ C for
1 h in an inert atmosphere. Second type of carbon was prepared
by activating the coconut shells without any chemical treatment
at different temperatures viz., 200, 400, 600 and 800 ◦ C for 1 h in
an inert atmosphere. Activation is carried out under closely controlled process parameters to get optimum properties. Finally,
the product is adequately cooled before it is exposed to the atmosphere. The temperature and time were optimized by observing
the surface properties of the activated products obtained. In both
the cases the products obtained at temperatures higher or lower
than 600 ◦ C exhibited less adsorption capacities. The products
so obtained were sieved to the desired particle sizes, such as
30–200, 200–250 and 250–300 mesh. Finally, products were
stored in a vacuum desiccator until required. The developed carbons were designated as SAC (activated carbon derived from
coconut shells) and ATSAC (activated carbon derived from acid
treated coconut shells).
The chemical and textural composition of the developed
adsorbents was established by carrying out the proximate, elemental analysis by gas adsorption, mercury porosimetry, and
helium & mercury density measurements, respectively. The values of the BET specific surface area (SBET ) and pore volumes
(micropore volume, Vmi ; mesopore volume, Vme ; macropore
volume, Vma ; and total pore volume, VT ) were determined
using Quantachrome surface area analyzer model Autosorb1. The mercury porosimetries have been carried out with a
Quantachrome porosimeter model Autoscan-60. The mercury
density was determined as usual, when carrying out the mercury
porosimetery experiments. The helium density was measured
using a Quantachrome Stereopycnometer. The chemical constituents of activated carbons were determined following the
methods reported elsewhere [19,20]. SEM was used to investigate the surface topography of the activated carbon. Samples
were set in epoxy and were placed in the sample chamber
and evacuated to high vacuum (2 × 10⁶ Torr). The sample is
bombarded with a finely focused electron beam. A threedimensional topographic image (SEM micrographs) is formed
by collecting the secondary electrons generated by the primary
beam.
The pH measurements were made using a pH meter (Model
744, Metrohm). Absorbance measurements were made on
a GBC UV–visible spectrophotometer model Cintra-40. The
spectrophotometer response time was 0.1 s and the instrument
had a resolution of 0.1 nm. Absorbance values were recorded at
the wavelength for maximum absorbance (λmax ), i.e. 269 and
284 nm for phenol and 2,4-dichlorophenol, respectively. The
concentrations of respective compounds were measured with
a 1-cm light-path cell, with an absorbance accuracy of ±0.004
at λmax .
2.2. Sorption procedure
Sorption studies were performed by the batch technique to
obtain rate and equilibrium data. The batch technique was used
due to its simplicity. In order to select the optimum pH for
adsorption experiments, a series of batch experiments with the
628
K.P. Singh et al. / Journal of Hazardous Materials 150 (2008) 626–641
2.3. Kinetic studies
The adsorption kinetics of different adsorbates (phenol and
2,4-dichlorophenol) on the adsorbents (SAC and ATSAC)
derived from coconut shells was studied by the batch technique. The batch kinetic studies were performed at different
temperatures, adsorbate concentrations, and adsorbent doses at
optimum pH. For this purpose, a number of stoppered conical flasks containing a definite volume (50 mL in each case) of
adsorbate solution of known concentrations were placed in a
thermostat controlled shaking assembly. When the desired temperature reached, a known amount of adsorbent was added to
each flask and the solutions were agitated mechanically. At predecided intervals of time, the solutions of the specified conical
flasks were separated from the adsorbent and analyzed spectrophotometrically to determine the uptake of adsorbate (phenol
and 2,4-dichlorophenol) at corresponding λmax .
2.4. Modeling
2.4.1. Equilibrium isotherm models
The Langmuir and Freundlich models [21] were used to fit
the adsorption isotherms and to evaluate the isotherm parameters. The Langmuir isotherm is based upon the assumption of
monolayer adsorption onto a surface containing finite number of
adsorption sites of uniform energies of adsorption with no transmigration of adsorbate in the pores of the adsorbent surface. The
Langmuir equation may be written as:
Ce
1
1
= 0 + 0 Ce
qe
Q b Q
Fig. 1. Effect of adsorbent amount on the uptake of phenol and 2,4dichlorophenol by (a) SAC and (b) ATSAC at optimum pH, temperature 25 ◦ C;
C0 = 5 × 10⁻⁴ mol L−1 .
SAC and ATSAC were conducted at different pH ranging 2–10.
Batch sorption studies were performed at different temperatures
(10, 20 and 40 ◦ C) and at optimum pH to obtain data on the
rate and extent of sorption. For isotherm studies, a series of
100-mL Erlenmeyer stoppered conical flasks containing 50 mL
of adsorbate (phenol or 2,4-dichlorophenol) solution of desired
pH of varied concentrations (10−4 to 10−3 mol L−1 ) and definite amount of adsorbents (30–200 mesh) were mixed together
and agitated intermittently for a period of 30 h. The contact
time and other conditions were selected on the basis of preliminary experiments, which demonstrated that the equilibrium was
established in 28–30 h as can be seen from the results in Fig. 1a
and b. Equilibrium for longer times, gave practically the same
uptake, therefore the contact period was 30 h in all the equilibrium studies. After this period the solution was filtered and the
phenol and 2,4-dichlorophenol concentrations were determined
spectrophotometrically at the corresponding λmax . The effect of
adsorbent amount viz., SAC and ATSAC on the rate of uptake
of adsorbate is shown in Fig. 1a and b, respectively. The uptake
increases with an increase in the adsorbent amount. The amount
of adsorbent has been kept 1.0 g L−1 in all the subsequent
studies.
(1)
where qe is the amount of solute adsorbed per unit weight
of adsorbent (mol g−1 ), Ce the equilibrium concentration
(mol L−1 ), Q0 the monolayer adsorption capacity (mol g−1 )
and b is the constant related to the free energy of adsorption
(b ∝ e− G/RT ). It is the value reciprocal of the concentration of
which half the saturation of the adsorbent is attained. The model
parameters (Q0 and b) can be determined from the linear plots
of Ce /qe and Ce .
The Freundlich model assumes heterogeneous surface energies, in which adsorption energy varies as a function of the
surface coverage due to variation in the heat of adsorption. The
Freundlich equation may be written as:
log qe = log KF +
1
log Ce
n
(2)
where qe is the amount of solute adsorbed per unit weight
of adsorbent (mol g−1 ), Ce the equilibrium concentration
(mol L−1 ), KF the constant indicative of the relative adsorption capacity of the adsorbent (mol g−1 ) and 1/n is the constant,
indicative of the intensity of the adsorption. The model parameters (KF and 1/n) can be determined from the linear plots of log qe
and log Ce . The Freundlich model is widely applied [13,22,23]
in heterogeneous systems especially of organic compounds and
highly interactive species on activated carbon and molecular
sieves.
7.02
5.72
2.21
2.26
0.25
0.28
69.23
76.64
68.23
62.65
0.98
0.91
1.54
1.60
0.26
0.36
378
380
SAC
ATSAC
˚ − Vma , Vma = Vcu (at r = 250 A),
˚ Vcu = cumulative pore volume (mercury porosimetry), VT = Vmi + Vme + Vma .
Vme = Vcu (at r = 20 A)
Vma (cm3 g−1 )
Vme (cm3 g−1 )
Wo (cm3 g−1 )
Table 1
Characteristics of developed activated carbons (SAC and ATSAC)
For characterization of the prepared activated carbons, 1.0 g
of each was stirred with deionized water (100 mL, pH 6.8) for
two hrs and left for 30 h in an air tight stoppered conical flask.
After the equilibration time of 30 h, a rise in pH was observed in
case of SAC, while there was lowering of pH in case of ATSAC.
As a result, the SAC may be considered as H-type carbon in
nature and ATSAC as L-type. H-type activated carbons assume
a positive charge (protonated) upon introduction to water (yielding alkaline pH), are hydrophobic, and can adsorb strong acids.
The predominant surface oxides on the surface of an H-type
carbon are lactones, quinones, phenols and carboxylates [26]. Ltype activated carbons assume a negative charge (ionised) upon
hydration (yielding acidic pH), are hydrophilic, and can neutralise strong bases. The predominant surface functional groups
for L-type carbons according to Garten and Weiss [27] are carboxyl, phenolic hydroxyl, carbonyl (quinone type), carboxylic
acid, anhydrides, lactone and cyclic peroxide [28].
The specific surface area of the carbons was evaluated from
the N2 isotherms by applying the Brunaeur, Emmett and Teller
(BET) equation at a relative pressure (p/p0 ) of 0.35 and am equal
˚ (am is the average area covered by a molecule of N2
to 16.2 A
in completed monolayer). From the aforesaid isotherms as well,
the micropore volume (W0 ) has been obtained by taking it to be
equal to the volume of N2 adsorbed at p/p0 = 0.10(Vmi ) and also
by applying the Dubinin–Radushkevich equation.
The volumes of mesopores (Vme ) and macropores (Vma ) have
been derived from the curves of cumulative pore volume (Vcu )
against pore radius (r) (mercury porosimetry): Vme = Vcu (at
˚ − Vma and Vma = Vcu (at r = 250 A).
˚ The total pore
r = 10 A)
volume has been calculated by adding up Vmi , Vme and Vma .
VT (cm3 g−1 )
3.1. Characterization
0.09
0.19
3. Results and discussion
0.05
0.05
ρHg (g cm3 )
where v0 (k2 qe2 ) is the initial sorption rate, qe the amount
adsorbed at equilibrium, and k2 is the pseudo-second-order rate
constant. The values of k2 , v0 and qe can be calculated by plotting
t/qt versus ‘t’.
0.12
0.13
Ash (%)
ρHe (g cm3 )
(4)
Vmi (cm3 g−1 )
1
1
t
=
+ t
qt
v0
qe
C (%)
where qe and qt are the amounts adsorbed at equilibrium and
at time t, respectively, and k1 is the first-order rate constant.
The adsorption rate parameter k1 can be calculated by plotting
log(qe − qt ) versus ‘t’.
The pseudo-second-order-equation based on equilibrium
adsorption may be expressed as [25]:
0.12
0.12
pH
H (%)
N (%)
(3)
SBET (m2 g−1 )
k1
t
2.303
Adsorbent
log(qe − qt ) = log qe −
Yield (%)
2.4.2. Kinetic models
To analyze the adsorption rate of phenols onto the developed
adsorbents, two kinetic models (pseudo-first-order and pseudosecond-order) were used.
The pseudo-first-order-kinetic equation [24] may be written
as:
629
21.29
99.35
K.P. Singh et al. / Journal of Hazardous Materials 150 (2008) 626–641
630
K.P. Singh et al. / Journal of Hazardous Materials 150 (2008) 626–641
The different chemical constituents of activated carbons along
with other characteristics are given in Table 1. It may be noted
that ATSAC has relatively higher surface area and lower ash
content than SAC. The ATSAC also showed higher pore volume
(0.36 cm3 g−1 ) and carbon content (76.64%) as compared to
SAC (0.26 cm3 g−1 and 69.23%, respectively). There was a
large difference between the yield of ATSAC (about 99%) and
SAC (about 21%). The difference between the two (SAC and
ATSAC) may be attributed to the chemical treatment of the
later. The chemical treatment results in a relatively larger yield
as compared to the physical activation methods and good development of the porous structure [29]. The chemical treatment
leads to the dehydration of cellulosic material during pyrolysis
resulting into charring and aromatization of the carbon skeleton,
and the creation of the porous structure [30]. Further, both the
SAC and ATSAC prepared here have surface area, meso- and
micropores comparable with other carbons derived from waste
materials [31,32], these have relatively low surface area and pore
volumes as compared to those available commercially [33–35].
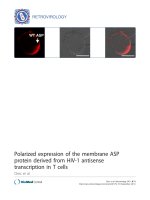
SEM is widely used to study the morphological features and
surface characteristics of the adsorbent materials. In the present
study, scanning electron microscopic photograph (1000×
magnification) of developed activated carbons (30–200 mesh)
revealed surface texture, porosity and fibrous structure of the
developed adsorbents (Fig. 2). The rough surface micrographs
showed a distinct roughness with oval pattern. The identification
of various forms of different constituents in activated carbon
viz., SAC and ATSAC has been done with the help of IR spectra
[36]. The IR spectrum of the activated carbons (Fig. 3a and b)
showed weak and broad peaks in the region of 3853–453 cm−1 .
Approximate FT-IR band assignment indicated the presence of
carbonyl, carboxyls, lactones, phenols, olefinic and aromatic
structures. The 1800–1540 cm−1 band is associated with C O
stretching mode in carbonyls, carboxylic acids, and lactones
and C C bonds in olefinic and aromatic structures, whereas the
1440–1000 cm−1 band was assigned to the C–O and O–H bending modes. Further, presence of relatively weak peak/band of
the hydroxyl group (centered around 3400 cm−1 ) differentiated
between the two adsorbents. The assignment of a specific wave
number to a given functional group was not possible because
the absorption bands of various functional groups overlap and
shift, depending on their molecular structure and environment.
Shifts in absorption positions can be caused by the factors such
as intramolecular and intermolecular hydrogen bonding, steric
effects, and degrees of conjugation.
3.2. Sorption studies
The pH of the solution is one of the major factors influencing
the adsorption capacity of compounds that can be ionized. Acid
or alkali species may change the surface chemistry of the adsorbent by reacting with surface groups. These effects may lead to
significant alterations in the adsorption equilibrium depending
on the pH [37]. At higher pH the phenols dissociate, forming
phenolate anions, whereas surface functional groups may be
either neutral or negatively charged. The electrostatic repulsion
between the like charges lowers the adsorption capacities in case
Fig. 2. Scanning electron micrographs (SEM) of (a) SAC and (b) ATSAC at
1000×.
of both the phenols [23]. This may be due to the dependence of
phenol ionization on pH of the medium. The ionic fraction of
phenolate ion, ϕions can be calculated from the equation [38]:
ϕions =
1
[1 + 10
(pKa −pH)
]
(5)
The ϕions increases as the pH value increased. Thus, phenols being weak acid (pKa = 9.89 and 7.8 for phenol and
2,4-dichlorophenol, respectively) will be adsorbed to a lesser
extent at higher pH values due to the repulsive force prevailing at
higher pH [38,39]. Phenol and 2,4-dichlorophenol are associated
with the electron withdrawing effect of the aromatic ring [23].
Adsorption capacity of the activated carbons for the solute in
molecular form depends on the electron density of the solute and
the carbon surface because the dispersive interaction between the
aromatic ring of the solute and those of the carbon surface are the
main forces involved in the adsorption process [40]. The effect
of pH on the removal of different adsorbates (phenol and 2,4dichlorophenol) using developed adsorbents (SAC and ATSAC)
is presented in Fig. 4. These studies were carried out at the initial
adsorbate concentration of 1 × 10⁻⁴ mol L−1 . It was observed
that the removal decreases with an increase in the solution pH.
The maximum adsorption was observed at the acidic pH for both
K.P. Singh et al. / Journal of Hazardous Materials 150 (2008) 626–641
Fig. 3. IR spectrum of (a) ATSAC and (b) SAC.
Fig. 4. Effect of pH on the (a) adsorption of phenol and 2,4-dichlorophenol and
(b) equilibrium pH on SAC and ATSAC.
631
the adsorbents, therefore, a pH of 2.0 ± 0.2 was chosen for the
adsorption of phenol on the SAC and 4.0 ± 0.2 for the adsorption on ATSAC (Fig. 4a). In case of 2,4-dichlorophenol a pH
of 2.0 ± 0.2 was selected for both the activated carbons viz.,
SAC and ATSAC. Higher adsorption of phenols at lower pH has
also been reported by others [37]. At the lower pH, the functional
groups on the carbon surface are in the protonated form and high
electron density on the solute molecules would lead to higher
adsorption. In the acid range pHequ increases with the increasing pHin , i.e. neutralization and sorption process are parallel
processes and after pHin 8.0, the pHequ decreases in all the cases
(Fig. 4b). A similar trend has been reported for the adsorption of
pyridine derivatives on the activated carbons [41]. The surface
chemistry of the activated carbons essentially depends on their
heteroatom content, mainly on their surface oxygen complex
[42]. The surface charge would depend on the solution pH and
the surface characteristics of the carbon. A negative charge will
result from the dissociation of surface oxygen complexes of acid
character such as carboxyl and phenolic groups and these surface
sites are known to be Bronsted type. The positive surface charge
may be due to surface oxygen complexes of basic character like
pyrones or chromenes, or due to the existence of electron-rich
regions within the graphene layers acting as Lewis basic centers,
which accept protons from the aqueous solution [43].
The adsorption studies were carried out at 10, 25 and
40 ◦ C to determine the adsorption isotherms. The isotherms
for the adsorption of phenol and 2,4-dichlorophenol on the
adsorbents developed from agricultural waste material viz.,
SAC and ATSAC at optimum pH and different temperatures
are shown in Fig. 5a and b, respectively. The adsorption of both
the adsorbates on the developed activated carbons increases
with an increase in the temperature reflecting the endothermic
nature of the reaction. Garcia-Araya et al. [37] and Mohan et
al. [41] have also reported the endothermic processes for the
adsorption of organic compounds on activated carbon. With
the rise in the equilibrium concentrations (being more polar)
the solute molecules interact via electrostatic interactions with
the polar surface groups. This effect decreases with increase in
the temperature enhancing the adsorption [44]. The isotherms
are positive, regular and concave to the concentration axis
(Fig. 5a and b). According to Giles’ classification [45] the
isotherms may be classified as H-type and L-type, for the
adsorption of phenol and 2,4-dichlorophenol, respectively, on
SAC, whereas, in case of ATSAC isotherms obtained for the
adsorption of phenol were S-type and H-type for the adsorption
of 2,4-dichlorophenol. The H-type isotherm indicates the high
affinity of the activated carbon towards the adsorbate and that
there is no strong competition from the solvent for sorption sites.
The L-type isotherms suggest the completion of monolayer
on the surface of adsorbent, while the S-type curve implies a
side-by-side association between adsorbed molecules [45].
The Langmuir isotherms for the adsorption of phenol and 2,4dichlorophenol on SAC and ATSAC at different temperatures are
shown in Fig. 6a and b, respectively. The monolayer adsorption
capacity (Q0 ) was found to be higher for ATSAC as compared
to SAC for adsorption of both phenol and 2,4-dichlorophenol
(Table 2). The higher adsorption capacity (Q0 ) for ATSAC, i.e.
632
K.P. Singh et al. / Journal of Hazardous Materials 150 (2008) 626–641
Fig. 6. Langmuir adsorption isotherms of phenol and 2,4-dichlorophenol on (a)
SAC and (b) ATSAC at different temperatures and optimum pH.
Fig. 5. Adsorption isotherms of phenol and 2,4-dichlorophenol on (a) SAC and
(b) ATSAC at different temperatures and optimum pH.
the carbon prepared from the chemical treatment of the coconut
shells may be due to its higher surface area than SAC. ATSAC
has higher carbon content and pore volume, also, as compared
to SAC. Similar conclusions have been drawn for the adsorption of pyridine and its derivatives on activated carbons [36,41].
The mechanism of phenol adsorption is determined by so-called
“– interactions” and “donor–acceptor complex” formation.
The first factor assumes that oxygen atoms bounded to the carbon
reduce the electron density and weaken the dispersion forces
between phenol electrons ring and the electrons of carbons. The second one postulates that the adsorption mechanism
is based on the formation of donor–acceptor complexes between
the surface carbonyl groups (electron donors) and the aromatic
rings of phenol acting as the acceptor [42,46,47]. Further, the
sorption of phenol was higher than 2,4-dichlorophenol in case
of both the developed adsorbents. This may be explained as the
molecule of phenol is relatively smaller than 2,4-dichlorophenol
molecule. Small molecules can access micropores driven by the
strong adsorption potential near the micropore wall. The adsorption of phenol is mainly due to micropore filling [46]. The
adsorption capacities of the developed adsorbents were compared with other adsorbents derived from different raw materials
(Table 3). The adsorbents developed and used in this study have
higher adsorption capacity for the adsorption of phenol as com-
Table 2
Langmuir isotherm constants for the adsorption
Adsorbent
Phenol
SAC
ATSAC
10 ◦ C
25 ◦ C
40 ◦ C
Q0 (×104 mol g−1 )
b (×10−3 L mol−1 )
R2
Q0 (×104 mol g−1 )
b (×10−3 L mol−1 )
R2
Q0 (×104 mol g−1 )
b (×10−3 L mol−1 )
R2
3.22
4.13
28.14
2.73
0.99
0.76
3.63
5.32
24.63
3.76
0.99
0.96
4.85
5.17
21.46
6.28
0.99
0.95
4.86
16.52
0.98
0.99
1.97
3.07
8.46
24.94
0.98
0.99
2.34
3.99
14.32
35.11
0.99
0.99
2,4-Dichlorophenol
SAC
1.94
ATSAC 2.69
K.P. Singh et al. / Journal of Hazardous Materials 150 (2008) 626–641
633
Table 3
Adsorption capacities of various adsorbents for phenol
Adsorbent
Temperature (◦ C)
Q0 (mmol g−1 )
Reference
Bagasse fly ash
30
40
50
0.007
0.006
0.005
[1]
23.26
23.26
0.35
0.43
Carbonized bark
Data 1
Data 2
[31]
Oil-shale
KOH-OS
ZnCl2 -OS
[48]
Tamarind nut (TNSAC)
Date pits
Coconut shells
SAC
–
–
0.049
0.081
–
25
0.045
0.185
10
25
40
10
25
40
0.32
0.36
0.49
0.41
0.53
0.52
[49]
[50]
Present study
ATSAC
pared to those derived from bagasse fly ash, oil-shale, tamarind
nut and date pits, whereas, it is comparable with that of the
carbon developed from carbonized bark. The Langmuir constant ‘b’ reflects the affinity of the adsorbent for the solute.
For the adsorption of phenol the values of ‘b’ are relatively
higher for SAC indicating more stable bond/complex with carbon surface, while, for adsorption of 2,4-dichlorophenol ATSAC
showed higher ‘b’ values in comparison to SAC. The type (Htype) of isotherms for the adsorption of phenol on SAC (Fig. 5a)
and 2,4-dichlorophenol (Fig. 5b) on ATSAC also suggests for
the high affinity of the adsorbent. The essential characteristic of
the Langmuir isotherm can be expressed in terms of a dimensionless equilibrium factor RL that is defined as RL = 1/1 + bC0 ,
where b is the Langmuir constant and C0 is the initial concentration of adsorbate [51]. RL values obtained (data not shown) at
different concentrations and temperatures are between 0 and 1,
indicating favourable adsorption of both adsorbates on activated
carbons developed from the agricultural waste material.
The Freundlich isotherms for the adsorption of phenol and
2,4-dichlorophenol on SAC and ATSAC at different temperatures are presented in Fig. 7a and b, respectively. The linear
plots of log qe versus log Ce show that adsorption of phenol
and 2,4-dichlorophenol on the SAC and ATSAC also follows
the Freundlich isotherm model. The corresponding Freundlich
Fig. 7. Freundlich adsorption isotherms of phenol and 2,4-dichlorophenol on
(a) SAC and (b) ATSAC at different temperatures and optimum pH.
isotherm parameters along with the correlation coefficients are
given in Table 4. The value of 0 < 1/n < 1.0 exhibits the favourability of adsorption onto activated carbons [52]. The correlation
coefficients showed that in general, the Langmuir model fitted
the results slightly better than the Freundlich model.
The thermodynamic parameters mainly free energy ( G◦ ),
enthalpy ( H◦ ) and entropy ( S◦ ) changes were calculated
using Eqs. (6)–(8), respectively, to characterize the equilibrium of the system. The reference state was defined based on
adsorption density in mol g−1 of adsorbent and concentration in
mol L−1 :
G◦ = −RT ln k
(6)
Table 4
Freundlich isotherm constants for the adsorption
Adsorbent
10 ◦ C
25 ◦ C
40 ◦ C
KF (×103 mol g−1 )
1/n
R2
KF (×103 mol g−1 )
1/n
R2
KF (×103 mol g−1 )
1/n
R2
0.94
14.74
0.15
0.55
0.84
0.89
0.98
47.05
0.14
0.64
0.89
0.95
1.47
19.77
0.16
0.51
0.91
0.94
2,4-Dichlorophenol
SAC
3.67
ATSAC
2.14
0.44
0.29
0.98
0.95
1.67
1.03
0.31
0.17
0.97
0.99
2.69
1.33
0.34
0.16
0.88
0.89
Phenol
SAC
ATSAC
634
K.P. Singh et al. / Journal of Hazardous Materials 150 (2008) 626–641
Table 5
Thermodynamic parameters of the adsorption
Adsorbent
− G◦ (kJ mol−1 )
H◦ (kJ mol−1 )
S◦ (kJ mol−1 K−1 )
10 ◦ C
25 ◦ C
40 ◦ C
24.10
18.62
25.05
20.40
25.96
22.76
−6.65
20.45
0.063
0.14
2,4-Dichlorophenol
SAC
19.67 22.41
ATSAC 22.85 15.08
24.90
27.24
26.55
18.51
0.16
0.15
Phenol
SAC
ATSAC
ΔH ◦ = R
T2 T 1
T2 − T 1
ln
k2
k1
(7)
H ◦ − G◦
(8)
T
where k is the Langmuir constant same as b at different temperatures. The values obtained from thermodynamic
analysis are given in Table 5. Positive values of H◦ and
S◦ (for phenol-ATSAC, 2,4-dichlorophenol-SAC and 2,4dichlorophenol-ATSAC) indicate the endothermic nature of the
process. In case of phenol-SAC system negative value of H◦
with positive S◦ indicates that the process is favourable at all
the temperatures [53]. The negative values of G◦ for adsorption of phenol and 2,4-dichlorophenol indicate the feasibility
and spontaneous nature of adsorption.
S◦ =
3.3. Kinetic studies
Concentration-time profiles for the adsorption of different
adsorbates onto activated carbons at different experimental conditions are shown in Figs. 8 and 9. The extent of adsorption
of both the adsorbates on SAC and ATSAC and their rate of
removal are found to increase with temperature (Fig. 8a and b).
The rate of removal of both the phenols increasing along with the
increasing temperature indicates the endothermic nature of the
process resembling with the results of thermodynamic analysis.
The effect of adsorbent amount and initial adsorbate concentration on the removal of phenol at different carbons has also been
studied. The rate of uptake increased with an increase in adsorbent amount (Fig. 1), whereas it increases with the increase in
the initial concentration (Fig. 9a and b). The adsorption rate data
for the studied adsorbates onto the developed activated carbons
were analysed using two kinetic models viz., pseudo-first-order-
Fig. 8. Effect of temperature on the uptake of phenol and 2,4-dichlorophenol
on (a) SAC and (b) ATSAC at optimum pH; adsorbent amount = 1.0 g L−1 ;
C0 = 5 × 10⁻⁴ mol L−1 .
equation and pseudo-second-order-equation were tested. Both
the models were studied at different temperatures to find out
the effect of temperature on the rate-equation parameters. It
was observed that the pseudo-first-order rate-constant (k1 ) as
well as the pseudo-second-order-rate-equation parameters (k2 ,
v0 and qe ) generally increased with an increase in the temperature (Tables 6 and 7, respectively). The validity of the above two
models was checked by studying the kinetics under different initial adsorbate concentrations as, in the case of first-order kinetic
reaction, the half life time is independent from the initial adsorbate concentration. The adsorption parameters of first-order and
second-order rate equations were calculated at three different
initial concentrations of the each adsorbate viz., phenol and
Table 6
First-order rate constants for the adsorption at different temperatures
Adsorbent
10 ◦ C
25 ◦ C
40 ◦ C
k1 (×103 min−1 )
R2
k1 (×103 min−1 )
R2
k1 (×103 min−1 )
R2
Phenol
SAC
ATSAC
0.94
0.95
0.87
0.97
1.36
1.27
0.86
0.79
1.86
1.29
0.95
0.90
2,4-Dichlorophenol
SAC
ATSAC
0.94
0.74
0.88
0.96
0.83
1.16
0.65
0.89
1.51
1.04
0.92
0.94
K.P. Singh et al. / Journal of Hazardous Materials 150 (2008) 626–641
635
Table 7
Second-order rate constants at different temperatures
Adsorbent
Phenol
SAC
ATSAC
10 ◦ C
25 ◦ C
V0 a (×106 )
k2 a
qe a (×104 )
R2
t1/2
V0 (×106 )
k2
qe (×104 )
R2
t1/2
V0 (×106 )
k2
qe (×104 )
R2
t1/2
0.86
0.90
9.63
16.91
2.99
2.30
0.97
0.99
3.65
5.76
1.08
1.33
9.88
11.67
3.30
3.38
0.99
0.97
2.39
2.47
1.70
3.61
13.19
29.06
3.59
3.52
0.99
0.99
3.00
3.85
29.85
15.30
1.53
1.89
0.98
0.97
5.79
4.29
1.59
1.28
30.75
35.53
2.27
1.90
0.96
0.99
5.11
4.23
1.47
1.13
21.03
16.44
2.64
2.63
0.97
0.99
3.52
1.63
2,4-Dicholorophenol
SAC
0.70
ATSAC 0.54
a
40 ◦ C
V0 = (mol g−1 min−1 ), k2 = (g mol−1 min−1 ), qe = (mol g−1 ).
2,4-dichlorophenol using different studied carbons. The results
obtained from both the first and second-order rate equations are
summarized in Tables 8 and 9, respectively. Variation of halflife (t50 ) with initial adsorbate (phenol and 2,4-dichlorophenol)
concentration validates the adsorption reaction to be of the
second-order rather than the first-order one. The qe values were
calculated using the pseudo-first-order and the second-order-rate
equation and it was observed that the theoretical qe values calculated using the second-order-rate equation agree more accurately
with the experimental qe values at different temperatures and initial adsorbate concentrations (Tables 10 and 11, respectively).
These observations suggest that the studied sorption systems follow the second-order-rate equation instead of the first-order one.
Mohan et al. [41] and Al-Asheh et al. [48] have also reported
Table 8
First-order rate constants for the adsorption at different initial adsorbate concentrations
1 × 10⁻⁴ (mol L−1 )
Adsorbent
5 × 10⁻⁴ (mol L−1 )
1 × 10⁻³ (mol L−1 )
k1 (×103 min−1 )
R2
k1 (×103 min−1 )
R2
k1 (×103 min−1 )
R2
Phenol
SAC
ATSAC
1.85
7.17
0.66
0.93
1.36
1.27
0.86
0.79
1.14
1.06
0.88
0.92
2,4-Dichlorophenol
SAC
ATSAC
0.84
1.41
0.83
0.94
0.83
1.16
0.65
0.89
1.06
1.32
0.62
0.97
Table 9
Second-order rate constants at different initial adsorbate concentrations
Adsorbent
C0 = 1 × 10⁻⁴ (mol L−1 )
C0 = 5 × 10⁻⁴ (mol L−1 )
C0 = 1 × 10⁻³ (mol L−1 )
V0 a (×106 )
k2 a
qe a (×104 )
R2
V0 (×106 )
k2
qe (×104 )
R2
V0 (×106 )
k2
qe (×104 )
R2
0.70
2.84
77.89
97.79
0.95
1.03
0.99
0.99
1.08
1.33
9.88
11.67
3.30
3.38
0.99
0.97
1.46
4.47
4.82
21.19
5.51
4.59
0.95
0.99
2,4-Dichlorophenol
SAC
0.41
ATSAC
0.11
55.78
12.95
0.86
0.90
0.97
0.92
3.67
1.28
33.51
35.53
3.31
1.90
0.99
0.99
2.21
2.23
68.11
42.87
1.80
2.28
0.99
0.99
Phenol
SAC
ATSAC
a
V0 = (mol g−1 min−1 ), k2 = (g mol−1 min−1 ), qe = (mol g−1 ).
Table 10
Comparative evaluation of qe as calculated experimentally and by using first and second-order rate equations at different temperatures
Adsorbent
SAC
ATSAC
SAC
ATSAC
qe,exp (×104 mol g−1 )
qe,cal-1 (×104 mol g−1 )
qe,cal-2 (×104 mol g−1 )
10 ◦ C
25 ◦ C
40 ◦ C
10 ◦ C
25 ◦ C
40 ◦ C
10 ◦ C
25 ◦ C
40 ◦ C
2.91
2.25
1.52
1.87
3.08
3.27
2.38
1.87
3.34
3.47
2.66
2.55
2.31
1.59
1.01
1.42
2.51
2.39
1.21
1.04
2.61
1.54
1.82
1.72
2.99
2.30
1.53
1.89
3.30
3.38
2.27
1.90
3.59
3.52
2.64
2.63
qe,exp : experimental equilibrium concentration; qe,cal-1 : equilibrium concentration computed using first-order kinetic model; qe,cal-2 : equilibrium concentration
computed using second-order kinetic model.
qe,exp : experimental equilibrium concentration; qe,cal-1 : equilibrium concentration computed using first-order kinetic model; qe,cal-2 : equilibrium concentration computed using second-order kinetic model.
1.80
2.28
3.31
1.90
0.69
1.04
1.21
1.04
2,4-Dichlorophenol
SAC
0.88
ATSAC 0.69
2.38
1.80
4.26
1.94
2.51
2.39
0.86
0.90
0.56
0.72
1.84
2.25
3.30
3.38
0.62
0.38
5.16
4.51
Phenol
SAC
ATSAC
0.92
1.01
3.08
3.27
1 × 10⁻³ (mol L−1 )
1 × 10⁻⁴ (mol L−1 )
5 × 10⁻⁴ (mol L−1 )
5 × 10⁻⁴ (mol L−1 )
0.95
1.03
1 × 10⁻⁴ (mol L−1 )
1 × 10⁻⁴ (mol L−1 )
1 × 10⁻³ (mol L−1 )
5 × 10⁻⁴ (mol L−1 )
qe,cal-2 (×104 mol g−1 )
qe,cal-1 (×104 mol g−1 )
qe,exp (×104 mol g−1 )
Adsorbent
Table 11
Comparative evaluation of qe as calculated experimentally and by using first and second-order rate equations at different initial adsorbate concentrations
5.51
4.59
K.P. Singh et al. / Journal of Hazardous Materials 150 (2008) 626–641
1 × 10⁻³ (mol L−1 )
636
Fig. 9. Effect of initial adsorbate concentration on the uptake of phenol and
2,4-dichlorophenol on (a) SAC and (b) ATSAC at optimum pH; adsorbent
amount = 1.0 g L−1 ; temperature = 25 ◦ C.
the pseudo-second-order rate equation for the adsorption of
pyridine-derivative and phenol, respectively. Further, regression coefficients between experimental and calculated values
obtained for the first-order rate model (R2 = 0.77) and secondorder rate equation (R2 = 0.97) also indicate the suitability of the
second-order-rate equation for the adsorption of both phenols on
SAC and ATSAC.
The mass-transfer analysis of adsorbates during the process
was studied by using the mass transfer diffusion model [54]:
ln
Ct
1
−
C0
1 + mk
= ln
mk
mk
−
1 + mk
mk
β L Ss t
(9)
where Ct is the concentration of solute at time t (mol L−1 ), C0
the initial concentration of the solute (mol L−1 ), m the mass of
the adsorbent per unit volume of particle-free solution of solute
(g L−1 ), k the Langmuir constant (obtained by multiplying Q0
with (b), βL the mass transfer coefficient (cm s−1 ) and Ss is the
outer surface of the adsorbent per unit volume of particle-free
slurry (cm−1 ) and is calculated as:
Ss =
6m
(1 − εp )dp ρp
(10)
K.P. Singh et al. / Journal of Hazardous Materials 150 (2008) 626–641
637
where dp is the particle diameter (cm), ρp the density of adsorbent (g cm−1 ) and εp is the porosity of adsorbent particles.
The values of βL were determined from the slope and intercepts of the plots of ln{(Ct /C0 ) − (1/[(1 + mk)]} versus ‘t’,
for different temperatures and initial adsorbate concentrations
(Figs. 10 and 11, respectively) using the least squares method.
The linearity of the plots confirms the validity of the diffusion
model for the studied adsorbate-adsorbent systems. The values
of the mass transfer coefficient (βL ) of the adsorbates for both
the developed adsorbents (SAC and ATSAC) are presented in
Table 12. The values of βL increased with an increase in the temperature, suggesting endothermic nature of the reaction. Further,
it was found that increasing the initial adsorbate concentration
results in a decrease in the external mass transfer coefficient.
These findings are similar to those reported for the adsorption
of phenol by coconut-husk based activated carbon [18].
To interpret the experimental data, it is necessary to identify the rate-determining step controlling the removal rate in the
adsorption process. The three consecutive steps involved in the
adsorption of an organic/inorganic species by a porous adsorbent
are:
Fig. 11. McKay plots for the adsorption of phenol and 2,4-dichlorophenol on
(a) SAC and (b) ATSAC at different initial concentrations (optimum pH; temperature = 25 ◦ C).
(1) transport of the adsorbate to the external surface of the
adsorbent (film-diffusion);
(2) transport of the adsorbate within the pores of the adsorbent
except for a small amount of adsorption that occurs on the
external surface (particle diffusion);
(3) adsorption of the adsorbate on the external surface of the
adsorbent.
Fig. 10. McKay plots for the adsorption of phenol and 2,4-dichlorophenol
on (a) SAC and (b) ATSAC at different temperatures (optimum pH;
C0 = 5 × 10⁻⁴ mol L−1 ).
It is, generally, accepted that the process (3) is very rapid
and does not represent the rate-determining step in the uptake
of organic/inorganic species. For the remaining two steps in
the overall transport three distinct cases occur: (i) external
transport > internal transport; (ii) external transport < internal
transport; and (iii) external transport ≈ internal transport. In case
(i) and (ii) the rate is governed by film and particle diffusion,
respectively. In case (iii), the transport of ions to the boundary
may not be possible at a significant rate, leading to the formation of a liquid film with a concentration gradient surrounding
sorbent particles. Usually, external transport is the rate limiting
step in systems having (a) poor mixing; (b) dilute concentration of adsorbate; (c) small particle size; and (d) high affinity of
adsorbent, whereas, intra-particle step limits the overall transfer
for the systems which have (a) high concentration of adsorbate;
0.82
0.90
(b) good mixing; (c) large particle size of adsorbent; and (d)
low affinity of adsorbent for adsorbate. The kinetic studies data
were analyzed by the procedure given by Reichenberg [55] and
Helffrich [56] using following equations:
0.5
0.62
F =1−
2.94
1.01
βL (×107 cm s−1 )
1 × 10⁻³ (mol L−1 )
0.92
0.81
K.P. Singh et al. / Journal of Hazardous Materials 150 (2008) 626–641
R2
638
6
π2
∞
1
−Di tπ2 n2
exp
n2
r02
n=1
(11)
0.83
0.79
0.92
0.92
∞
n=1
1
exp[−n2 Bt ]
n2
(12)
2.92
1.47
0.97
0.96
4.36
2.53
0.91
0.97
37.46
6.46
0.86
0.88
3.62
2.69
0.83
0.82
0.91
0.94
2,4-Dichlorophenol
SAC
2.08
ATSAC
1.47
2.92
1.82
0.92
0.92
5.27
2.68
0.88
0.74
11.49
37.39
B=
4.36
2.53
Qt
Q0
where Qt is the amount of adsorbate taken up at time ‘t’ and Q0
is the maximum equilibrium uptake and:
0.95
0.91
R2
βL (×107 cm s−1 )
R2
R2
6
π2
F=
3.86
1.17
βL (×107 cm s−1 )
βL (×107 cm s−1 )
40 ◦ C
Adsorbent
Table 12
Mass transfer coefficients (βL ) at different temperatures and initial adsorbate concentrations
F =1−
where F is the fractional attainment of equilibrium at time ‘t’
and is obtained by the expression:
Phenol
SAC
ATSAC
βL (×107 cm s−1 )
1 × 10⁻⁴ (mol L−1 )
10 ◦ C
βL (×107 cm s−1 )
Initial concentrations
25 ◦ C
Temperature
R2
5 × 10⁻⁴ (mol L−1 )
R2
or
π 2 Di
r02
(13)
(14)
where Di is the effective diffusion coefficient of adsorbate in the
adsorbent phase, r0 the radius of the adsorbent particle, assumed
to be spherical, and ‘n’ is an integer that defines the infinite series
solution.
Bt values were obtained for each observed value of F, from
Reichenberg’s table [55] and the results are plotted in Fig. 12a
and b. The linearity test of Bt versus t plots was employed to
distinguish between the film diffusion and particle diffusion controlled adsorption. If the plots of Bt versus ‘t’ (having slope B)
is a straight line passing through the origin, then the adsorption rate is governed by particle diffusion mechanism, otherwise
it is governed by film diffusion. In case of SAC the Bt versus ‘t’ plot for adsorption of phenol, at lower concentrations
(<1 × 10⁻³ mol L−1 ) and for 2,4-dichlorophenol (at initial concentration > 1 × 10⁻⁴ mol L−1 ) do not pass through the origin,
suggesting that the rate controlling process may be the film diffusion. In case of ATSAC, Bt versus t plots for phenol (at all the
studied concentrations) and 2,4-dichlorophenol (at higher concentrations (>5 × 10⁻⁴ mol L−1 ) do not pass through the origin.
This suggests that here also the film diffusion process may be the
rate-controlling step. However, in all the cases the Bt versus “t”
plots (curved at later stage) can be resolved into two plots with
different slopes, indicating change in the adsorption mechanism
with time. It has also been suggested that change in the slope
indicate the existence of different sizes of pores [57]. Similar
types of observations have been reported for sorption of phenol
[48] and metals [58]. In our study, the later portion of the curves,
the slope increases and consequently the diffusion coefficient
(Di ) increases. At this stage, in addition to film-diffusion other
factors such as aggregation and electrokinetic interactions may
also contribute [58]. The effective diffusion coefficients (Di ),
for the adsorption on both the adsorbents (SAC and ATSAC)
estimated from the slops of the Bt versus t plots (for the initial
portion) decreases with an increase in the initial concentration
0.94
0.99
3.38
1.66
0.94
0.73
2.31
1.62
0.97
0.97
1.86
1.32
0.83
0.95
0.97
1.73
0.62
0.89
0.88
0.97
2,4-Dichlorophenol
SAC
1.29
ATSAC
0.93
1.23
1.44
0.60
1.58
0.97
0.76
1.14
1.75
0.93
0.97
1.51
6.56
0.83
0.92
1.21
1.84
0.85
0.76
1.84
1.75
0.93
0.98
R2
Di (×1014 m2 s−1 )
R2
40 ◦ C
R2
2.84
1.27
Phenol
SAC
ATSAC
Di (×1014 m2 s−1 )
Di (×1014 m2 s−1 )
Di (×1014 m2 s−1 )
Di (×1014 m2 s−1 )
1 × 10⁻⁴ (mol L−1 )
25 ◦ C
10 ◦ C
R2
Di (×1014 m2 s−1 )
R2
1 × 10⁻³ (mol L−1 )
5 × 10⁻⁴ (mol L−1 )
Initial concentrations
Temperature
Adsorbent
of the phenol. However, the values of Di were found to increase
with the increasing initial concentration of 2,4-dichlorophenol
(Table 13). Increase in the Di values with increasing initial concentration may be explained as increasing solute concentration
in the solution may reduce the diffusion of solute in the boundary
layer and may enhance the diffusion in the solid as have been
reported for the adsorption of the phenol onto activated carbon [17,18]. The effective diffusion coefficients (Di ) were also
estimated at different temperatures (plots omitted for brevity)
and are given in Table 13. Diffusion coefficient values for the
SAC-adsorbate system at different temperatures were observed
to decrease with an increase in temperature, while, the values of
diffusion coefficient for ATSAC-adsorbate system were found
to increase with an increase in temperature. Mohan et al. [41]
have also reported similar trend of Di values with the change in
temperature for the adsorption of pyridine derivatives onto activated carbon, suggesting that the increased mobility of adsorbate
molecules and a decrease in retarding forces acting on the diffusing adsorbate molecules results in the increase of Di values
with temperature.
The energy of activation (Ea ), entropy of activation ( S# )
and pre-exponential factor (D0 ) analogous to the Arrhenius
Table 13
Diffusion coefficients (Di ) at different temperatures and initial adsorbate concentrations
Fig. 12. Bt vs. t plots for the adsorption of phenol and 2,4-dichlorophenol
on (a) SAC and (b) ATSAC at different initial concentrations (optimum pH;
temperature = 25 ◦ C).
0.92
0.93
639
R2
K.P. Singh et al. / Journal of Hazardous Materials 150 (2008) 626–641
640
K.P. Singh et al. / Journal of Hazardous Materials 150 (2008) 626–641
Table 14
Thermodynamic parameters of activation
Adsorbent
D0 (m2 s−1 )
Ea (kJ mol−1 )
− S# (J K−1 mol−1 )
Phenol
SAC
ATSAC
3.9 × 10⁻¹⁸
6.6 × 10⁻¹³
20.96
9.21
230.45
130.26
2,4-Dichlorophenol
SAC
6.8 × 10⁻¹⁶
ATSAC
1.2 × 10⁻¹²
7.01
11.06
187.41
125.53
References
frequency factor were also determined (Table 14) using the
following equations:
Di = D0 exp −
D0 = 2.72d 2
Ea
RT
kT
exp
h
(15)
S#
R
and his keen interest in this work. The authors are also thankful
to Professor Vicente Gomez Serrano, Universidad Extremadura,
Spain for carrying out the characterization of the prepared adsorbents.
(16)
where k is the Boltzman constant, h = Planck constant, R = gas
constant, and d is the distance between two active sites of the
˚ in inorganic ion
adsorbent which is conventionally taken as 5 A
exchangers, minerals and other adsorbents similar to carbon. The
negative S# values for the adsorption of phenol on activated
carbons indicate that no significant changes occur in the internal
structure of adsorbent material using adsorption.
4. Conclusions
Activated carbons developed from the coconut shells were
characterized for various physical/chemical properties and studied for the adsorption of phenol and 2,4-dichlorophenol under
different conditions. Adsorption of both the phenols increased
with an increase in temperature. Both the Freundlich and Langmuir isotherm models adequately fit to the adsorption data. The
pseudo-second-order-rate model better explained the adsorption
kinetics as compared to the pseudo-first-order-rate model. The
adsorption capacity (at 25 ◦ C) of SAC and ATSAC for phenol
was 0.36 and 0.53 mmol g−1 , respectively. In case of 2,4-DCP
the adsorption capacity of SAC and ATSAC was about 0.20 and
0.31 mmol g−1 , respectively. The adsorbent developed after the
chemical treatment (ATSAC) exhibited relatively higher monolayer adsorption capacity for the phenol and 2,4-dichlorophenol
as compared to the one developed with thermal activation (SAC).
Results of mass transfer analysis suggested the endothermic
nature of the reaction and change in the mechanism with time and
initial concentration of the adsorbate. The adsorption capacities
of developed adsorbents are higher than those derived from other
waste materials such as bagasse fly ash, oil-shale, tamarind nut
and date pits. The results of this study show that the activated
carbons derived from coconut shells can be used as potential
adsorbent for phenols in water/wastewater.
Acknowledgements
The authors thank the Director, Industrial Toxicology
Research Centre, Lucknow for providing the necessary facilities
[1] V.K. Gupta, S. Sharma, I.S. Yadav, D. Mohan, Utilization of bagasse fly ash
generated in the sugar industry for the removal and recovery of phenol and
p-nitrophenol from wastewater, J. Chem. Technol. Biotechnol. 71 (1998)
180–186.
[2] R. Spandre, G. Dellomonaco, Polyphenol pollution by olive mill waste
waters, Tuscany, Italy, J. Environ. Hydrol. 4 (1996) 1–13.
[3] ATSDR (Agency for Toxic Substances and Disease Registry), Toxicological Profile for Phenol, US Department of Health and Human Services,
USA, 1998.
[4] USEPA, Technical Support Document for Water Quality Based Toxics Control. EPA/440/485032, United States Environmental Protection Agency,
Washington, DC, USA, 1985.
[5] BIS, Tolerance Limit for Industrial Effluents Discharged into Inland Surface Waters: Coke Oven. IS 2490 (Part 1), Bureau of Indian Standards,
New Delhi, 1974.
[6] C. Barbeau, L. Deschenes, D. Karamanev, Y. Comeau, R. Samson, Bioremediation of pentachlorophenol contaminated soil by bio-augmentation
using activated soil, Appl. Microbiol. Biotechnol. 48 (1997) 745–752.
[7] E. Leyva, E. Moctezuma, M.G. Ruiz, L. Torresmartinez, Photo-degradation
of phenol and 4-chlorophenol by BaO–Li2 O–TiO2 catalysts, Catal. Today
40 (1998) 367–376.
[8] A. Agrios, K. Gray, E. Weitz, Photocatalytic transformation of 2,4,5trichlorophenol on TiO2 under sub-band-gap illumination, Langmuir 19
(2003) 1402–1409.
[9] I.Z. Shirgaonkar, A.B. Pandit, Sonophotochemical destruction of aqueous
solution of 2,4,6-trichlorophenol, Ultrason. Sonochem. 5 (1998) 53–61.
[10] A.B. Pandit, P.R. Gogate, S. Mujumdar, Ultrasonic degradation of 2:4:6
trichlorophenol in presence of TiO2 catalyst, Ultrason. Sonochem. 8 (2001)
227–231.
[11] I.D. Buchanan, J.A. Micell, Peroxidase catalyzed removal of aqueous phenol, Biotechnol. Bioeng. 54 (1997) 251–261.
[12] M.C. Burleigh, M.A. Markowitz, M.S. Spector, B.P. Gaber, Porous polysilsesquioxanes for the adsorption of phenols, Environ. Sci. Technol. 36
(2002) 2515–2518.
[13] K.P. Singh, D. Mohan, S. Sinha, G.S. Tandon, D. Ghosh, Colour removal
from wastewater using low cost activated carbon derived from agricultural
waste material, Ind. Eng. Chem. Res. 42 (2003) 1965–1976.
[14] N.A. Darwish, K.A. Halhouli, N.M. Al-Dhoon, Adsorption of phenol from
aqueous systems onto oil shale, Sep. Sci. Technol. 31 (1996) 705–714.
[15] K. Srinivasan, P.B.S. Rao, A. Ramadevi, Studies on characteristics of carbon obtained from tamarind nut, Ind. J. Environ. Hlth. 30 (1998) 303–311.
[16] C. Flock, A. Bassi, M. Gijzen, Removal of aqueous phenol and 2chlorophenol with purified soybean peroxidase and raw soybean hulls, J.
Chem. Technol. Biotechnol. 74 (1999) 303–309.
[17] N.B. Sankaran, T.S. Anirudhan, Adsorption dynamics of phenol on activated carbon produced from Salvinia molta Mitchell by single-step steam
pyrolysis, Indian J. Eng. Mater. Sci. 6 (1999) 229–238.
[18] V.P. Vinod, T.S. Anirudhan, Effect of experimental variables on phenol
adsorption on activated carbon prepared from coconut husk by single-step
steam pyrolysis: mass transfer process and equilibrium studies, J. Sci. Ind.
Res. 61 (2002) 128–138.
[19] Al. Vogel, A Text Book of Quantitative Chemical Analysis, ELBS Publication, London, England, 1991.
[20] G. McKay, Use of Adsorbents for the Removal of Pollutants from Wastewater, CRC Press, Boca Raton, FL, 1995.
[21] W.J. Weber Jr., Physico-chemical Processes for Water Quality Control,
Wiley–Interscience, New York, 1972.
[22] D. Mohan, K.P. Singh, Single- and multi-component adsorption of cadmium and zinc using activated carbon derived from bagasse-an agricultural
waste, Water Res. 36 (2002) 2304–2318.
K.P. Singh et al. / Journal of Hazardous Materials 150 (2008) 626–641
[23] K. Laszlo, E. Tombacz, P. Kerepesi, Surface chemistry of nanoporous
carbon and the effect of pH on adsorption from aqueous phenol and 2,3,4trichlorophenol solutions, Colloid Surf. A: Physicochem. Eng. Aspects 13
(2004) 230–238.
[24] E. Tutem, R. Apak, G.F. Unal, Adsorptive removal of chlorophenols from
water by bituminous shale, Water Res. 32 (1998) 2315–2324.
[25] Z. Reddad, C. Gerente, Y. Andres, P.L. Cloirec, Adsorption of several metal
ions onto a low-cost biosorbent: kinetic and equilibrium studies, Environ.
Sci. Technol. 36 (2002) 2067–2073.
[26] C. Ishizaki, I. Marti, Surface oxide structures on a commercial activated
carbon, Carbon 19 (1981) 409.
[27] V.A. Garten, D.E. Weiss, A new interpretation of the acidic and basic
structures in carbons, Aust. J. Chem. 10 (1957) 295–308.
[28] C. Selomulya, V. Meeyoo, R. Amal, Mechanisms of Cr(VI) removal from
water by various types of activated carbons, J. Chem. Technol. Biotechnol.
74 (1999) 111–122.
[29] F. Rodriguez-Reinoso, Activated carbon: structure characterization preparation and applications, in: H. Marsh, E.A. Heintz, F. Rodriguez-Reinoso
(Eds.), Introduction to Carbon Technologies, Chapter, 1997.
[30] A. Dabrowski, P. Podkoscielny, Z. Hubicki, M. Barczak, Adsorption of
phenolic compounds by activated carbon—a critical review, Chemosphere
58 (2005) 1049–1070.
[31] R.U. Edgehill, G.Q. Lu, Adsorption characteristics of carbonized bark for
phenol and pentachlorophenol, J. Chem. Technol. Biotechol. 71 (1998)
27–34.
[32] P. Podkoscielny, A. Dabrowski, O.V. Marijuk, Heterogeneity of active carbons in adsorption of phenol aqueous solutions, Appl. Surf. Sci. 205 (2003)
297–303.
[33] D.M. Nevskaia, A. Santianes, V. Munoz, A. Guerrero-Ruiz, Interaction
of aqueous solutions of phenol with commercial activated carbons: an
adsorption and kinetic study, Carbon 37 (1999) 1065–1074.
[34] R. Quadeer, A.H. Rehan, A study of the adsorption of phenol by activated
carbon from aqueous solutions, Turk. J. Chem. 26 (2002) 357–361.
[35] A. Bembnowska, R. Pelech, E. Milchert, Adsorption from aqueous solutions of chlorinated organic compounds onto activated carbons, J. Colloid
Interf. Sci. 265 (2003) 276–282.
[36] D. Mohan, K.P. Singh, S. Sinha, D. Ghosh, Removal of pyridine from
aqueous solution using low-cost activated carbons derived from agricultural
waste material, Carbon 42 (2004) 2409–2421.
[37] J.F. Garcia-Araya, F.J. Beltran, P. Alvarez, F.J. Masa, Activated carbon
adsorption of some phenolic compounds present in agroindustrial wastewater, Adsorption 9 (2003) 107–115.
[38] F.A. Banat, B. Al-Bashir, S. Al-Asheh, O. Hayajneh, Adsorption of phenol
by bentonite, Environ. Pollut. 107 (2000) 391–398.
[39] N. Khalid, S. Ahmad, A. Toheed, J. Ahmad, Potential of rice husk for
antimony removal, Appl. Radiat. Isotopes 52 (2000) 30–38.
[40] S. Nouri, F. Haghseresht, Adsorption of p-nitrophenol in untreated and
treated activated carbon, Adsorption 10 (2004) 79–86.
641
[41] D. Mohan, K.P. Singh, S. Sinha, D. Ghosh, Removal of pyridine derivatives from aqueous solution using low-cost activated carbons derived from
agricultural waste material, Carbon 43 (2005) 1680–1693.
[42] L.R. Radovic, C. Moreno-Castilla, J. Rivera-Utrilla, Carbon materials as
adsorbents in aqueous solutions, in: L.R. Radovic (Ed.), Chemistry and
physics of Carbon, vol. 27, Marcel Dekker, New York, 2001.
[43] C. Moreno-Castilla, Adsorption of organic molecules from aqueous solutions on carbon materials, Carbon 42 (2004) 83–94.
[44] A.P. Terzyk, Further insights into the role of carbon surface functionalities
in the mechanism of phenol adsorption, J. Colloid Interf. Sci. 268 (2003)
301–329.
[45] C.H. Giles, T.H. MacEwan, S.N. Nakhwa, D.C. Smith, Studies in adsorption. Part XI. A system of classification of solution adsorption isotherms,
and its use in diagnosis of adsorption mechanisms and in measurement of
specific surface areas of solids, J. Chem. Soc. 3 (1960) 3973–3993.
[46] F. Su, L. Lv, T.M. Hui, X.S. Zhao, Phenol adsorption on zeolite-templated
carbons with different structural and surface properties, Carbon 43 (2005)
1156–1164.
[47] J.S. Mattson, H.B. Mark Jr., M.D. Malbin, W.J. Weber Jr., J.C. Crittenden, Surface chemistry of active carbon: specific adsorption of phenols, J.
Colloid Interf. Sci. 31 (1969) 116–130.
[48] S. Al-Asheh, F. Banat, A. Masad, Physical and chemical activation of
pyrolyzed oil shale residue for the adsorption of phenol from aqueous
solutions, Environ. Geol. 44 (2003) 333–342.
[49] V.V. Goud, K. Mohanty, M.S. Rao, N.S. Jayakumar, Phenol removal from
aqueous solutions by tamarind nutshell activated carbon: batch and column
studies, Chem. Eng. Technol. 28 (2005) 814–821.
[50] M.A. Abdulkarim, N.A. Darwish, Y.M. Magdy, A. Dwaidar, Adsorption of
phenolic compounds and methylene blue onto activated carbon prepared
from date fruit pits, Eng. Life Sci. 2 (2002) 161–165.
[51] T.W. Weber, R.K. Chakravorti, Pore and solid diffusion models for fixedbed adsorbers, J. Am. Inst. Chem. Eng. 20 (1974) 228–238.
[52] G. McKay, H.S. Blair, J.R. Garden, Adsorption of dyes on chitin. I. Equilibrium studies, J. Appl. Poly. Sci. 27 (1982) 3043–3057.
[53] J.C. Kuriacose, J. Rajaram, Chemistry in engineering and technology General and Physical Chemistry, vol. 1, Tata McGraw-Hill, New Delhi, India,
1984.
[54] G. McKay, M.S. Otterburn, A.G. Sweeney, Surface mass transfer process
during colour removal from effluent using silica, Water Res. 15 (1981)
327–331.
[55] D. Reichenberg, Properties of ion-exchange resin in relation to their structure. III. Kinetics of exchange, J. Am. Chem. Soc. 75 (1953) 589–597.
[56] F. Helffrich, Ion-exchange, McGraw-Hill, New York, 1962.
[57] S.M. Hasany, M.M. Saeed, M. Ahmad, Adsorption isotherms and thermodynamic profile of Co(II)SCN complex uptake on polyurethane foam, Sep.
Sci. Technol. 35 (2000) 379–394.
[58] V.K. Gupta, S. Sharma, Removal of cadmium and zinc from aqueous
solutions using red mud, Environ. Sci. Technol. 36 (2002) 3612–3617.