WRCC El Nino Impacts and Outlook September 2015
Bạn đang xem bản rút gọn của tài liệu. Xem và tải ngay bản đầy đủ của tài liệu tại đây (1.32 MB, 2 trang )
Western Region
September 2015
El Niño Impacts
and Outlook
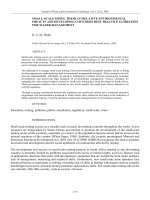
Typical El Niño Winter Weather Pattern
El Niño and the West
A strong El Niño is predicted during winter
2015/16.
El Niño is a warming of the Pacific Ocean
that occurs along the equator between
South America and the Date Line and can
influence the storm track over the West. El
Niño conditions do not “cause” individual
storms but rather influence their frequency
and characteristics.
El Niño is typically associated with wetter
than normal conditions along the southern
third of California eastward following the
U.S.-Mexico border and drier than normal
conditions in the Inland Northwest and
northern Rockies.
El Niño is not usually a good predictor
of winter precipitation for northern
NOAA climate.gov
California and the northern Great Basin,
Typical El Niño jet stream patterns across the U.S. during the winter include a more
though model simulations suggest a very
persistent than usual storm track entering the Southwest U.S. bringing wetter than
strong El Niño may drive above normal
normal conditions. The Northwest U.S. is then removed from the storm track, resulting precipitation in this area and further north.
in a drier than normal winter season.
Climate Outlook and El Niño Connections
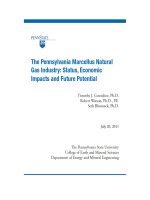
Winter Temperature and Precipitation Outlook
Climate Prediction
Center Outlooks
Produced August 20, 2015
for Dec-Jan-Feb 2015/16
Numbers indicate percent
chance of temperature
in warmest one-third and
of precipitation in wettest
one-third
CPC // .
ncep.noaa.gov/products/
predictions/long_range/
Temperature
Precipitation
The official NOAA outlooks for Dec-Jan-Feb temperature and precipitation
for the West reflect the development of a strong El Niño during this period.
Above normal temperatures and below normal precipitation are anticipated
in the Pacific Northwest and northern Rockies. There is a 50% chance that
winter precipitation totals will be in the top 33% of historic values across far
southern California, Arizona, and New Mexico. The forecast is less confident
moving northward. These outlooks are likely to change as we track the progress
of El Niño and other climate variables in the coming months. This El Niño
event is forecast to rival previous strong El Niño events, such as 1982/83
and 1997/98. During those events, above normal precipitation extended
northward into northern California, the Great Basin, and the coastal Pacific
Northwest. However, no two years are identical even when a strong El Nino
is present. There are other sources of variability and uncertainty that can
impact this winter’s weather. These include background warming of the ocean
and atmosphere, unique ocean temperature patterns, and other atmospheric
patterns besides El Niño.
Contacts: Kelly Redmond ()
Nina Oakley ()
Past Strong El Niño Events
Event since 1950
Year (Oct-Mar)
Maximum ONI Value
1
1957/1958
1.7
2
1965/1966
1.8
3
1972/1973
2.0
4
1982/1983
2.1
5
1991/1992
1.6
6
1997/1998
2.3
7 (TBD)
2015/2016
2.3 (predicted)
Above: El Niño events with an Oceanic
Niño Index (ONI), an indicator based
on equatorial SSTs, peaking at >=1.5.
Below: 92% of 26 dynamical and
statistical climate models favor a strong
El Niño, with most peaking during the
late fall or early winter of 2015/16.
El Niño Strength 2015/16
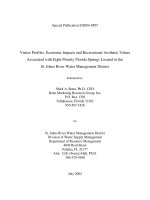
Highlight: El Niño and California
California Precipitation During Prior “Strong” El Niño Events
1957/58
1965/66
1972/73
El Niño and California Drought
200%
Wet
100%
Normal
1982/83
1991/92
1997/98
Dry
25%
Image courtesy of NWS Sacramento
Data: PRISM, OSU
Above: Precipitation total by Water Year (Oct 1- Sep 30). Of the 6 strong El Niños on
record, only half produced statewide above normal precipitation: 1957/58, 1982/83, and
1997/98. Flooding in California can occur in both El Niño and non-El Niño years. Most
of the state’s largest floods occured during non-El Niño conditions, such as in the winter
of 1996/97, a neutral year. Extreme rainfall and flooding in CA is often associated with
surges of subtropical moisture into the region that are known as atmospheric rivers
(ARs). Research suggests ARs are less frequent in the eastern Pacific during El Niño,
though the relationship between El Niño and ARs is the subject of active investigation.
California just experienced 4 years
of drought. Recovery from drought
in California is a multi-faceted issue.
Storm location is important as most of
California’s major reservoirs are located
in the northern part of the state where
the relationship between El Niño and
precipitation is generally weak. A healthy
Sierra Nevada snowpack is important
for drought recovery as well. Intensity
of precipitation also affects groundwater
replenishment and runoff into reservoirs; El
Niño does not provide insight to this.
Looking towards Red
Slate Peak and the
upper Convict Creek
watershed in the High
Sierra. Runoff from this
area provides water
resources to eastern
Sierra communities and
to Los Angeles via the
Los Angeles Aqueduct.
Photo: Ben Hatchett
March 2010
El Niños Past and Present
Current Sea Surface Temperature (SST) Anomalies
“The Blob”
El Niño area
Aug 23-Sep 2 2015
Western Region Partners
Left: Over the past 2 years,
much above normal SSTs were
observed across the northeastern
Pacific and along the U.S. West
Coast. Scientists are referring to
this area as “The Blob.”
Data: NOAA/ESRL/PSD
Images: Ben Hatchett, NV SCO
-4.5
-2
0
2
Degrees C, Base Period: 1981-2010
4.5
The Blob (above) formed under the persistent upper level ridge that has been present
over the eastern Pacific during much of the last 4 winters. Under the ridge, ocean waters
were warmed by the sun, reduced upwelling, and less wave mixing. The Blob’s influence
on winter 2015/16 is not well understood, though it is expected to play some role.
Past Strong El Niño SST Anomalies
December 1982
December 1997
Contacts: Kelly Redmond ()
Nina Oakley ()
Each El Niño event has
different characteristics that can
affect the way it impacts the
western US. Both the 1982/83
(left, top) and 1997/98 (left,
bottom) had SST anomalies
peak offshore of South America,
but other El Niño events
(2004/05, not shown) have
peaked towards the central
equatorial Pacific. Past very
strong El Niño events shown
to left did not have a “blob”like feature, so there is not a
good analog for this scenario.
Timing and characteristics of
precipitation during El Niño
events may vary as well; CA’s
8-Station Index saw well above
normal precipitation in Oct/Feb/
Mar of 1982/83, but only during
Jan-Feb of 1997/98.
Western Regional Climate Center
wrcc.dri.edu
National Integrated Drought Information
System (NIDIS)
drought.gov
Western Region Climate Services Director
ncdc.noaa.gov/rcsd
Western Governors’ Association
westgov.org
Western States Water Council
westgov.org/wswc
NOAA/ESRL Physical Sciences Division
esrl.noaa.gov/psd
NOAA Climate Prediction Center
www.cpc.ncep.noaa.gov
National Centers for Environmental
Information (NCEI)
www.ncdc.noaa.gov
USDA/NRCS National Water and Climate
Center - www.wcc.nrcs.usda.gov
National Interagency Fire Center
www.nifc.gov
DOI WaterSMART
www.usbr.gov/WaterSMART
Western Water Assessment
wwa.colorado.edu
Climate Assessment for the Southwest
climas.arizona.edu
California Nevada Applications Program
meteora.ucsd.edu/cnap
Climate Impacts Research Consortium
pnwclimate.org/resources
NWS River Forecast Centers
water.weather.gov/ahps/rfc/rfc.php
NOAA Fisheries Service
www.nmfs.noaa.gov/
NWS Western Region Forecast Offices
www.wrh.noaa.gov/
State Climatologists
stateclimate.org