The job outlook for the class of 2005
Bạn đang xem bản rút gọn của tài liệu. Xem và tải ngay bản đầy đủ của tài liệu tại đây (505.01 KB, 25 trang )
What We’ll Cover
Job Market for New College Graduates
Who’s in Demand?
Preferred Methods of Hiring
The job market for new college graduates
Hiring Projections
by Sector
Overall,
employers plan
to increase hiring
of new college
graduates by
14.5 percent this
year
By Sector:
Manufacturers plan to
increase by 8.2%
Service employers plan
to increase by 21.6%
Govt/Nonprofit plan to
increase 3.2%
Hiring Expectations From 2004-05
to 2005-06
• Services
•
•
•
•
More
Fewer
Same
71.3%
14.7%
14%
Manufacturing 63.7%
22%
14.3%
Gov./Non-Profit 43.8%
25%
31.2%
_____________________________________
Total/Overall 66.5%
18.2%
15.3%
Projected Increases in Hiring
Projections By Region
•
•
•
•
Northeast-25.8% increase
South-17.6% increase
Midwest-0.8% increase
West-15.8% increase
Hiring Expectations by Regions
Region
More
Fewer
Same
◊Northeast
◊South
◊Midwest
◊West
66.7%
77.5%
60.3%
54.8%
17.6%
15.0%
15.9%
28.6%
15.7%
7.5%
23.8%
16.7%
Hiring Expectations by Employer Type
Employer Type
●Building Materials
2004-05Actual Hires
451
●Transportation
265
●Chemical/Applied Products 113
●Petroleum/Applied Products 219
●Computer Software Dev.
1263
●Financial Services
812
●Merchandising Retail/Whsa 1005
●Engineering/Surveying
228
●Accounting-Public
137
●Food/Beverage Processing
482
●Research Organizations
213
●Communication Services
439
●Mechanical Equipment
99
2005-06 Projected Hires
864
441
184
225
1880
1140
1264
225
170
586
187
364
63
% Change
91.7%
66.2%
62.4%
53.2%
48.9%
40.3%
25.8%
24.8%
24.5%
21.6%
-12.2%
-17.1%
-36.4%
Projected Campus Visits by Sector
Industry
►Service
Avg.
04-05 Actual Visits 05-06 Projected Visits
2326
2479
18 (campus visits per. yr.) 19
% Change
6.6%
►Manufacturing
Avg.
1731
18
1850
20
6.9%
►Govt./Non-Profit
Avg.
370
358
-3.2%
▲TOTAL
Avg.
4427
22
21
4687
18
5.9%
19
Employers Expectations for Fall Hires -2004 vs.
2005 and Salary Expectations
►More Hires
35.8%
►Same # of Hires
33.5%
►Unsure
27.4%
►Fewer Hires
3.3%
_________________________________________
▲Same Salaries
49.8%
▲Higher Salaries
46.9%
▲Lower Salaries
0.0%
▲Other
3.3%
The job market for new college graduates
Employer intentions for on-campus
recruiting during Spring 2005
Firm Plans
46.9%
Tentative plans
27.5%
No plans
14.2%
Unsure
9.3%
Other
2.2%
0%
10%
20%
30%
40%
50%
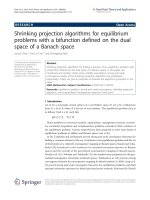
The job market for new college graduates
Hiring Projections by
Region-Projected College
Hires
+13.3%
+15.1%
+13.9%
+8.9%
Northeast
Midwest
Southern
Western
The job market for new college graduates
Northeast:
Spring recruiting plans:
76% plan to recruit on campus.
Targeting business administration, electrical engineering, mechanical engineering,
accounting, and computer science majors
Midwest:
Spring recruiting plans:
70% plan to recruit on campus.
Targeting accounting, economics/finance, business administration, mechanical
engineering, and computer science majors
South:
Spring recruiting plans:
More than 73% plan to recruit on campus.
Targeting business administration, accounting, mechanical engineering,
economics/finance, and electrical engineering majors
West:
Spring recruiting plans: More than 80% plan to recruit on campus.
Targeting electrical engineering, computer science, business administration, computer
engineering, and mechanical engineering majors.
Who’s In Demand?
Top Degrees In Demand
Doctoral Level
Bachelor’s Level
•Accounting
•Business Administration
•Electrical Engineering
•Economics/Finance
•Mechanical Engineering
•Computer Science
•Information Sciences
•Marketing Management
•Management Info Systems
•Computer engineering
Master’s Level
•Electrical Engineering
•Computer Engineering
•Chemistry
•Chemical Engineering
•Physics
•Mechanical Engineering
•M.B.A.s
•Electrical Engineering
•Mechanical Engineering
•Computer Science
•Computer Engineering
Who’s In Demand?
Who’s Hiring? (Bachelor’s level)
Major
most interested
employers
% of
respondents
Accounting………………………..accounting services……………………………………….. 100
utilities………………………………...…………………… 80
financial services……….……………………..…………… 67
Business admin…………………...merchandisers……………………………………….……… 79
food/beverage process .mfg……………...………….……... 70
financial services……………………………..….…….…… 58
Electrical Engineering…………….Electrical./electronic machinery &equip. mfg…………..…. 90
Utilities…………………………………………….…...… 80
Government (federal)…………………..………………....…70
Mechanical Engineering………….Utilities……………………………………………….…… 90
engineering/surveying………………………………….…. 64
*electrical/electronic machinery& equip. mfg……….…… 62
* Government (federal)……………………………….…… 62
Economic/Finance………………..Financial services……………………………….…….…… 75
Utilities…………………………………………….……..... 70
Merchandisers……………………………………………… .63
Who’s In Demand?
Associate Degree Candidates
Overall Projections:
27.8% of employers plan to hire associate degree candidates this year (down from 33.3% last year)
By Sector:
*Government/Nonprofit Employers: 40.7% plan to hire associate degree candidates
*Service employers: 27.6% plan to hire associate degree candidates
*Manufacturing Employers: 26.8% plan to hire associate degree candidates
Best Bets:
Insurance companies
Utilities companies
Electrical & Electronic Machinery Manufacturers
Salary Projections:
Engineering Technology(includes civil, computer, electrical, mechanical engineering technology)
Average salary expected: $39,417
% Increase over last year: 2.2%
Business (Includes accounting, general business, marketing , and telecommunications)
Average salary expected: $29,500
%increase over last year: 0.6%
Who’s In Demand?
International Students
Overall Projections:
23.7% of employers plan to hire international students for full-time permanent
positions in the U.S. this year (down from 34.1% last year)
By Sector:
*Government/Nonprofit Employers: 7.4% plan to hire international candidates
*Service employers: 28.9% plan to hire international candidates
*Manufacturing Employers: 19.8% plan to hire international candidates
Best Bets:
Engineering/Surveying Firms
Electrical & Electronic Machinery Manufacturers
Computer Software Development & Data Processing Services Firms
Who’s In Demand?
Employers rate the importance of candidate skills
Top Qualities &
Skills Employers
Look for in New
Graduates
Communication Skills………………………………… 4.7
Honesty/Integrity ……………………………………. 4.7
Teamwork skills ……………………………………… 4.6
Interpersonal skills …………………………………… 4.5
Motivation/Initiative …………………………………. 4.5
Strong Work ethic ……………………………………. 4.5
Analytical skills ……………………………………… 4.4
Flexibility/Adaptability ………………………………. 4.3
Computer skills ………………………………………. 4.1
Organizational skills …………………………………. 4.1
Detail oriented ……………………………………….. 4.0
Leadership skills ……………………………………… 4.0
Self-confidence ………………………………………. 4.0
Friendly/Outgoing …………………………………… 3.9
Tactfulness …………………………………………… 3.8
Well mannered/Polite ……………………………….. 3.8
GPA (3.0 or better) ………………………………….. 3.7
Creativity ……………………………………………... 3.6
Entrepreneurial/Risk taker …………………………. 3.3
Sense of humor ………………………………………. 3.3
Who’s In Demand?
Top Skills Lacking In New Graduates
•Communication Skills
•Maturity/business etiquette
•Work Ethic
Who’s In Demand?
Employers Give Advice to Students
•Research, research, research
•Be open-minded
•Gain relevant work experience
Preferred hiring methods
Employers: Most Effective
Recruiting Methods
•Organization’s internship program
•Organization’s co-op program
•On-campus recruiting
•Employee referrals
•Career/job fairs
Preferred hiring methods
Benefits of Experiential Education
Conversion Rates
Interns: 31.9%
Co-ops: 33.6%
Percent of Respondents With
Intern Programs: 79.8%
Co-op Programs: 39.6%
Percent of Hires With
Internship Experience: 54.2%
Co-op Experience: 25.2%
Maintaining a program
For Employers: Strategies for
gaining upper management
support for your program
•Outline past successes
•Offer hard data
•Outline the consequences of eliminating
your college program
•Focus on the future
Maintaining a program
Benefits
this as a benefit
Benefits of
Hiring New
Graduates
% of Respondents that
identified
Opportunity to mold future
leaders of the organization
88 %
New grads have cutting edge
skills
51.9%
Easier to identify a diverse
applicant pool
35.4%
Easier to fill positions because
students are centrally located
21.2%
New college grads will accept lower
salaries than experienced college grads
21.2%
Maintaining a program
Employers: Effectiveness of activities to maintain your image on
campus
Participate in campus career days/fairs, open houses, site tours …………………
Provide info about your organization through company web site………………...
Offer info sessions…………………………………………………………………
Visit with faculty for informal exchange of information………………………….
Participate in programs for student clubs, fraternities, sororities …………………
Offer experiential education programs……………………………………………
Participate in conferences for career services officers and faculty ……………….
Sponsor hospitality-oriented events for students, organizations,
faculty and career center staff……………………………………………………..
Offer a speakers’ bureau, lecture series, and/or seminars, to student
and/or faculty group……………………………………………………………….
Offer resume critiques……………………………………………………………..
Participate in mock interviews…………………………………………………….
Provide scholarships and/or grants………………………………………………..
3.9
3.9
3.6
3.4
3.4
3.3
3.2
3.2
3.2
3.0
3.0
3.0
Maintaining a program
How Career Services can help employers
•Ask what you can do to help
•Provide info about opportunities available through your
office as well as other campus departments and
organizations
•Help employers get out the message out to all campus
offices and students
•Let employers know where they will get the most
“bang for the buck” on your campus