Synthesis of nitrogen containing microporous carbon with a
Bạn đang xem bản rút gọn của tài liệu. Xem và tải ngay bản đầy đủ của tài liệu tại đây (188.33 KB, 7 trang )
Chem. Mater. 2005, 17, 5187-5193
5187
Synthesis of Nitrogen-Containing Microporous Carbon with a
Highly Ordered Structure and Effect of Nitrogen Doping on H2O
Adsorption
Peng-Xiang Hou,† Hironori Orikasa,† Toshiaki Yamazaki,† Koichi Matsuoka,†
Akira Tomita,† Norihiko Setoyama,‡ Yoshiaki Fukushima,‡ and Takashi Kyotani*,†
Institute of Multidisciplinary Research for AdVanced Materials, Tohoku UniVersity, 2-1-1 Katahira,
Aoba-Ku, Sendai 980-8577, Japan, and Toyota Central Research and DeVelopment Laboratory,
Incorporated, Nagakute, Aichi 480-1192, Japan
ReceiVed May 22, 2005. ReVised Manuscript ReceiVed August 1, 2005
A nitrogen-containing microporous carbon with a highly ordered structure was synthesized by using
zeolite Y as a template. The filling of carbon into zeolite channels was performed by the impregnation
of furfuryl alcohol and subsequent chemical vapor deposition (CVD) of acetonitrile. The template was
then removed by HF washing. The two-step carbon filling process (the impregnation and the CVD) was
found to be essential for obtaining both high microporosity and ordering. This carbon is characterized by
its very large surface area (3310 m2/g) and very narrow micropore size distribution (1.0-1.5 nm), and
it contains nitrogen of 6 wt %, most of which is quaternary nitrogen. The distribution of nitrogen atoms
in the carbon was examined by the detailed analysis of the carbon deposit at each carbon-filling step.
The effect of nitrogen doping on the affinity to H2O molecules was elucidated from the comparison of
the H2O adsorption behavior between this carbon and a nitrogen-free ordered porous carbon with a very
similar pore structure. It was found that the nitrogen-containing carbon has a higher affinity to H2O
molecules than the nitrogen-free carbon.
Introduction
Porous carbons have gathered more and more attention
because they hold great potential for applications in gas
storage,1 as the electrodes of electric double-layer capacitors,2
and for environmental technologies such as the removal of
pollutants.3,4 The investigation of nitrogen (N) present in
carbonaceous materials has been a subject of considerable
research efforts for the past two decades. This research was
performed partially for minimizing the negative impact on
the environment due to the formation and emission of nitrous
and nitric oxides during the combustion of coal. On the other
hand, some other researches have paid attention to Ncontaining porous carbons because the introduction of N
atoms endows the carbons with a polar nature. Their
physicochemical properties would thus be different from
those of N-free porous carbons and are more desirable for
the application to the electrodes of electric double-layer
capacitors.5,6
* Corresponding author. Phone: +81-22-217-5625. Fax: +81-22-217-5626.
E-mail:
† Tohoku University.
‡ Toyota Central Research and Development Laboratory, Incorporated.
(1) Norman, D. P.; David, F. Q. In Porosity in Carbons; Patrick, J. W.,
Ed.; John Wiley: New York, 1995; p 292.
(2) Frackowiak, E.; Beguin, F.Carbon 2001, 39, 937.
(3) Raymundo-Pinero, E.; Cazorla-Amoros, D.; Linares-Solano, A. Carbon
2003, 41, 1925.
(4) Mochida, I.; Kawano, S.; Shirahama, N.; Enjoji, T.; Moon, S. H.;
Sakanishi, K.; Korai, Y.; Yasutake, A.; Yoshikawa, M. Fuel 2001,
80, 2227.
(5) Kodama, M.; Yamashita, J.; Soneda, Y.; Hatori, H.; Nishimura, S.;
Kamegawa, K. Mater. Sci. Eng. B 2004, 108, 156.
Porous carbons containing N atoms can be obtained using
the following several methods: (1) reaction of porous
carbons with N-containing gases;7-9 (2) cocarbonization of
N-free and N-containing precursors;10-12 and (3) carbonization of raw material containing N atoms.13 However, due to
the complexity of the carbon pore structure, it is very difficult
to tailor their pore structure, especially their microporosity.
It is well-known that the degree of microporosity is an
essential factor affecting the performance of porous carbons
in many applications. The control of both micropore size
and micropore-wall chemistry is, therefore, indispensable
for further improvement of the performance, but such control
is a very difficult task.
The template method is a promising approach to control
the carbon pore structure.14 Using a variety of inorganic
porous templates, so far many researchers have prepared
novel porous carbons including N-containing mesoporous
carbons.15-22 We prepared a long-range ordered microporous
(6) Hulicova, D.; Yamashita, J.; Soneda, Y.; Hatori, H.; Kodama, M.
Chem. Mater. 2005, 17, 1241.
(7) Sto¨hr, B.; Boehm, H. P.; Schlo¨gl, R. Carbon 1991, 29, 707.
(8) Jansen, R. J. J.; van Bekkum, H. Carbon 1994, 32, 1507.
(9) Yang, C. M.; El-Merraoui, M.; Seki, H.; Kaneko, K. Langmuir 2001,
17, 675.
(10) Singoredjo, L.; Kapteijn, F.; Moulijn, J. A.; Martin-Martinez, J. M.;
Boehm, H. P. Carbon 1993, 31, 213.
(11) Raymundo-Pin˜ero, E.; Cazorla-Amoro´s, D.; Linares-Solano, A.; Find,
J.; Wild, U.; Schlo¨gl, R. Carbon 2002, 40, 597.
(12) Machnikowski, J.; Grzyb, B.; Weber, J. V.; Frackowiak, E.; Rouzaud,
J. N.; Be´guin, F. Electrochim. Acta 2004, 49, 423.
(13) Lahaye, J.; Nanse´, G.; Bagreev, A.; Strelko, V. Carbon 1999, 37, 585.
(14) Kyotani, T. Carbon 2000, 38, 269.
(15) Gilbert, M. T.; Knox, J. H.; Kaur, B. Chromatographia 1982, 16, 138.
(16) Pekala, R. W.; Hopper, R. W. J. Mater. Sci. 1987, 22, 1840.
10.1021/cm051094k CCC: $30.25 © 2005 American Chemical Society
Published on Web 09/02/2005
5188 Chem. Mater., Vol. 17, No. 20, 2005
carbon with a structural regularity of zeolite Y for the first
time.23-25 This porous carbon possesses a high BET specific
surface area more than 3000 m2/g and almost no mesoporosity. Furthermore, its pore size distribution is very narrow
in comparison with commercial high surface area carbons,
and most of the pore sizes are in the range of 1.0-1.5 nm.26
Very recently, Su and co-workers used NH4-form zeolite Y
as a template to prepare microporous carbons from poly(furfuryl alcohol) and found that the resulting carbons
contained N of 2-7 wt %.27 However, the regularity of
zeolite Y was not reflected in the carbon structure, and the
pore size distribution was somewhat broad as a result. The
presence of the regularity in the carbon structure is essential
for obtaining such narrow micropore size distribution as
observed in our previous study.26
In the present study, we try to synthesize N-containing
microporous carbons having both the regularity of zeolite Y
and monodispersed pore size distribution. Moreover, we
compare the adsorption behavior of H2O molecules on the
N-containing microporous carbons with that on the N-free
microporous carbon prepared previously and thereby elucidate the effect of N doping on the H2O adsorption.
Experimental Procedures
Synthesis. A two-step method was applied in the preparation of
N-containing microporous carbons. In the first step, the nanochannels of zeolite Y (Na-form, SiO2/Al2O3 ) 5.6, Tosoh Inc., HSZ320NAA) were filled with furfuryl alcohol by an impregnation
method, and then furfuryl alcohol was polymerized at 150 °C. The
resulting poly(furfuryl alcohol) (PFA)/zeolite composite was placed
in a vertical quartz reactor (20 mm i.d.) and heated to a
predetermined temperature (700, 800, or 900 °C) under N2 flow at
a heating rate of 5 °C/min to carbonize the PFA in the composite.
The second step was chemical vapor deposition (CVD) of acetonitrile over the zeolite composite. As soon as the reactor reached
one of the previous temperatures just after the first step, acetonitrile
vapor (4.2% in N2 of 150 cm3 (STP)/min) was introduced into the
reactor. The vapor was generated by bubbling N2 through acetonitrile liquid in a saturator at 0 °C. This acetonitrile CVD was
performed for a given time (1, 2, 3, or 4 h), and then the composite
was further heat-treated at 900 °C under N2 flow for 1 h. Finally,
the carbon part was liberated from the zeolite framework by HF
washing. The stability of the zeolite framework structure at 900
°C was confirmed by the XRD measurement of the carbon/zeolite
composites. In the present study, we mainly changed CVD
temperature and time and investigated the effect of these parameters
on the structure of the resulting porous carbons. For convenience,
(17) Kyotani, T.; Nagai, T.; Inoue, S.; Tomita, A. Chem. Mater. 1997, 2,
6609.
(18) Zakhidov, A. A.; Baughman, R. H.; Iqbal, Z.; Cui, C. X.; Khayrullin,
I.; Dantas, S. O.; Marti, J.; Ralchenko, V. G. Science 1998, 282, 897.
(19) Ryoo, R.; Joo, S. H.; Jun, S. J. Phys. Chem. B 1999, 103, 7743.
(20) Lee, J.; Yoon, S.; Hyeon, T.; Oh, S. M.; Kim, K. B. Chem. Commun.
1999, 21, 2177.
(21) Lu, A. H.; Kiefer, A.; Schmidt, W.; Schu¨th, F. Chem. Mater. 2004,
16, 100.
(22) Xia, Y.; Yang, Z.; Mokaya, R. J. Phys. Chem. B 2004, 108, 19293.
(23) Ma, Z. X.; Kyotani, T.; Tomita, A. Chem. Commun. 2000, 23, 2365.
(24) Ma, Z. X.; Kyotani, T.; Liu, Z.; Terasaki, O.; Tomita, A. Chem. Mater.
2001, 13, 4413.
(25) Ma, Z. X.; Kyotani, T.; Tomita, A. Carbon 2002, 40, 2367.
(26) Matsuoka, K.; Yamagishi, Y.; Yamazaki, T.; Setoyama, N.; Tomita,
A.; Kyotani, T. Carbon 2005, 43, 876.
(27) Su, F.; Zhao, X. S.; Lv, L.; Zhou, Z. Carbon 2004, 42, 2821
Hou et al.
the acetonitrile CVD conditions are indicated through this paper
as AX(Y), where the X following the A (meaning acetonitrile CVD)
denotes one hundredth of the CVD temperature (in °C) and the Y
in parentheses corresponds to the CVD time in hours. For example,
A8(2) means the acetonitrile CVD at 800 °C for 2 h.
To investigate the necessity for the first step, we intentionally
skipped the first step in some of the experimental runs. In other
words, we tried to prepare N-containing carbons only with the CVD
without the furfuryl alcohol impregnation. This method is identified
with an asterisk. For example, A8(2)* denotes acetonitrile CVD at
800 °C for 2 h but without furfuryl alcohol impregnation.
Furthermore, to examine the effect of N introduction, we prepared
an N-free carbon having a similar type of microporous structure
by the two-step method but using propylene as carbon source in
the CVD process (at 700 °C for 1 h). This process is referred to as
P7(1) hereafter. Some of the P7(1) composite powders were
subjected to further CVD using acetonitrile at 800 °C for 0.5 h.
This two-CVD process is referred to as P7(1)-A8(0.5). Finally,
the heat-treatment at 900 °C in N2 and the subsequent HF washing
were performed for all these carbon/zeolite composites.
Characterization. The structure of the resulting carbons was
examined using an X-ray diffractometer (XRD, Shimadzu, XDD1) with Cu KR radiation. The N-content and types of Nfunctionalities in the carbons were determined with elemental
analysis and X-ray photoelectron spectroscopy (XPS), respectively.
In the latter analysis, the powdered samples were placed on a
stainless steel sample holder with electroconductive carbon adhesive
tape. Nitrogen 1s (N1s) and C1s spectra were recorded using a PHI
5600 ESCA spectrometer with Mg KR radiation (8 kV, 30 mA)
under a pressure of less than 10-6 Pa at different photoelectron
takeoff angles (from 15 to 75°) relative to the top surface of the
sample holder. A binding energy correction was made to account
for sample charging based on a C1s peak at 284.6 eV. The
microscopic features of the carbons were observed with a scanning
electron microscope (SEM, JEOL SM71010) and a transmission
electron microscope (TEM, JEOL JEM-2010). The specific surface
area and pore structure of the samples were investigated with an
automatic volumetric sorption analyzer (Quantachrome, Autosorb1) using N2 as the adsorbate at -196 °C. The BET specific surface
areas of all the samples were determined using the data in the
relative pressure range of 0.01-0.05, as recommended by Kaneko
et al.28 for analyzing porous carbons with very high surface areas.
The micropore volume was calculated from the Dubinin-Radushkevich (DR) equation. The mesopore volume was determined by
subtracting the micropore volume from the volume of N2 adsorbed
at a relative pressure (P/P0) of 0.95. For some of the carbons, the
pore size distribution was estimated using the N2 adsorption
isotherm based on the density functional theory (DFT) method,
which is available in the Autosorb software (Quantachrome).
Sorption isotherms of H2O at 25 °C were obtained using a
volumetric water vapor adsorption apparatus (Belsorp-18; BEL
Japan). Prior to the H2O adsorption tests, the samples were
outgassed at 110 °C for 6 h under vacuum less than 1 Pa.
Results and Discussion
Optimum Condition for Synthesizing Ordered NContaining Porous Carbons. To investigate an optimum
synthesis condition to achieve both high regularity and
microporosity, we varied mainly the CVD conditions (temperature and period) and evaluated the resulting carbons from
the results of the XRD and N2-adsorption measurements. At
(28) Kaneko, K.; Ishii, C. Colloid Surf. 1992, 67, 203.
Synthesis of Nitrogen-Containing Microporous Carbon
Chem. Mater., Vol. 17, No. 20, 2005 5189
Table 1. Specific Surface Area and Pore Volumes of Carbons Prepared under Different CVD Conditions
CVD conditions
samples
A8(1)
A8(2)
A8(3)
A8(2)*f
A8(4)*f
P7(1)
P7(1)-A8(0.5)
gas
temp. (°C)
time (h)
SBETa (m2/g)
Vmicrob (cm3/g)
Vmesoc (cm3/ g)
VmicroH2Od (cm3/g)
acetonitrile
acetonitrile
acetonitrile
acetonitrile
acetonitrile
propylene
propylene,
acetonitrile
800
800
800
800
800
700
700
800
1
2
3
2
4
1
1
0.5
2880
3310
2260
1080
990
4070
1.06
1.26
0.91
0.42
0.38
1.78
0.50
0.33
0.49
0.33
0.40
0.23
n.d.e
1.23
n.d.
n.d.
n.d.
1.76
3410
1.35
0.11
1.33
a BET specific surface area determined using the data at P/P ) 0.01-0.05. b Micropore volume from DR eq. c By subtracting the micropore volume
0
from the volume of N2 adsorbed at P/P0 ) 0.95. d Micropore volume from H2O adsorption isotherm. e Not determined. f The asterisk means that the furfuryl
alcohol impregnation process was skipped and that only the CVD process was performed.
Figure 2. N2 adsorption-desorption isotherms of the carbons (-196 °C).
Table 2. Results of Elemental Analysis for Carbons
elemental analysis (wt %)
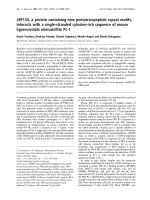
Figure 1. X-ray diffraction patterns of the carbons synthesized under the
acetonitrile CVD at 800 °C.
first, we focused on whether an XRD peak appeared around
6° or not. The peak originates from the ordering of {111}
planes of zeolite Y, and the presence of this peak can be
used as a measure of the regularity in the resulting carbon
structure. It was found that such an XRD peak was observed
for every carbon sample synthesized under the CVD at 800
°C (Figure 1), whereas for the samples under CVD at 700
and 900 °C, no peak or a very weak one was detected (not
shown here). Among A8 carbons, the CVD times for 2 and
3 h resulted in higher ordering than the shorter one (1 h),
based on the sharpness and intensity of their XRD peaks in
Figure 1. The A8(3) carbon, however, gives not only the
sharp XRD peak but also the broad peak in the range of
20-30°, which can be ascribed to the diffraction from carbon
layer stacking of the deposits on the external surface of
zeolite particles as suggested by Ma et al.25 The presence of
such broad diffraction therefore indicates that the carbon
deposition took place not only in the nanochannels of zeolite
particles but also on their external surface. The latter type
of deposition should be avoided as much as possible for
obtaining porous carbons with a highly ordered structure.
The previous results thus suggest that CVD should not be
performed for as long a period as 3 h.
The porosity of the synthesized carbons was analyzed by
N2 adsorption at -196 °C. The adsorption-desorption
isotherms of A8 carbons are plotted in Figure 2, and the
results of the specific surface areas and the pore volumes
samples
C
H
N
O (diff.)
A8(1)
A8(2)
A8(3)
A8(2)*
A8(4)*
P7(1)
P7(1)-A8(0.5)
86
88
89
83
87
90
91
3
2
1
3
2
2
2
4
6
7
5
7
0
2
7
4
3
9
4
8
5
are summarized in Table 1. Their N2 adsorption isotherms
are of Type I, suggesting the microporous nature of these
carbons. Among them, A8(2) carbon has the largest surface
area and micropore volume (3310 m2/g and 1.26 cm3/g) and
the smallest mesopore volume (0.33 cm3/g). The previous
results reveal that the acetonitrile-CVD condition (800 °C
and 2 h) is an optimum for synthesizing porous carbon
having a high specific surface area and high microporosity.
Interestingly, this optimum CVD condition is the same as
that for obtaining porous carbon with highly structural
regularity judging from the XRD results. A sharp peak
around 6° in an XRD pattern is therefore a simple criterion
for the synthesis of porous carbon with a large surface area
and high microporosity.
We can conclude that there is an optimum CVD condition
for synthesizing a highly ordered microporous carbon. In the
present work, the CVD for 2 h at 800 °C (A8(2)) is the best
one. The elemental analysis results (Table 2) of this carbon
confirm the presence of N, and its ash content (nearly zero)
indicates complete removal of the zeolite template. In the
two-step method, the furfuryl alcohol impregnation was
always performed before the CVD process. Since PFA does
not contain any nitrogen, it would be better to avoid this
impregnation process, if possible, for obtaining a porous
5190 Chem. Mater., Vol. 17, No. 20, 2005
Figure 3. SEM images of zeolite Y (a) and A8(2) carbon (b).
carbon with a large content of N. To check the effect of
PFA, we prepared two types of porous carbons without this
impregnation process but only with the CVD at 800 °C for
2 and 4 h (A8(2)* and A8(4)*). It was found that both
carbons had no XRD peak around 6° (Figure 1) and
possessed much less specific surface area and micropore
volume than the carbon prepared with the two-step method
(Table 1), indicating that the presence of PFA before the
acetonitrile CVD is indispensable to develop both regularity
and microporosity. Surprisingly, the N content for these two
carbons is not as large as expected, but it is comparable to
that for the other carbons synthesized with the two-step
method (Table 2). We have no clear explanation for this
phenomenon, but the already-existing PFA-derived substance
might influence the subsequent acetonitrile CVD behavior.
Analysis of the Ordered N-Containing Porous Carbon.
As described previously, A8(2) carbon possesses the most
ordered and microporous structure so that more detailed
analyses were carried out for this carbon. Figure 3 shows
SEM images of A8(2) carbon and the parent zeolite. The
SEM image of zeolite Y (Figure 3a) exhibits crystal habits
in each particle with a size of about 500 nm, indicating that
each one almost corresponds to a single crystal and/or
consists of a few single crystals. The crystal face of the
original zeolite particles is clearly reflected in the smooth
surface of the carbon particles (Figure 3b). As already
reported in the previous paper,25 when serious carbon
deposition on the external surface of zeolite particles took
place, the surface of the carbon particles liberated from such
composites looked rough in comparison with the smooth
surface of zeolite particles. The presence of such a smooth
surface on the A8(2) carbon particles suggests that the
acetonitrile CVD process (A8(2)) deposited carbon mostly
inside the zeolite channels and that the deposition on the
external surface was not remarkable. The presence of carbon
inside the particles was confirmed by a low-magnification
TEM image of this sample (Figure 4a), where several carbon
particles with a size of about 500 nm are observed. Figure
4b shows a high-magnification TEM image of a part of one
Hou et al.
Figure 4. TEM images of A8(2) carbon: (a) a low-magnification image
of carbon particles and (b) a high-resolution image of a part of one carbon
particle.
Figure 5. X-ray photoelectron N1s and C1s spectra of A8(2) carbon.
carbon particle. From the image, straight lattice fringes can
readily be seen, and the regular spacing of the observed
lattice planes is about 1.3 nm, which is in good agreement
with the ordering (about 1.39 nm) determined from the XRD
measurement. The observation of such ordering is other solid
evidence for the presence of the regularity in A8(2) carbon.
As revealed by the elemental analysis, N atoms have been
introduced into this porous carbon (Table 2). To clarify the
chemical circumstance of N in A8(2) carbon, its surface was
investigated with XPS at a takeoff angle of 45°. The resulting
N1s spectrum is plotted in Figure 5a, where one distinct peak
is observed at 401.2 eV with a shoulder around 398 eV.
These can be attributed to quaternary and pyridinic N,
respectively, and the former one is the main N-functionality
in the present carbon. Pels29 suggested that quaternary N may
(29) Pels, J. R.; Kapteijin, F.; Moulijn, J. A.; Zhu, Q.; Thomas, K. M.
Carbon 1995, 33, 1641.
Synthesis of Nitrogen-Containing Microporous Carbon
Chem. Mater., Vol. 17, No. 20, 2005 5191
Table 3. Carbon Fraction, Surface Area, and Pore Volume for Zeolite and Carbon/Zeolite Compositesa
samples
carbon fractionb (g/g of zeolite)
BET specific surface areac (m2/g)
pore volumed (cm3/g)
zeolite Y
zeolite Y + PFA carbon (before A8(2) CVD)
A8(2) composite (after A8(2) CVD)
P7(1) composite (after P7(1) CVD)
0
0.14
0.25
0.25
870
560
11
15
0.37
0.24
0.03
0.04
a All data were expressed per 1 g of zeolite. b Carbon fraction in each composite was calculated from the data of its elemental analysis using the carbonto-ash ratio where ash was regarded as the zeolite equivalent. c Determined using the data at P/P0 ) 0.01-0.05. d Determined from the volume of N2
adsorbed at P/P0 ) 0.95.
represent various forms, defined as more positively charged
N, as compared to pyridinic-N, being part of a larger aromatic
structure. This includes protonated pyridinic-N ammonium
ions and N atoms replacing carbon atoms in graphene
structures. The latter one is a more probable form for
quaternary N in the present carbon.
In addition to the N1s spectrum, the XPS measurement for
C1s was performed at the same angle as in the N1s measurement. The C1s spectrum is shown in Figure 5b, where a large
peak is observed around 285 eV, which is attributed to the
sp2 carbon atoms of the carbon skeleton. This peak is broad
on its high energy side (286-288 eV), and this shoulder
indicates the presence of carbon atoms singly or doubly
coordinated to an oxygen or nitrogen atom (C-O, CdO,
C-N), but there is almost no carboxyl group because there
is no clear XPS peak around 289 eV where the carboxyl
group usually gives a peak. The area ratio of N1s to C1s
signals corrected with standard XPS sensitivity factors can
approximately be regarded as a surface atomic ratio of N to
C for A8(2) carbon. In this study, this ratio was examined
at different takeoff angles. It is well-known that the analysis
depth of XPS is dependent on the takeoff angle and thus a
study of takeoff angle dependence provides information about
the surface depth profile. The N/C ratios determined at an
angle of 15, 30, 45, 60, and 75° were found to be 0.061,
0.067, 0.065, 0.065, and 0.063, respectively. There is almost
no change in the ratio with an increase in the angle,
suggesting a uniform N depth profile at least in the surface
layer that the present angle resolved XPS can detect.
Furthermore, these values do not significantly differ from
the bulk N/C ratio (0.058) determined from the elemental
analysis. Considering that the present synthesis procedure
consists of the two steps (the first impregnation of furfuryl
alcohol into the zeolite channels and the subsequent CVD
process using acetonitrile as N source), we could presume
preferential N deposition on the outer surface of the carbon
particles (Figure 3b) and hence could have obtained a much
larger surface N/C ratio.
For further understanding of the N distribution in the
carbon structure, we examined the porous nature of the
carbon/zeolite composites before and after the acetonitrile
CVD (A8(2)) by N2 adsorption at -196 °C. The composite
before CVD was prepared as follows: the PFA/zeolite
composite was heat-treated up to 800 °C under exactly the
same conditions as in the Experimental Procedures, and then
the temperature was lowered as soon as it reached 800 °C.
The composite after the CVD is just the A8(2) composite.
From the resulting isotherms of these two composites, their
BET specific surface area and pore volumes were determined, and they are summarized in Table 3 together with
the data of the parent zeolite. In addition, carbon fraction in
each composite is indicated in the second column of the table.
Although the zeolite channels were filled with furfuryl
alcohol by the impregnation process, only a small amount
of carbon (0.14 g/g of zeolite) remained due to the heattreatment up to 800 °C. With each carbon-loading step (the
PFA carbonization and then the acetonitrile CVD), the carbon
fraction increases and the porosity decreases, as a matter of
course. It should be noted that the composite before CVD
still kept a relatively large porosity, but it was drastically
reduced by the subsequent CVD. This finding suggests that
many of the channels in the zeolite still remained open and
unoccupied even after PFA carbonization, but such open and
unoccupied channels were apparently occupied by Ncontaining carbon upon the next carbon-loading process (the
acetonitrile CVD), as presumed from TEM images (Figure
4). In other words, N atoms were introduced to not only the
outer surface of the particles but also their inside. This can
explain why the difference in the N/C ratio between the
surface and the bulk of A8(2) carbon was not large. However,
considering the pore volume of the parent zeolite, we have
to judge that the amount of carbon fraction (0.25 g/g of
zeolite) is not enough for complete filling. It means that the
composite still retains some open space, which N2 molecules
cannot access at as low a temperature as -196 °C.
Furthermore, the small difference in the N/C ratio between
the XPS measurements and the elemental analysis suggests
that there is a slight heterogeneity in N distribution of the
carbon substrate inside the zeolite.
Two Reference Carbons for Comparison. To investigate
the effect of N doping, we compare A8(2) carbon with the
N-free (P7(1)) carbon having a similar type of microporous
structure. The details of P7(1) carbon were already reported
elsewhere.26 Briefly, the carbon fraction (0.25 g/g of zeolite)
of the P7(1) composite is the same as that of the A8(2) one,
and the P7(1) carbon does not contain any N, but its O
content is twice as large as that of A8(2) (Table 2). XRD
analysis revealed that P7(1) carbon showed a sharp peak
around 6°, and its intensity and sharpness were almost the
same as those of A8(2) carbon. We can thus presume that
P7(1) carbon has an ordered structure similar to that of A8(2) carbon. The specific surface area and micropore and
mesopore volumes of P7(1) carbon were determined in the
same manner, and they are summarized in Table 1. The
specific surface area of P7(1) reaches more than 4000 m2/g,
and its micropore volume is as large as 1.8 cm3/g, each of
which is larger than that of A8(2) carbon (i.e., P7(1) carbon
is more microporous than A8(2)). In addition to P7(1) carbon,
P7(1)-A8(0.5) carbon was also prepared for comparison.
This carbon contains N of 2 wt % (Table 2) because the
acetonitrile CVD (at 800 °C for 0.5 h, A8(0.5)) was
performed after the propylene CVD (at 700 °C for 1 h, P7-
5192 Chem. Mater., Vol. 17, No. 20, 2005
Figure 6. Pore size distribution curves determined by applying the DFT
method to the N2 adsorption isotherms of the three carbons.
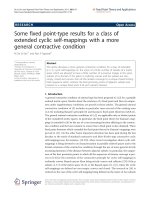
Figure 7. H2O adsorption-desorption isotherms at 25 °C for the three
types of carbons.
(1)). Its bulk N/C atomic ratio (0.019) is much smaller than
the surface N/C ratio (0.040) determined from the XPS
measurement. The carbon/zeolite composite before the
acetonitrile CVD (i.e., P7(1) composite) has a very small
surface area and pore volume (Table 3), indicating that most
of the open channels were filled and/or plugged with N-free
carbon. Nitrogen atoms introduced by the subsequent acetonitrile CVD (A8(0.5)) are distributed preferentially on the
outer surface of the P7(1)-A8(0.5) carbon particles, as a
result. The surface area and micropore volume of this carbon
are smaller than those of P7(1) carbon but a little larger than
those of A8(2) carbon (Table 1).
Despite the difference in microporosity among the three
carbons, their pore size distribution (PSD) curves are similar,
as demonstrated in Figure 6, where the three curves
determined by the DFT method are illustrated. All of the
carbons have a surprisingly sharp PSD curve, and most of
the pore sizes fall within the range of 1.0-1.5 nm, which is
comparable to a periodicity (1.4 nm) of the regularity in the
three carbons. Such narrow PSD may be ascribed to the
periodically ordered array structure of these carbons. The
formation mechanism of the uniform micropores was described elsewhere.30 All of these data here suggest that these
carbons possess a very similar ordered microporous structure
with a very narrow PSD.
Role of N in H2O Adsorption on Ordered Microporous
Carbons. The H2O adsorption-desorption isotherms of the
previous three carbons are plotted in Figure 7. Their
(30) Hou P.-X.; Yamazaki, T.; Orikasa, H.; Kyotani, T. Carbon 2005, 43,
2624.
Hou et al.
isotherms are of Type V, and the shape is characterized by
a sharp adsorption uptake accompanied by a clear adsorption
hysteresis occurring over a medium relative pressure (P/P0)
range. Such characteristics have often been observed in H2O
isotherms of microporous carbons such as activated carbon
fibers (ACF).31,32 Mowla et al. found that the width of the
hysteresis loop in H2O isotherms for microporous carbons
depends on their pore size; no hysteresis is observed for
carbons with a pore size of less than 0.8 nm, but a wide
loop exists for carbons having a larger pore size.33 The latter
is indeed the case for the present three carbon samples.
Because of the large micropore volumes of these carbons,
the amounts of H2O adsorbed are very large. For instance,
the saturated amounts, determined by the extrapolation of
each adsorption isotherm to P/P0 ) 1, are as large as 1.6,
1.2, and 1.1 g/g for P7(1), P7(1)-A8(0.5), and A8(2)
carbons, respectively. From these values, the pore volumes
were calculated with assuming a density of adsorbed H2O
to be 0.92 g/cm3, as suggested by Alcaniz-Monge et al.32
The last column of Table 1 lists the pore volumes thus
calculated from the H2O adsorption isotherms. For all cases,
each pore volume from the H2O isotherm is very close to
that from the DR plot of the N2 isotherm. This finding
supports the idea that H2O molecules are adsorbed preferentially in micropores.34 Furthermore, this result indicates
that the N doping does not have any significant influence
on the saturated amount of H2O, but it is controlled only by
each micropore volume.
It is noteworthy that the pressure where the rapid H2O
adsorption took place on A8(2) carbon is lower than that of
P7(1) one. In other words, the N-containing porous carbon
has stronger affinity to H2O than the N-free carbon. Such
lower shift of the uptake pressure due to N doping was
already reported for ACF and activated carbon.31,35 It is wellknown that the uptake pressure and shape of the H2O
isotherm are functions of both micropore size and surface
chemical properties. However, in our case, we can almost
exclude the influence of micropore size and attribute the
observed difference in the uptake pressure solely to carbon
surface chemistry. It is therefore reasonable to conclude that
the inner pore surface of A8(2) carbon is more hydrophilic
than that of P7(1) one. Since the O content of the former
carbon is lower than that of the latter, the previous results
indicate that in our case, the presence of N groups is more
effective for H2O adsorption. This is partially because the
O-functionality in P7(1) carbon is dominated by ether and
the amount of more hydrophilic O groups such as carboxyl
group is small,36 as well as the case of A8(2) carbon (Figure
5b). Matsuoka et al. have reported the effectiveness of
(31) Yang, C.-M.; Kaneko, K. Carbon 2001, 39, 1075.
(32) Alcan˜iz-Monge, J.; Linares-Solano, A.; Rand, B. J. Phys. Chem. B
2002, 106, 3209.
(33) Mowla, D.; Do, D. D.; Kaneko, K. In Chemistry and Physics of
Carbon, Vol. 28; Radovic, L. R., Ed.; Marcel Dekker: New York,
2003; p 229.
(34) Kaneko, K.; Hanzawa, Y.; Iiyama, T.; Kanda, T.; Suzuki, T. Adsorption
1999, 5, 7.
(35) Cossarutto, L.; Zimny, T.; Kaczmarczyk, J.; Siemieniewska, T.; Bimer,
J.; Weber, J. V. Carbon 2001, 39, 2339.
(36) The O-containing functional groups in P7(1) carbon were analyzed
by Fourier transform infrared spectroscopy and a temperatureprogrammed desorption technique.
Synthesis of Nitrogen-Containing Microporous Carbon
quaternary N in improving water wettability and the promotion of capillary condensation in carbon mesopores as a
result.37 Such function of quaternary N may induce the
micropore filling of water molecules at the lower relative
pressure into the large micropores of the present carbon. As
we described before, there is a slight heterogeneity in N
distribution in A8(2) carbon. This may explain why the slope
of the adsorption branch in A8(2) carbon is not as sharp as
that in P7(1) one. The small but explicit difference in the
uptake pressure between the two carbons (P7(1) and P7(1)-A8(0.5)) implies that the N doping has still some effect
on the increase in hydrophilicity even though N atoms are
present mainly on the carbon outer surface, but the difference
between A8(2) and P7(1)-A8(0.5) carbons indicates that the
N-doping inside the carbon pore structure is more effective
to lower the uptake pressure.
Conclusions
Nitrogen-containing microporous carbons with ordered
periodic structure of zeolite Y were successfully prepared
by using zeolite Y as a template. The process of furfuryl
alcohol impregnation into zeolite channels followed by
acetonitrile CVD was proved to be necessary for preparing
(37) Matsuoka, T.; Hatori, H.; Kodama, M.; Yamashita, J.; Miyajima, N.
Carbon 2004, 42, 2346.
Chem. Mater., Vol. 17, No. 20, 2005 5193
such porous carbons. The optimum CVD (800 °C and 2 h)
condition to obtain high structural regularity is the same as
that for the development of high microporosity in the carbon
structure. The carbon prepared under this condition contains
nitrogen of 6 wt %, which is distributed not only on the outer
surface of the carbon particles but also in their inside. The
BET specific surface area and micropore volume of this
carbon reach 3310 m2/g and 1.26 cm3/g, respectively, but
its mesoporosity is low. This carbon is characterized by its
very narrow pore size distribution; most of the pore sizes
fall within the range of 1.0-1.5 nm. This is the first example
for a nitrogen-containing super-high surface area carbon with
a narrow micropore size distribution and a highly ordered
structure. The H2O adsorption-desorption isotherm of this
carbon is of Type V, having a steep uptake around P/P0 )
0.5 and a remarkable hysteresis. Because of the presence of
nitrogen atoms, the carbon has a higher affinity to H2O
molecules than a nitrogen-free porous carbon with a similar
microporous and ordered structure.
Acknowledgment. This work was partly supported by the
Japan Society of Promotion of Science (JSPS) postdoctoral
fellowship (P03075) for foreign researchers.
CM051094K