Magnetic, electronic, and structural characterization of
Bạn đang xem bản rút gọn của tài liệu. Xem và tải ngay bản đầy đủ của tài liệu tại đây (1.2 MB, 17 trang )
Published on Web 10/16/2004
Magnetic, Electronic, and Structural Characterization of
Nonstoichiometric Iron Oxides at the Nanoscale
Franz X. Redl,†,‡ Charles T. Black,† Georgia C. Papaefthymiou,§
Robert L. Sandstrom,† Ming Yin,‡ Hao Zeng,† Christopher B. Murray,*,† and
Stephen P. O’Brien*,‡
Contribution from the T. J. Watson Research Center, Nanoscale Materials and DeVices, IBM,
1101 Kitchawan Road, Route 134, P.O. Box 218, Yorktown Heights, New York 10598, VillanoVa
UniVersity, 800 Lancaster AVenue, VillanoVa, PennsylVania 19085, and Department of Applied
Physics & Applied Mathematics, Columbia UniVersity, 200 SW Mudd Building,
500 West 120th Street, New York, New York 10027
Received May 29, 2004; E-mail: ;
Abstract: We have investigated the structural, magnetic, and electronic properties of nonstoichiometric
iron oxide nanocrystals prepared by decomposition of iron(II) and iron(0) precursors in the presence of
organic solvents and capping groups. The highly uniform, crystalline, and monodisperse nanocrystals that
were produced enabled a full structural and compositional survey by electron microscopy and X-ray
diffraction. The complex and metastable behavior of nonstoichiometric iron oxide (wu¨stite) at the nanoscale
was studied by a combination of Mo¨ssbauer spectroscopy and magnetic characterization. Deposition from
hydrocarbon solvents with subsequent self-assembly of iron oxide nanocrystals into superlattices allowed
the preparation of continuous thin films suitable for electronic transport measurements.
Introduction
The large contribution of surface energy in nanoscale materials can stabilize and favor the origin of phases which are not
known or thermodynamically unstable in the bulk.1-5 Synthetic
control over the nanocrystal phase is therefore an additional
degree of freedom in the search for new nanoscale materials
properties. Furthermore, it allows to some extent the alteration
of crystal shape6,7 evolving in the growth period due to the
surface-differentiating influence of capping groups. This can
be exploited to obtain ellipsoids, sticks, rods,8,9 or branched
structures10 of materials with internal hexagonal structure.
Controlled growth of spherical particles with internal cubic
symmetry can lead to truncated cubes, cubes, or star-shaped
* Correspondence and requests for materials should be addressed to
Stephen O’Brien (synthesis and structural characterization) and/or Christopher B. Murray (magnetic and electronic characterization).
† IBM.
§ Villanova University.
‡ Columbia University.
(1) Ayyub, P.; Palkar, V. R.; Chattopadhyay, S.; Multani, M. Phys. ReV. B
1995, 51, 6135-6138.
(2) Herhold, A. B.; Chen, C.-C.; Johnson, C. S.; Tolbert, S. H.; Alivisatos, A.
P. Phase Transitions 1999, 68, 1-25.
(3) Qadri, S. B.; Skelton, E. F.; Hsu, D.; Dinsmore, A. D.; Yang, J.; Gray, H.
F.; Ratna, B. R. Phys. ReV. B 1999, 60, 9191-9193.
(4) Diehl, M. R.; Yu, J.-Y.; Heath, J. R.; Held, G. A.; Doyle, H.; Sun, S.;
Murray, C. B. J. Phys. Chem. B 2001, 105, 7913-7919.
(5) Sun, S.; Murray, C. B. J. Appl. Phys. 1999, 85, 4325-4330.
(6) Jun, Y.-W.; Lee, S.-M.; Kang, N.-J.; Cheon, J. J. Am. Chem. Soc. 2001,
123, 5150-5151.
(7) Jun, Y.-w.; Jung, Y.-y.; Cheon, J. J. Am. Chem. Soc. 2002, 124, 615-619.
(8) Puntes, V. F.; Krishnan, K.; Alivisatos, A. P. Top. Catal. 2002, 19, 145148.
(9) Puntes, V. F.; Krishnan, K. M.; Alivisatos, A. P. Science (Washington,
DC) 2001, 291, 2115-2117.
(10) Manna, L.; Scher, E. C.; Alivisatos, A. P. J. Am. Chem. Soc. 2000, 122,
12700-12706.
10.1021/ja046808r CCC: $27.50 © 2004 American Chemical Society
particles.11 The target of our investigation was the synthesis and
characterization of wu¨stite nanocrystals.12,13
We have investigated the structural, magnetic, and electronic
properties of nonstoichiometric iron oxide nanocrystals prepared
by decomposition of iron(II) and iron(0) precursors in the
presence of organic solvents and capping groups. The highly
uniform, crystalline, and monodisperse nanocrystals that were
produced enabled a full structural and compositional survey by
electron microscopy and X-ray diffraction. Different precursors
and a selective oxidation method were explored for the synthesis
of nanocrystalline wu¨stite (FexO for 0.84 < x < 0.95). Iron
acetylacetonate, iron acetate, and iron pentacarbonyl were
decomposed in organic solvents with high boiling temperatures.
The size and shape of the reaction product are correlated to the
metastability of wu¨stite. Tight control over temperature allows
the syntheses of cubic or faceted FexO nanocrystals with narrow
size distributions by thermolysis of iron(II) acetate or a selective
oxidation route of iron pentacarbonyl with pyridine N-oxide.
Random aggregation of particles is initiated at higher reaction
temperatures due to the disproportionation of the FexO particles
into magnetite and R-Fe. Structural characterization of the
Wu¨stite nanocrystals prepared by these methods reveals incorporated small seeds of magnetite. Self-assembly of spherical
FexO nanocrystals yields well-known densely packed hexagonal
or cubic superlattices, whereas the cubic nanocrystals assemble
readily into simple cubic superlattices. The assembly process
(11) Lee, S.-M.; Jun, Y.-w.; Cho, S.-N.; Cheon, J. J. Am. Chem. Soc. 2002,
124, 11244-11245.
(12) Cornell, R. M.; Schwertmann, U. The Iron Oxides; John Wiley & Sons:
New York, 1997.
(13) Yin, M.; O’Brien, S. J. Am. Chem. Soc. 2003, 125, 10180-10181.
J. AM. CHEM. SOC. 2004, 126, 14583-14599
9
14583
Redl et al.
ARTICLES
can be directed by an external magnetic field, yielding needlelike structures or pillars. By annealing in inert or oxidizing
atmospheres, the wu¨stite nanocrystals are transformed into highquality magnetite or maghemite nanocrystals (observed by X-ray
diffraction, SAED, and SQUID measurements). Intermediate
transition states display interesting magnetic properties minted
by exchange coupling between anti-ferromagnetic wu¨stite and
ferrimagnetic magnetite. Magnetite/Fe particles obtained by the
disproportionation of FexO nanocrystals show magnetoresistance
(MR) from 8% at 70 K to about 3% at room temperature.
Wu¨stite, FexO (also spelled “wuestite” and sometimes “wustite”), is a nonstoichiometric phase with a known stability range
from x ) 0.83 to 0.96 above 560 °C. The phase is also know
as Fe1-yO (here, x ) 1 - y). Prior to structural investigations
of iron oxides at the nanoscale, wu¨stite was typically prepared
by heating iron and magnetite in sealed vessels, and was known
to be stable only above 560-570 °C. Below this temperature it
decomposes via a two-step mechanism into R-Fe and magnetite,
Fe3O4.12,14-16 FexO has a defect rock salt structure with an
ordered distribution of iron vacancies.17-19 FexO can be oxidized
to magnetite and finally to maghemite, γ-Fe2O3. All three
compounds are based on an approximately face-centered cubic
structure of oxygen. One can readily visualize a fcc close-packed
array of O2- ions and the successive filling of the octahedral
and tetrahedral sites that result. The transformation between the
three different phases is thought to be determined by the
diffusion of Fe2+ and Fe3+ ions within the oxygen sublattice
and electron transfer between iron ions of different valence. The
wealth of the system is enriched by the occurrence of nonstoichiometry in all three phases. It is also interesting to note
that magnetite is the only thermodynamically stable phase in
the bulk.20
The three iron oxides are marked by different properties. FexO
is paramagnetic at room temperature and antiferromagnetic or
weakly ferrimagnetic21,22 below the Ne´el temperature TN of
about 183 K23 or 198 K,24 due to a transition from the cubic to
a rhombohedral25 or a monoclinic structure.14,15 The transition
is strongly related to the defect structure of wu¨stite. Magnetite
and maghemite are ferrimagnetic. Magnetite is half metallic and
shows comparable high conductivity, which is based on electron
exchange between Fe2+ and Fe3+. The conductivity is thermally
activated and undergoes a first-order transition at the Verwey26
temperature at 120 K. The conductivity changes by orders of
magnitude at this temperature. The appearance of this transition
(14) Fjellvag, H.; Hauback, B. C.; Vogt, T.; Stolen, S. Am. Mineral. 2002, 87,
347-349.
(15) Fjellvag, H.; Gronvold, F.; Stolen, S.; Hauback, B. J. Solid State Chem.
1996, 124, 52-57.
(16) Stolen, S.; Gloeckner, R.; Gronvold, F. Thermochim. Acta 1995, 256, 91106.
(17) Nagakura, S.; Ishiguro, T.; Nakamura, Y. Structure of wuestite observed
by UHV-HR-1 MV electron microscope. Dept. Metall., Tokyo Institute
of Technology, Tokyo, Japan, 1983.
(18) Radler, M. J. Thesis, Northwestern University, Evanston, IL, 1990; p 407.
(19) Gavarri, J. R.; Carel, C.; Weigel, D. C. R. Acad. Sci., Ser. 2 1988, 307,
705-710.
(20) Hyeon, T.; Lee, S. S.; Park, J.; Chung, Y.; Na, H. B. J. Am. Chem. Soc.
2001, 123, 12798-12801.
(21) Shull, C. G.; Strausser, W. A.; Wollan, E. O. Phys. ReV. 1951, 83, 333345.
(22) Bizette, H.; Tzai, B. Acad. Sci. Paris 1943, 217, 390.
(23) Millar, R. W. J. Am. Chem. Soc. 1929, 51, 215.
(24) Schiber, M. M., Ed. Experimental Magnetochemistry; John Wiley &
Sons: New York, 1967.
(25) Toombs, N. C.; Rooksby, H. P. Nature (London) 1950, 165, 442.
(26) Verwey, E. J. W. Nature (London) 1939, 144, 327.
14584 J. AM. CHEM. SOC.
9
VOL. 126, NO. 44, 2004
and the Verwey temperature are strongly correlated to the
perfection of the magnetite crystal under investigation.
The aim of this study was to explore the ability of chemical
methods to control size, morphology, and ultimately properties
of the cubic iron oxides over a compositional range between
FexO and Fe2O3 with a focus on FexO nanoparticles as the initial
precursor nanocrystal to oxides of higher oxidation states.27-29
Our interest in this material was triggered by the metastability
of FexO and the possibility of generating mixed phases between
magnetite, iron, and wu¨stite. Our approach of breaking the
synthesis down into a series of kinetically stable steps has
yielded insight into the mechanism of formation of iron oxide
nanocrystals, from precursor decomposition through nucleation
and morpholigcal evolution. The metastability has been exploited to adjust the composition of the particles on a nanoscale
size regime. This allows changing properties in a systematic
and controlled way based on the relative amount of FexO to
Fe3O4/R-Fe and based on the influence of interfaces. Such
systems are expected to show magnetic exchange coupling
caused by interfaces between antiferromagnetic FexO and the
ferrimagnetic Fe3O4 leading to a shift in hystereses and increased
coercivity.30-32 Further, the conductivity of those mixed-phase
nanoparticles assemblies might be spin dependent because of
the interface between superparamagnetic nanocrystals and halfmetallic properties of magnetite.33-35 Finally, FexO can be used
as a nonmagnetic precursor, transferable into magnetite or
maghemite. This is especially interesting because of the current
restriction to mainly water-based syntheses that often yield
materials with structural imperfections.20,36,37
In the following sections, the synthesis is outlined starting
with the most effective reaction concerning the control over
phase, phase purity, size, and shape. Those conditions were
found in an evolutionary process of searching for the right
precursors and reaction conditions. Results of earlier investigated
reactions will also be presented in the main text (controlled
oxidation with PyO) or in the Supporting Information (decomposition of FeIIacac or FeIIIacac). We will also show that the
quality of the obtained FexO nanocrystals is related to the
decomposition temperature of the precursor, reaction time, and
to some extent the choice of surfactant and solvent.
Experimental Section
Chemicals. Iron(II) acetylacetonate (Fe(acac)2), iron(III) acac (Fe(acac)3), iron(II) acetate (FexOAc2), iron pentacarbonyl, trioctylamine
(TOA), dioctyl ether (DOE), diphenyl ether (DPE), oleic acid (OA),
lauric acid (LA), trioctylphosphine, tributylphosphine, trioctylphosphine
oxide, hexane, acetone, and ethanol were purchased in high grade from
(27) Ding, J.; Miao, W. F.; Pirault, E.; Street, R.; McCormick, P. G. J. Magn.
Magn. Mater. 1998, 177-181, 933-934.
(28) Ding, J.; Miao, W. F.; Street, R.; McCormick, P. G. Scr. Mater. 1996, 35,
1307-1310.
(29) Gotor, F. J.; Macias, M.; Ortega, A.; Criado, J. M. Phys. Chem. Miner.
2000, 27, 495-503.
(30) Nogue´s, J.; Schuller, I. K. J. Magn. Magn. Mater. 1999, 192, 203-232.
(31) Lin, X.; Murthy, A. S.; Hadjipanayis, G. C.; Swann, C.; Shah, S. I. J. Appl.
Phys. 1994, 76, 6543-6545.
(32) Gangopadhyay, S.; Hadjipanayis, G. G.; Shah, S. I.; Sorensen, C. M.;
Klabundea, K. J. J. Appl. Phys. 1991, 70, 5888-5890.
(33) Poddar, P.; Fried, T.; Markovich, G. Phys. ReV. B: Condens. Matter 2002,
65, 172405.
(34) Black, C. T.; Murray, C. B.; Sandstrom, R. L.; Sun, S. Mater. Res. Soc.
Symp. Proc. 2001, 636, D10.17/11-D10.17/15.
(35) Black, C. T.; Murray, C. B.; Sandstrom, R. L.; Sun, S. Science (Washington,
DC) 2000, 290, 1131-1134.
(36) Rockenberger, J.; Scher, E. C.; Alivisatos, A. P. J. Am. Chem. Soc. 1999,
121, 11595-11596.
(37) Sun, S.; Zeng, H. J. Am. Chem. Soc. 2002, 124, 8204-8205.
Characterization of Nonstoichiometric Iron Oxides
ARTICLES
Scheme 1 . Different Reactions under Investigation for the Synthesis of Wu¨stite Nanocrystals
Aldrich. Pyridine N-oxide (PyO) and trimethyl N-oxide hydrate were
purchased from Aldrich and dehydrated utilizing a Dean-Stark trap
and toluene. After crystallization from hot toluene solution and isolation,
the N-oxides were dried under vacuum and stored in a glovebox. The
phosphines and phosphine oxide were also stored in the glovebox. An
N2 atmosphere was used for all reactions. Solvent and surfactant
mixtures were generally preheated to 250 °C under a rapid N2 flow
over solvent for 20 min. As a byproduct, a black oily substance
(amorphous polymeric material) is observed occasionally in small
yields, removed by repeated careful precipitations of diluted hexane
solutions with an equal volume of acetone.
Decomposition of Iron Pentacarbonyl in the Presence of Pyridine
N-Oxide. In a typical reaction, 7.6 mmol of PyO and 3.02 mmol of
iron pentacarbonyl are added subsequently to a solution of 9.12 mmol
of LA in 14 mL of DOE at 100 °C. The clear solution is heated to 120
°C for 2 h. The light yellow solution color changes to dark red. After
heating to reflux, in order to observe the evolution of size and shape,
aliquots/fractions of the solution are extracted with a syringe at specified
time intervals. Usually particles can be isolated after an induction period
of about 30 min, whereupon the formation of product can be observed
as a slight increase in brightness and turbidity of the solution. After
cooling to room temperature, the black solution is precipitated with
acetone. The precipitate is redispersed in hexane, and a surplus of 2
mL of OA is added in order to exchange lauric acid against the fatty
acid. Insoluble fractions are removed by centrifugation or, if possible,
with a magnet and decanting of the supernatant. The precipitation with
acetone is repeated as well as the addition of oleic acid. This procedure
is repeated until the supernatant is clear. The precipitation steps with
acetone are necessary to remove byproducts (dark oil, polymer).
Afterward the particles are redispersed in hexane and stored under
nitrogen in a freezer.
Decomposition of Iron(II) Acetate. In a typical reaction, 8.0 mmol
of FeOAc2 is added to a solution of 2 mL of OA and 14-15 mL of
TOA at room temperature. The dark dispersion is heated to 250 °C
with a heating rate of about 10 °C min-1. Around 200 °C, the dark
dispersion clears and the color changes to light yellow, which changes
again to black a few minutes after reaching 250 °C. The reaction is
kept at 250 °C for an additional 20 min. Reaction temperature, time,
and surfactant concentration can be varied to obtain small spherical,
intermediate cubic, or larger faceted particles. The particles are
precipitated by adding acetone or ethanol after cooling the reaction
mixture to room temperature. The particles are separated and cleaned
by repeated precipitation of the hexane solution with acetone or ethanol.
Afterward the particles are redispersed in hexane and stored under
nitrogen in a freezer.
Structural and Optical Characterization. Images of the particles
were taken on a Phillips CM12 transmission electron microscope (TEM)
in bright-field (BF) and dark-field (DF) mode at 120 kV. Samples were
prepared by drying solvent dispersions of the nanoparticles onto
Formvar amorphous carbon-backed 200 or 400 mesh grids and then
drying under vacuum at 100 °C. Wide-angle and small-angle electron
diffraction patterns were obtained in selected area electron diffraction
mode (SAED), covering areas of ∼1 µm in diameter. X-ray powder
diffraction experiments were performed on a Siemans D-500 diffractometer using Co KR radiation (λ ) 1.78892 Å). Solvent dispersions
of the nanoparticles were dried on glass substrates. FT-IR spectra of
solution (thin-film cell) or solids (dispersed in KBr or dried on polymer
film) were obtained with a Nikola FT-IR spectrometer. Optical images
of superlattices on a glass or silicon substrate were obtained with a
Nikon optical microscope.
Magnetic Characterization. FC (Field Cooled) and ZFC (Zero FC),
and hystereses loops were measured utilizing a Quantum Design
MPMS2 SQUID magnetometer and thin layers of iron oxide particles
deposited on a silicon wafer by evaporation of the solvent (hexane).
Transmission Mo¨ssbauer studies were conducted on a Ranger Electronics Mo¨ssbauer spectrometer equipped with a Janis Research Co. SuperVeritemp dewar and a Lakeshore Co. temperature controller, allowing
sample temperature variation from 4.2 K to room temperature. The
source was 50-mCi 57Co in a Rh matrix, maintained at room temperature. The spectrometer was calibrated with a 7-µm-thick 57Fe-enriched
iron foil. Isomer shifts are referenced to metallic iron at room
temperature. Spectral fits were performed using the program WMOSS
(Web-Research Co). Samples were received in an inert atmosphere and
stored at liquid nitrogen temperature until measured.
Results and Discussion
Synthesis and Reaction Chemistry. We have explored the
synthesis of iron oxides over a range of compositions based on
an underlying reaction scheme that relies on the decomposition
of simple salts or organometallic precursors of Fe in high-boiling
organic solvents in the presence of suitable surfactants. The
surfactants affect the chemistry of the decomposition and control
nanocrystal nucleation and growth in their capacity as ligands
that reduce the surface energy of the crystal. This type of
approach is well established in nanoscale syntheses.38,39 By
optimizing the reaction conditions, we can allow size-selective
formation of solvent-dispersible materials.
To synthesize FexO nanocrystals, different iron precursors
[Fe(CO)5, Fe(acac)2, Fe(acac)3, Fe(OAc)2] were investigated (see
Scheme 1). The decomposition of iron pentacarbonyl has found
broad use in nanoscale syntheses.20,40-43 Iron acetate salts have
been used to generate nanostructured e.g. Ni,44,45 PZT,46 ZnO,47
or rare earth metal oxides.48 Iron(III) acac has been used for
(38) Scher, E. C.; Manna, L.; Alivisatos, A. P. 2003, 361, 241-255.
(39) Murray, C. B.; Kagan, C. R.; Bawendi, M. G. Annu. ReV. Mater. Sci. 2000,
30, 545-610.
(40) Park, S.-J.; Kim, S.; Lee, S.; Khim, Z. G.; Char, K.; Hyeon, T. J. Am.
Chem. Soc. 2000, 122, 8581-8582.
(41) Caro, D. d.; Ely, T. O.; Mari, A.; Chaudret, B. Chem. Mater. 1996, 8,
1987-1991.
(42) Wonterghem, J. v.; Morup, S.; Charles, S. W.; Wells, S.; Villadsen, J. Phys.
ReV. Lett. 1985, 55.
(43) Sun, S.; Murray, C. B.; Weller, D.; Folks, L.; Moser, A. Science
(Washington, DC) 2000, 287, 1989-1992.
(44) Xia, B.; Lenggoro, I. W.; Okuyama, K. Chem. Mater. 2002, 14, 26232627.
(45) Ayyappan, S.; Rao, C. N. R. Eur. J. Solid State Inorg. Chem. 1996, 33,
737-749.
(46) Vorotilov, K. A.; Yanovskaya, M. I.; Turevskaya, E. P.; Sigov, A. S. J.
Sol-Gel Sci. Technol. 1999, 16, 109-118.
(47) Audebrand, N.; Auffredic, J.-P.; Louer, D. Chem. Mater. 1998, 10, 24502461.
J. AM. CHEM. SOC.
9
VOL. 126, NO. 44, 2004 14585
Redl et al.
ARTICLES
Table 1. Reaction Conditions of the Decomposition of Fe(OAc)2 (4.0 mmol)
solvent
(volume)
surfactant
T/°C
t/min
DPE, DOE,
or TOAd
(14 mL)
OAe
(12 mmol)
250-290
120
TOA
(7 mL)
OA
(6.0 mmol)
255
90
TOA
(7 mL)
OA
(3.0 mmol)
255
10
255
25
255
80
255
140
a/Åa
yb
phase
(crystal sizec)
observations, size, and shape
(derived from TEM)
Fe3O4 or
γ-Fe2O3
(3.5 nm)
slow (temperature-dependent)
reaction, 4-5 nm NC, 5% SD,
oxidized during isolation
4.240
0.80
FexO (10 nm)
Fe3O4 (3-4 nm)
bimodal size distribution: minority of 5 nm
small Fe3O4 particles (after oxidation in air)
and majority of strongly faceted ellipsoidal
FexO NC with 14 nm (long axis)
4.229
0.78
4.247
0.82
4.285
0.90
4.289
0.90
FexO (7 nm)
cubic (8 nm edge length, 12 nm diagonal
length, SD 8%)
cubic (11 nm edge length, 15 nm diagonal
length, SD 7%)
faceted particles (18 nm, SD 8%), truncated
octahedrons
faceted particles (19 nm), truncated and
elongated octahedrons
FexO (9 nm)
Fe3O4 (3 nm)
FexO (12 nm)
Fe3O4 (3 nm)
FexO (13 nm)
Fe3O4 (5-6 nm)
a Cubic crystal cell length a calculated from {200} Bragg reflection for Fe O phase. b Calculated applying the formula a(Å) ) 3.856 + 0.478y.59 c Calculated
x
from broadening of Bragg reflections in the X-ray pattern {Fe3O4, (311); R-Fe, (110); FexO, (200)}. d DPE, DOE, and TOA are diphenyl ether, dioctyl ether,
e
and trioctylamine, respectively. OA is oleic acid.
Table 2. Reaction Conditions of the Decomposition of Fe(CO)5 (3.02 mmol) in the Presence of PYO
solvent
(volume)
oxidizer,
surfactant
T/°C
t/min
DPE
(14 mL)
PYO (15.2 mmol)
LA (9.12 mmol)
256
100
TOA
(14 mL)
PYO (12.6 mmol)
LA (9.12 mmol)
350
60
TOA
(14 mL)
PYO (15.2 mmol)
LA (9.12 mmol)
296
TOA
(14 mL)
PYO (15.2 mmol)
LA (9.12 mmol)
296
a/Åa
yb
phase
(crystal sizec)
FexO
slow reaction, broad size distribution
(10-60 nm), very diffuse electron
diffraction pattern
4.275
0.88
FexO (20 nm)
a-Fe (22 nm)
Fe3O4 (32 nm)
cubic or nearly cubic particles, size
distributions centered around 30,
60, and 100 nm
60
4.292
0.91
FexO (10 nm)
star shaped NC, 20-30 nm diameter and
larger aggregates
20
4.286
0.90
FexO (7 nm)
aggregates of small seeds of 8 nm
FexO
Fe3O4
Fe
spherical, faceted FexO particle (15 nm)
and cubic particles (Fe3O4+Fe) with
40 nm diagonals
FexO
Fe3O4
Fe
spherical, faceted FexO particle (15 nm)
and cubic particles (Fe3O4 + Fe) with
40 nm diagonals
FexO
cubes of 16 nm diagonal length
FexO (9 nm)
cubes with diagonal length of 15 nm,
8% SD
cubes (less regular than after 35 min)
with diagonal length of 17 nm
60
TOA
(14 mL)
PYO (15.2 mmol)
LA (9.1 mmol)
296
50
DOE
(14 mL)
PYO (11.4.mmol)
LA (9.1 mmol)
296
45
DOE
(14 mL)
PYO (7.6 mmol)
LA (9.1 mmol)
296
35
70
DOE
(18.6 mL)
DOE
(28 mL)
PYO (7.6 mmol)
LA (9.1 mmol)
PYO (7.6 mmol)
LA (9.1 mmol)
observations, size, and shape
(derived from TEM)
4.258
0.84
4.231
0.79
4.261
0.85
FexO (10 nm)
296
30
FexO
faceted spheres of 12 nm diameter
296
60
Fe3O4 (23 nm)
R-Fe (23 nm)
large cubes or faceted particles
about 30 nm
296
30
(90)
FexO-Fe3O4
spherical particles of 8 nm (SD is
increasing over time; particles up
to 13 nm are observable later on)
a Cubic crystal cell length a calculated from {200} Bragg reflection. b Calculated with the formula a(Å) ) 3.856 + 0.478y.59
broadening of Bragg reflections in the X-ray pattern {Fe3O4, (311); R-Fe, (110); FexO, (200)}.
film deposition49-52 and recently to generate magnetite nanocrystals with sizes ranging from 4 to 20 nm by a seeded growth
reaction.37 Details of the reaction of iron acac compounds to
form FexO nanocrystals, with generally less control over size
and extent of aggregation, are summarized briefly in the
Supporting Information. Reaction conditions and products are
summarized in Tables 1 and 2.
(48)
(49)
(50)
(51)
Hussein, G. A. M. J. Anal. Appl. Pyrol. 1996, 37, 111-149.
Pal, B.; Sharon, M. Thin Solid Films 2000, 379, 83-88.
Itoh, H.; Takeda, T.; Naka, S. J. Mater. Sci. 1986, 21, 3677-3680.
Itoh, H.; Uemura, T.; Yamaguchi, H.; Naka, S. J. Mater. Sci. 1989, 24,
3549-3552.
(52) Langlet, M.; Labeau, M.; Bochu, B.; Joubert, J.-C. IEEE Trans. Magn.
1986, Mag-22, 151-156.
14586 J. AM. CHEM. SOC.
9
VOL. 126, NO. 44, 2004
c
Calculated from peak
Decomposition of Iron(II) Acetate. In this approachm Fe(II) acetate (Fe(OAc)2) is transferred into TOA, DOE, or DPE
with OA and heated under a flux of nitrogen until reaction takes
place. Evaporated compounds are trapped and prevented from
dropping back. The concentration of OA has strong influence
on the time interval until decomposition is visible. By applying
a 3-fold surplus of oleic acid (12 mmol vs 4.0 mmol Fe(OAc)2),
the reaction is observed only after 2 h at 250 °C. The reaction
time can be shortened by applying higher reaction temperatures.
Those reaction conditions yield typically small (4 nm) nanocrystals with a narrow size distribution of 5% (Figure 1a), which
are oxidized to magnetite or maghemite during the isolation.
The high concentration of OA inhibits the reaction and the
Characterization of Nonstoichiometric Iron Oxides
ARTICLES
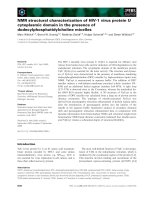
Figure 1. Nanocrystals obtained by decomposition of Fe(OAc)2 in TOA at 250-260 °C. (a) 4 nm Fe3O4 or γ-Fe2O3 nanocrystals (4-fold surplus of OA,
oxidized during isolation) forming superlattices. Inset: higher magnification of the image. (b) Irregular-shaped faceted particles of 14 nm and spherical
particles of 5 nm obtained by decomposition of 8 mmol Fe(OAc)2 in 12 mmol of OA/14 mL of TOA. (c) Cubic FexO particle isolated in the early growth
state (8 mmol of Fe(OAc)2 vs 6 mmol of OA, 10 min at 255 °C). (d) Cubic FexO nanoparticles isolated in a intermediate growth state (8 mmol of Fe(OAc)2
vs 6 mmol of OA, 25 min at 255 °C). Inset: high-resolution TEM image of a bilayer of a simple cubic superlattice showing thickness fringes. (e) Large FexO
particles (mostly truncated octahedrons) isolated in a late growth state (8 mmol of Fe(OAc)2 vs 6 mmol of OA, 80 min at 255 °C). Inset: high-resolution
TEM image of the FexO particles showing lattice fringes. (f) Large FexO particles (mostly truncated octahedrons) isolated after stopping the reaction (8
mmol of Fe(OAc)2 vs 6 mmol of OA, 140 min at 255 °C).
growth of the particles. At lower OA concentration (1.5 molar
excess), it takes about 60 min at 250 °C. After a further 30
min, the reaction is stopped and all nanocrystals are precipitated
with ethanol. A bimodal size distribution is observed (see Figure
1b). Large particles with various irregular shapes (long axis 14
nm, 8% SD) are mixed with small spherical particles (5 nm,
15% SD). The bimodal distribution can be separated by careful
precipitation of hexane solutions with acetone, separating large
particles from small particles. The best control over particle size,
distribution, and uniformity is accomplished by further reducing
the amount of oleic acid. Figure 1c-f shows particles evolving
during the decomposition of 8 mmol of Fe(OAc)2 dispersed in
6 mmol of OA and 14 mL of TOA. The decomposition is
obvious within minutes after reaching 255 °C. TEM images of
a sample taken after 10 min show small FexO cubes with
diagonal length of 12 nm (edge length of 8 nm, SD 8%). After
an additional 15 min, the cubes have grown to a diagonal length
of 15 nm (edge length of 11 nm, SD 7%, Figure 1d). The shapes
are more regular compared with the smaller diameter samples,
which facilitates the assembly into simple cubic superlattices,
even during fast evaporation of the solvent. Additional reaction
time leads to further growth of the particles. The particle shapes
change to (mostly) truncated octahedrons (18 nm, SD 8%, Figure
1e), which are sometimes elongated in one direction. After 140
min at 255 °C the particle size increases, leading to particles
that are more difficult to stabilize in solution due to increasing
van der Waals forces (and possible magnetic dipole contributions). Aggregation makes the measurement of a representative
value for the mean diameter from TEM images not as reliable,
but the estimated average size is ∼19 nm (Figure 1f). The
temperature and time dependence of the reaction can be
attributed to the decomposition of different intermediates. In
the case of a surplus of oleic acid, the formation and subsequent
decomposition of iron(II) oleate is dominant; in the case of
excess acetate, both species might contribute to the decomposition and also both anions might act as surfactant to control the
growth rate and stabilization of the evolving nanoparticle.
Decomposition of Iron Pentacarbonyl and Subsequent
Oxidation with PyO. For the decomposition of Fe(II) salts,
we examined a tunable oxidation method applicable in organic
solvents. Hyeon et al. have recently shown that iron nanocrystals
can be oxidized to maghemite with trimethylamine N-oxide.20
In this approach, either the iron nanocrystal is oxidized in a
separate step or maghemite is directly synthesized by decomposition of iron pentacarbonyl in the presence of the oxidizer.
We used similarly synthesized nanocrystals to assemble them
in combination with PbSe nanocrystals into binary AB2, AB13,
or AB5 superlattice structures.53
During our investigations, we tested pyridine N-oxide (PyO).
It is known that the oxidation potential of aromatic N-oxides is
lowered in comparison with that of alkyl-substituted N-oxides
and therefore may favor only partial oxidation to form, for
example, Fe3O4.54 When PyO is used to oxidize preformed iron
nanocrystals (around 10 nm), aggregation is observed at high
(53) Redl, F. X.; Cho, K.-S.; Murray, C. B.; O’Brien, S. Nature (London) 2003,
423, 968-971.
(54) Ochiai, E. Aromatic Amine Oxides; Elsevier Publishing Co.: Amsterdam,
1967.
J. AM. CHEM. SOC.
9
VOL. 126, NO. 44, 2004 14587
Redl et al.
ARTICLES
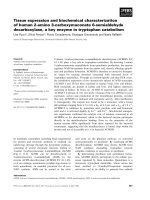
Figure 2. TEM images of nanoparticles produced by the decomposition of iron pentacarbonyl in DOE or TOA in the presence of LA and PyO. (a) Spherical
particles of 8 nm size. (b) Superlattices of 8 nm nanoparticles. (c) Mixture of spherical and cubic particles, which have a diagonal length of roughly twice
the diameter of the spherical particles. (d) Cubic particles of 13 nm edge length and 18 nm diagonal length. (e) Cubic and “star-shaped” particles. (f)
Aggregates of spherical particles forming “cubic” particles. (g) Larger “star-shaped” particles. (h) Larger strongly faceted particles. (i) Large cubic particles
composed of R-Fe and Fe3O4.
temperatures (>300 °C), resulting in large particles composed
of R-Fe, magnetite, and wu¨stite. Under the same conditions,
trimethylamine N-oxide yields uniform iron oxide (either
γ-Fe2O3 or Fe3O4) of narrow size distribution and similar size
compared with the starting material.
At lower temperatures (∼250 °C), the oxidation of iron
particles with PyO yields magnetite or maghemite without
aggregation. Despite peak-broadening, Bragg reflections match
better with the reference values of magnetite. Nanocrystals have
a broad size distribution and an average size smaller than the
observed narrow size distribution (<10%) of the initial Fe
nanoparticles. Because of the similarity of the high-temperature
reaction products in the case of oxidation with PyO with the
decomposition of Fe(acac)2 (Supporting Information), it is
assumed that the initial iron particles are oxidized to FexO, which
undergoes a subsequent reaction to iron and magnetite, accompanied by particle aggregation. The increased size of these
large particles/aggregates inhibits complete oxidation by a
surplus of pyridine N-oxide. Similar experiments at lower
temperatures in DOE (in which the decomposition is no longer
favored) have shown that the initial particles are small enough
(6-8 nm) to allow a complete oxidation, consistent with
observations of nanocrystal oxidation in air. This process is
accompanied by a pronounced increase in size distribution and
by the evolution of smaller particles with various shapes. We
conclude that etching and recrystallization must be responsible
for this size evolution.
14588 J. AM. CHEM. SOC.
9
VOL. 126, NO. 44, 2004
The observed changes in oxidation profile due to PyO
prompted a survey of the iron pentacarbonyl decomposition
reaction in the presence of the PyO. Typically, pyridine N-oxide
was added at 100 °C to a solution of LA in DOE, shortly
followed by the iron pentacarbonyl. Within the first minutes
after addition of the iron pentacarbonyl, the color of the solution
changes to a dark red, indicating a reaction between the iron
precursor and PyO. The absorption spectrum of the intermediate
species is shown in Figure 6 in the Supporting Information.
The mixture is kept at 120 °C for 1 h under nitrogen. Afterward
the solution is heated (usually 10-20 °C/min) to the reaction
temperature (typically the boiling point of the solution). DPE,
DOE, and TOA were used as solvents. The boiling temperature
of DPE is too low to achieve a sufficiently rapid decomposition
rate; therefore, the particles exhibiting a broad size distribution
can be isolated only after 2 h reaction time. In contrast, the
higher boiling solvent TOA allows decomposition and formation
of particles within 30 min, with accurate control over temperature (Figure 2c,g,h). Temperatures above 300 °C promote phase
transition and aggregation (see Figure 2i) of the particles. The
most reproducible results were obtained with DOE as solvent
(see Figure 2a,b,d-f). The boiling point of 296 °C allows a
sufficient reaction rate, whereas the temperature is low enough
to largely avoid disproportionation and aggregation. Further
experiments with similar concentrations of precursors proved
that nanocrystals formed in DOE have a narrower size distribution (5-10%) and more regular shapes (cubic or spherical)
Characterization of Nonstoichiometric Iron Oxides
ARTICLES
Scheme 2 . Proposed Reaction Scheme with a Fast Preliminary
Acid-Base Reaction and Dimerization, Which Keeps the Effective
Concentration of Pyridine N-Oxide (PyO) Comparably Low and
Approximately Constant
compared to those obtained in TOA. LA and OA were tested
as surfactants. LA was found to be more advantageous because
less polymeric side products were produced.
Table 2 lists the experiments and observations for the iron
precursor decomposition reactions in the presence of PyO. The
product of the reaction is mainly governed by temperature and
solvent. In this context, the boiling point of the solvent (DOE)
is a convenient limit to adjust the temperature. In addition,
aggregation is less pronounced in DOE compared with TOA,
under identical reaction conditions.
The concentration of surfactant was varied between zero and
a 4-fold surplus with regard to the Fe(CO)5. Without LA, iron
pentacarbonyl reacts instantaneously with PyO dispersed in DOE
at 100 °C, which is visible as a black oily precipitate and gas
evolution, presumably due to decarbonylation similar to reactions of trimethylamine N-oxide with iron carbonyls.55 In the
presence of LA, gas evolution was noticed only at higher
temperatures (in general between 170 and 200 °C). Pyridine
starts to boil at ∼220 °C. In the case of a 4-fold surplus of LA
vs PyO, no reaction was observable within a few hours. Our
findings suggest the type of reaction mechanism depicted in
Scheme 2, which is based on an equilibrium reducing the
amount of effective (free) oxidizer in solution. PyO can react
as a base with LA or form strong heteroconjugates with the
acid. Further, dimerization of PyOH+ and PyO also reduces the
concentration of PyO in solution.56,57 According to pKa values
of PyOH+ in organic solvents and the heteroconjugation, the
concentration of (free) PyO might be lowered noticeably in
comparison to the concentration of iron pentacarbonyl.
In principle, the decomposition of iron pentacarbonyl can be
promoted by LA, as well as pyridine, which evolves during the
consumption of PyO. It is known that surfactants or reactants
such as pyridine, N-methylpyrolidone, oximes, imines, or dienes
accelerate the decarbonylation and final decomposition.58 The
initial step in these reactions is formulated as a disproportionation. The decarbonylation in pure solvent is inefficient, because
of the predominant equilibrium between Fe(CO)5, Fe2(CO)9, and
CO. Furthermore, adsorption of CO on iron seeds inhibits
catalytic growth and decomposition on the metal surface.
To determine whether disproportionation plays a role in the
reaction, samples of the solution were characterized ex situ with
IR spectroscopy (see Supporting Information Figure 5). LA
dissolved in DOE shows typical absorptions of the CO stretch
vibration of monomer and dimer in solution (dioctyl ether) at
1740 and 1712 cm-1. After addition of PyO (which has only
low solubility in DOE without the addition of LA) these
absorptions become broader and a shift in the broad OH
absorption of the acid is recognizable, indicating heteroconjugation or proton exchange between the acid and the base. After
(55) Burke, S. D., Danheiser, R. L., Eds. Oxidizing and Reducing Agents; John
Wiley & Sons: New York, 1999.
(56) Chmurzynski, L. Anal. Chim. Acta 1996, 321, 237-244.
(57) Chmurzynski, L. Anal. Chim. Acta 1996, 329, 267-274.
(58) Smith, T. W.; Wychlck, D. J. Phys. Chem. 1980, 84, 1621-1629.
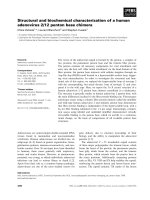
Figure 3. X-ray diffraction patterns from film-casted cubic wu¨stite
nanocrystals of 12 nm edge length (a) before and (b) after annealing at 400
°C under nitrogen for 30 min.
addition of Fe(CO)5 and heating to 170 °C, the typical carbonyl
absorption modes of the equatorial and axial ligands at 2020
and 2000 cm-1 are still recognizable, whereas the CH bending
modes of the PyO are already reduced. After reaching higher
temperatures (220 and 290 °C), the carbonyl stretching modes
and CH bending modes of PyO have completely vanished. The
results indicate the complete decarbonylation of the iron
pentacarbonyl at temperatures higher than 170 °C under
consumption of PyO. GC-MS data show that, in the course of
the reaction, different alkyl-substituted pyridines (R-Py) evolve,
which can be expected to contribute to the surface chemistry
of the reaction. It seems likely that the initial decomposition of
the iron pentacarbonyl is accompanied by the oxidation of the
iron to Fe2+ and that the final reaction, yielding FexO nanoparticles, is a decomposition of e.g. iron(II) laurate (similar to
the decomposition of iron oleate or iron acetate reported in the
previous paragraph).
Overall, it can be stated that the acid-base equilibrium has
a strong influence on the reaction and the resulting product,
and the correlation between concentration and particle size,
shape, and size distribution is nontrivial. Particle size can be
varied over a range of 8 nm (spheres) to ca. 17 nm (diagonal
length of cubes) by changing the concentrations of all precursors
simultaneously in DOE and by adjusting the reaction time.
Distributions of diameter are typically below 10% RMS without
size selection.
Structural Characterization. The iron oxide nanoparticles
were characterized by X-ray diffraction, differential scanning
calorimetry (DSC), electron diffraction, and bright-field and
dark-field TEM techniques. Due to the sensitivity of the wu¨stite
phase to oxygen, we have based our observations on a series
of structurally identical wu¨stite samples over a composition
range of 0.83-0.96.
As can be seen from Figure 3a, the observed Bragg reflections
match well with FexO reference values (JCPDS 01-1223). It is
known that the lattice constant of nonstoichiometric FexO
depends on the amount of iron.59 By utilizing this linear
(59) McCammon, C. A.; Liu, L. Phys. Chem. Miner. 1984, 10, 106.
J. AM. CHEM. SOC.
9
VOL. 126, NO. 44, 2004 14589
Redl et al.
ARTICLES
relationship, one can calculate the iron content from X-ray
diffraction patterns (see Tables 1 and 2). Applying this to our
materials usually gives values within the validity range (0.83
to about 0.96) of the linear relationship. In general, smaller
particles display a higher content of Fe3+, which is probably
due to the stronger influence of oxidation during isolation and
measurement in air. The formation of nearly stoichiometric
FexO, which has been reported recently as a consequence of a
two-step disproportionation of nonstoichiometric wu¨stite,16,60 has
not been observed. The first step is the formation of magnetite
and nearly stoichiometric FexO, which is reported to take place
around 470 K. The final decomposition of the stoichiometric
FexO happens at temperatures higher than 530 K, indicating a
higher stability of the stoichiometric FexO under those nonequilibrium conditions.
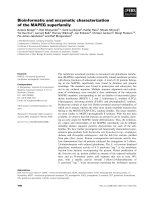
Figure 4a shows the TEM image of self-assembled faceted
FexO nanocrystals. The SAED pattern (at high magnification)
of those nanocrystals is typical for nearly all obtained FexO
nanocrystals. Usually there are two rings of spots belonging to
the {200} and {220} reflections of wu¨stite and two broader
rings with less intensity for larger d spacing, which belong to
magnetite [(311) and (220)] with obviously smaller particle size.
From X-ray diffraction (e.g., see shoulders in Figure 3a
belonging to the maghemite phase), the magnetite crystallite
size can be calculated to be smaller than 3 nm from linebroadening (Lorentz fits were applied to determine size from
the (311) reflection according to the Debey-Scherrer equation).
The most intense diffraction rings of both phases are well
separated, enabling us to distinguish between the two phases
by dark-field TEM imaging. Figure 4c shows the negative of
the dark-field image of Figure 4a by selecting a fraction of the
(311) reflection of magnetite. Figure 4d shows a part of the
wu¨stite nanocrystals by selecting a fraction of the (220)
reflection of wu¨stite. On the basis of the observation of diffuse
rings in the SAED for magnetite, versus diffraction spots for
magnetite, we conclude that the particles are mainly composed
of the FexO phase with small seeds of magnetite included. The
seeds are about 2 nm in size (matching calculated particle sizes
from line broadening in XRD) and show similar orientation
within a single wu¨stite particle, concluded from the visibility
of multiple seeds in single particles by choosing only a small
part of the diffraction ring pattern. It is not surprising that the
orientation of the arising magnetite is guided by the parent
wu¨stite structure: both structures are based on fcc lattices of
oxygen, whereby the first step of the proposed reaction of
wu¨stite into magnetite and nearly stoichiometric wu¨stite can be
thought of as diffusion of iron ions within the oxide framework.
Figure 3a shows an X-ray diffraction pattern typical for the
obtained cubic or spherical FexO particles (about 11-13 nm in
size). In addition to the wu¨stite reflection, a shoulder at 2θ )
41° is visible which we believe corresponds to the magnetite
seeds within the wu¨stite particles. The wu¨stite particle size
calculated from peak broadening is slightly less than the average
size derived from TEM images (e.g., 11 nm spherical particle
are calculated to be 8-9 nm in size from peak broadening).
Annealing of the wu¨stite particles at 400 °C for 30 min converts
the material nearly completely to magnetite and R-Fe, determined unequivocally from SAED during annealing of the sample
on the heating stage of the TEM at 400 °C (see Supporting
Information Figure 6). Heating to temperatures above 600 °C
leads to the back-formation of wu¨stite. No change of particle
size or shape can be observed during the transformation of the
material; only changes in contrast of individual particles are
obvious. During the decomposition, a lighter shell surrounding
the particles is formed, which is most likely due to decomposition of surfactant and formation of a uniformly deposited surface
carbon coat.43 It is reported for large FexO particles that the
decomposition around 530 K forms complex particles composed
of layers of R-Fe and magnetite, which are back-transformed
to wu¨stite at temperatures over 833 K.61,62
X-ray powder diffraction analysis of the decomposition product at 400 °C shows in most cases only reflections for magnetite (see Figure 3a, measurement in air). The initially formed
iron is oxidized during handling in air after the heat treatment.
It seems likely that this is facilitated by a core-shell structure
with iron on the outside of the particle. This core-shell structure
can be explained on the basis of the observed FexO structure
incorporating small magnetite seeds, which function as seeds
for further growth in the final reaction. This indicates a simultaneous process of diffusion of iron ions into tetrahedral sites
and electron transfer combined with migration of excess iron
away from the core, leading to growing magnetite cores encased
by iron. The wu¨stite-R-Fe/magnetite phase transition was monitored by DSC with two consecutive runs (Supporting Information Figure 7) using the wu¨stite nanocrystals depicted in Figure
4a. The second run shows no transformation and is therefore
taken as reference, dividing exothermic or endothermic heat
flow. A very broad exothermic response with a maximum at
150 °C is due to the transformation of wu¨stite. The endothermic
“melting” (order-disorder transition) of the surfactant is probably hidden by the decomposition. Features at 310 °C, 340 °C,
(60) Voncken, J. H. L.; Bakker, T.; Heerema, R. H. Neues Jahrb. Mineral.,
Monatsh. 1997, 410-422.
(61) Tokumitsu, K.; Nasu, T. Scr. Mater. 2001, 44, 1421-1424.
(62) Tokumitsu, K.; Nasu, T. Mater. Sci. Forum 2000, 343-346, 562-567.
Figure 4. (a) TEM image of wu¨stite nanocrystals with seeds of magnetite
inside. (b) SAED (selected area electron diffraction) of the specimen
showing a speckled pattern for FexO reflections and diffuse rings for
magnetite reflctions. (c) Dark-field image of the region in panel a (shown
as negative); a part of the magnetite reflections was selected with the
objective aperture. (d) Dark-field image of the region in panel a (shown as
negative); a part of the wu¨stite reflections was selected with the objective
aperture.
14590 J. AM. CHEM. SOC.
9
VOL. 126, NO. 44, 2004
Characterization of Nonstoichiometric Iron Oxides
ARTICLES
Figure 5. (a) TEM image of a single cubic superlattice built of cubic FexO nanocrystals with 11 nm edge length. (b) SAED of the cubic superlattice
showing strong reflections of the FexO phase and weak reflections typical for magnetite. Orientational ordering is obvious from the inhomogeneous but
symmetrical distribution of the reflections. (c) TEM image of an irregular gathering of cubic superlattices (0.1 µm up to about 0.5 µm). (d) Nearly exclusive
formation of cubic superlattices homogeneously distributed over one 40 × 40 µm square of the TEM grid. (e) TEM image of rectangular and oriented
superlattices obtain during the evaporation of solvent (hexane/octane) in a magnetic field parallel to the observed long axis of the superlattices. (f) SAED
of an originally FexO superlattice after disproportionation (and oxidation in air) to magnetite. The orientational ordering is preserved in the transformation
to the higher oxidation state.
and higher temperatures can be attributed to the decomposition
of excess oleic acid and surface-bound oleic acid.63
Particle sizes of magnetite obtained by annealing of wu¨stite
films correspond well with the initial wu¨stite particle size. The
phase transition happens, therefore, without aggregation and
particle growth. The wu¨stite nanocrystals can be directly
converted to maghemite, γ-Fe2O3, by annealing in oxygen at
200 °C for 1 h. Even if the structures of maghemite and
magnetite are very similar, both phases obtained from the same
cubic nanocrystals can be clearly identified and distinguished.
Both match perfectly with the corresponding reference values.
According to this, it is possible to obtain cubic nanocrystals of
magnetite and maghemite of about 11-13 nm, which is usually
cannnot be accomplished by direct synthesis.
Self-Assembly of Iron Oxide Nanocrystals into Superlattices. The selective oxidation synthesis of wu¨stite allows reproducible generation of spherical nanocrystals of 8-10 nm in
size or cubic nanocrystals between 11 and 13 nm in size (edge
length). The highly narrow size distribution (diameters with
5-10% rms) of the particles facilitates their assembly in longrange ordered superlattices. The spherical and sometimes faceted
particles form the most densely packed superlattices (Figures
2b and 4a) with sharp edges and hexagonal shape.64
Superlattices built from cubic FexO nanocrystals are shown
in Figure 5. The particles assemble effectively despite fast
solvent evaporation rates. In the limit of spatially homogeneous
evaporation, where the boundaries of nanoparticle domains
remain fluxional throughout the growth dynamics, the evaporation rate is not believed to be an important parameter.65 The
(63) Osman, M. A.; Suter, U. W. Chem. Mater. 2002, 14, 4408-4415.
(64) Collier, C. P.; Vossmeyer, T.; Heath, J. R. Annu. ReV. Phys. Chem. 1998,
49, 371-404.
(65) Rabani, E.; Reichman, D. R.; Geissler, P. L.; Brus, L. E. Nature 2003,
426, 271-274.
Figure 6. Optical microscope images of self-assembled superlattices of
cubic wu¨stite nanocrystals. (a) Material as obtained from syntheses. (b)
After annealing of a deposited film on a glas substrate at 200 °C in 5%
forming gas. (c) Needles of aggregated superlattices aligned during
deposition by an external magnetic field parallel to the surface. (d)
Rectangular superlattices formed during self-assembly of cubic nanocrystals
in a magnetic field perpendicular to the substrate. (e) Same region as in
panel d with focus stepped up in the z-direction, showing assemblies of
pillars of superlattices pointing toward the observer in the direction of the
applied external magnetic field.
particles arrange nearly exclusively into cubic superlattices
(Figure 5a,c,d) which are visible under an optical microscope
(Figure 6a, a superlattice of superlattices). Interestingly, most
of those cubic superlattices have similar sizes (around 200 nm,
which corresponds to a two-dimensional array of 17 × 17
cubes). This indicates a widespread homogeneous and simulJ. AM. CHEM. SOC.
9
VOL. 126, NO. 44, 2004 14591
Redl et al.
ARTICLES
Figure 7. X-ray diffraction analysis of solution casted films on a Si
substrate. (a) Small-angle Bragg reflections from the cubic superlattice. (b)
Wide-angle diffraction pattern. (c) Wide-angle diffraction pattern after
annealing at 200 °C in 5% H2/Ar.
taneous nucleation event during the solvent evaporation. These
superlattices are stable under annealing conditions (Figure 6b),
whereby the single particle sizes remain unchanged, as proven
by line broadening in X-ray diffraction. As discussed in the
Structural Characterization section (above), the crystals are
terminated by {100} surfaces. The high symmetry of the crystal
lattice and the supposedly preferable plane-to-plane arrangement
of the nanocrystal lead to orientational ordering in superlattices,
as confirmed by SAED and small-angle and wide-angle X-ray
diffraction. The SAEDs in Figure 5b,f were recorded from single
cubic superlattices of FexO before and after decomposition. The
uneven but symmetrical distribution of the {220} and {200}
FexO or (220), (311), (400), and (440) Fe3O4 Bragg reflections
clearly indicates identical orientation of the crystallites. The
reflections in the small-angle X-ray diffraction pattern (Figure
7a) can be identified as {100}SL (plane spacing of 13.6 nm)
and {111}SL (plane spacing of 7.5 nm), corresponding to a
simple cubic arrangement of the subunits, which maximizes
particle interaction by shared interfaces. The calculated crystal
dimension of 13.6 nm matches the dimension of the crystal size
(11 nm) and the additional spacing (2 nm) governed by
interdigitating oleic acid molecules on the particle surface.
The alternate arrangement that might also fit the data, the
fcc superlattice (Supporting Information Scheme 1), can be ruled
out by SAX results and TEM observations. Because there is no
free space in this arrangement, a high particle density of about
0.84 is reached, exceeding the density of fcc or hexagonal closepacked (hcp) ordered spheres. The wide-angle X-ray diffraction
pattern of self-assembled cubic superlattices of FexO nanocrystals in Figure 7b displays an intensity distribution which is
clearly different from the values expected for a random
orientation of crystallites. This can be explained as resulting
from cubes of FexO lying with {100} surfaces on the substrate.
The three degrees of rotational freedom are reduced to two. The
highest reflection intensity is therefore found for the (200) plane,
which is parallel to the surface (z-axis defined perpendicular to
the substrate). Similar to this consideration, SAED should give
the highest intensities for (200), (020), or (220) reflections (see
Figure 5b). The superlattices are stable under annealing condi14592 J. AM. CHEM. SOC.
9
VOL. 126, NO. 44, 2004
tions. The superlattices were annealed in a reducing atmosphere
(5% forming gas) at 200 °C for 30 min (which is insufficient
to reduce the iron oxides), leading to the decomposition of the
wu¨stite into magnetite and iron, which is oxidized before the
X-ray diffraction measurement during handling in air. The
resulting X-ray pattern in Figure 7c again shows an intensity
distribution not typical for isotropic distributed crystallites. The
crystal structure of the resulting magnetite is based on the fcc
oxygen substructure in the parent FexO phase. Similar to FexO,
the highest intensity reflection originates from the (400) plane
parallel to the surface plane and therefore parallel to the substrate
plane.
Self-assembly of the cubic nanocrystals can be directed by
an external magnetic field. Figure 5e shows a TEM image of
superlattices formed in a weak external magnetic field (two small
permanent magnets) parallel to the grid surface. The superlattices
are aligned in the direction of the magnetic film and form
needle-like structures by a sequence of neighboring superlattices.
It is interesting to note that most superlattices have a rectangular
shape, with the long axis parallel and the short axis perpendicular
to the external field, presumably maximizing constructive
interparticle forces, whereas superlattices deposited under zero
field are of square shape and randomly oriented. The nanocrystals are observed to align according to a combination of
the evaporation-driven self-assembly and the influence of the
magnetic field. This phenomenon can also be observed under
the light microscope. Figure 6c shows needles of superlattices
up to a few micrometers long, which are formed under a parallel
magnetic field. If the external magnetic field is perpendicular
to the substrate, shorter-range superlattices are formed, either
lying flat on the surface or building bundles of pillars in the
direction of magnetic field (see Figure 6d,f).
Since the assembly process is influenced by an external
magnetic field, we conclude that the nanoparticles are behaving
either like free paramagnetic spins (wu¨stite) or like superparamagnetic particles (coupling of spins that would be expected
in magnetite seeds in the particles). The weak magnetic response
of the cubes is crucial, because on one hand it allows the
alignment by an external magnetic field and on the other hand
magnetic dipole attraction between the particles at room
temperature is low, which promotes this type of hierarchical
self-assembly.
Mo1 ssbauer Characterization. Structural characterization
gave a clear indication of the simultaneous existence of both
wu¨stite and magnetite phases in the nanocrystals, with the
propensity of conversion to the more oxidized state. Mo¨ssbauer
spectroscopy was performed in order to gain full insight into
the behavior and relative compositions of Fe2+ and Fe3+ in the
different oxygen coordination environments. Mo¨ssbauer studies66 were conducted on four samples: First, the original, asprepared sample of FexO/Fe3O4 cubic nanocrystals (sample 1)
was prepared according to the procedure described previously,
with further detail in Table 3. Sample 1 was then calcined in
nitrogen at 200, 400, and 600 °C for 5 min, to give samples 2,
3, and 4, respectively (see Table 3). Data were collected at
sample temperatures in the range 4.2 K < T < 300 K. The
spectra exhibited complex magnetic interactions due to the
presence of multiple magnetic phases within a particle and
(66) Greenwood, N. N.; Gibb, T. C. Mo¨ssbauer Spectroscopy; Chapman and
Hall: London, 1971.
Characterization of Nonstoichiometric Iron Oxides
ARTICLES
Table 3. Weighted Content of Various Iron Oxide Phases from Mo¨ssbauer Spectral fits at T ) 300 K and Associated Blocking
Temperatures, XRD, and TEM data
sample
FexO (%)
Fe3O4 (%)
XRD, TEM
TB (K)
1
2
3
4
51 (paramagnetic)
41 (paramagnetic)
7 (paramagnetic)
6 (paramagnetic)
49 (superparamagnetic/interfacial)
59 (superparamagnetic/interfacial)
93 (intermediate relaxation)
67 (superparamagnetic and interfacial)
27 (magnetic)
7 nm FexO, 3 nm Fe3O4
7 nm FexO, 4 nm Fe3O4
10-12 nm Fe3O4
18 nm Fe3O4, 6-7 nm FexO
175
138
180
190
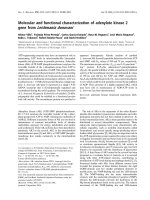
Figure 8. (a) Mo¨ssbauer spectra of samples 1-4 at room temperature. The solid lines are least-squares fits of the experimental points to the superposition
of various iron-oxide phase. (b) Mo¨ssbauer spectra of samples 1-4 (from top to bottom) at 4.2 K. (c) Mo¨ssbauer spectra of sample 4 at 4.2 K. Individual
component spectra in color depict contributions to the spectrum by various iron oxide phases. The solid line through the experimental points gives the
least-squares fit of the experimental data to the resultant, convoluted theoretical spectrum. On the right, the internal magnetic field distributions for each
subcomponent spectrum is given. Spectral components in brown and green are associated with the Fe3+ and Fe2+ sites of magnetite, respectively. The
spectral component in blue is associated with crystalline, antiferromagnetic FexO, and the broad component in red is associated with an interfacial FexO/
Fe2O4 amorphous, spin-glass-like phase.
superparamagnetic behavior typical of small, magnetically
ordered particles.67 Spectral fits were obtained assuming the
superposition of spectral signatures due to (1) paramagnetic
FexO, (2) superparamagnetic Fe3O4, (3) magnetic Fe3O4, (4)
antiferromagnetic FexO, and (5) interfacial FexO/Fe3O4 phases
(67) Dorman, J. L., Fiorani, D., Eds. Magnetic Properties of Fine Particles;
Elsevier: Amsterdam, 1992.
in various amounts, depending on sample calcination conditions
and temperature of measurement.
Room-temperature Mo¨ssbauer spectra of the original and
annealed samples are shown in Figure 8a. The solid lines are
theoretical fits to the data assuming a superposition of spectral
signatures corresponding to four distinct phases: (1) paramagnetic FexO, simulated with a broad collapsed absorption line
J. AM. CHEM. SOC.
9
VOL. 126, NO. 44, 2004 14593
Redl et al.
ARTICLES
Table 4. Weighted Content of Various Oxide Phases from
Mo¨ssbauer Spectral Fits at T ) 4.2 K
sample
FexO (%)
1
2
3
4
4
3
3
8
av Hint
(kOe)
Fe2+, 410
Fe3O4 (%)
glass phase (%)
65
77
87
35
Fe3+, 507
Fe2+, 495
31
20
6
57
Fe2+, 319
with isomer shift, δ ) 0.88 mm/s;66 (2,3) superparamagnetic
Fe3O468 and/or interfacial FexO/Fe3O4, which are hard to
distinguish; and (4) magnetic Fe3O4 phases.66 Relative contributions of the various phases to spectral absorption areas are
tabulated in Table 3. The results are in general agreement with
TEM and XRD data interpretation, also included in Table 3.
Percent areas can be translated to percent content of the various
oxide phases, assuming similar Mo¨ssbauer efficiency (recoilfree fraction) for all phases.
With increasing annealing temperature, the percentage contribution of magnetite increases. The spectra of samples 1 and
2 are dominated by paramagnetic FexO and superparamagnetic
Fe3O4, giving a collapsed, featureless absorption line. At this
expanded velocity range, the small quadrupole splittings associated with FexO (∼0.5 and 0.78 mm/s66) are not resolved.
Spectra of sample 3 show the onset of intermediate magnetic
relaxation effects, as the percentage of magnetite in the particles
increases. Finally, sample 4, obtained at the highest calcination
temperature used of 600 °C, contains large enough particles of
magnetite (of an average diameter of 18 nm according to TEM
measurements) to exhibit magnetic order at room temperature
for the larger particles in the particle size distribution. In addition
to superparamagnetic magnetite, the broad, collapsed central
absorption area may contain contributions from FexO inclusions
and interfacial iron exhibiting intermediate relaxation effects.
With decreasing temperature the frequency of spin fluctuations, due to thermal activation, is decreased to a spin relaxation
time longer than the characteristic measuring time for the
Mo¨ssbauer technique, τMo¨ss ) 10-8 s. This causes the spectra
to pass gradually from the collapsed superparamagnetic spectrum
observed at room temperature to a magnetically split spectrum
below 100 K (Supporting Information Figure 8a-d). The
process is governed by a spin relaxation time τ ) τ0 exp(KeffV/
kBT), for uniaxial magnetic anisotropy,69,70 where Keff is the
effective magnetic anisotropy density, V is the volume of the
particle, T is the temperature, kB is Boltzmann’s constant, and
τ0 is a constant characteristic of the material. The Mo¨ssbauer
blocking temperature,71 defined as the temperature where 50%
of the total spectral absorption area is due to six-lined magnetic
spectra, varied from TB ) 138 K for sample 2 to TB ) 190 K
for sample 4 (Table 4), due to variations in average particle
size, composition, and surface characteristics of the particles.
The blocking temperature is an effective measurement of the
superparamagnetic energy barrier, which is given by the product
of KeffV. With higher calcination temperatures one observes
larger average particle sizes due to sintering, and thus, higher
blocking temperatures. This trend is generally observed in Table
(68)
(69)
(70)
(71)
Mørup, S.; Topsøe, H.; Lipka, J. J. Phys. 1976, 37, C6.
Brown, W. F., Jr. Phys. ReV. 1963, 130, 1677.
Brown, W. F., Jr. J. Appl. Phys. 1968, 39, 993.
Papaefthymiou, G. C. MRS Proc. 1994, 332, 195.
14594 J. AM. CHEM. SOC.
9
VOL. 126, NO. 44, 2004
4, with the exception of sample 2 as compared to sample 1.
These two samples have the same average particle size of ∼7
nm diameter and fairly similar composition, and yet they exhibit
different blocking temperatures. This is attributed to different
surface characteristics of the particles. The as-prepared sample
1 consisted of particles coated with oleic acid, while the annealed
particles have a carbon coating, due to the transformation of
the surfactant upon annealing. It is well known that, in small
magnetic particles, surface and strain contributions to Keff
dominate, producing magnetic anisotropy densities 2 orders of
magnitude higher than the magnetocrystalline anisotropy of the
corresponding bulk material.72 Mo¨ssbauer blocking temperatures
of nanoparticulate magnetite have been observed to be very
sensitive to the exact nature of the surfactant or coating at the
particle surface.68
In the bulk, FexO undergoes a first-order magnetic phase
transition from a paramagnetic to an anti-ferromagnetic state
at ∼198 K. Magnetic features superimposed on the superparamagnetic envelope appeared in the Mo¨ssbauer spectra of the
as-prepared sample 1 below 200 K marking this magnetic phase
transition, as also observed in SQUID measurements. Superparamagnetism dominated the magnetic behavior of all four
samples down to about 100 K. Detailed analysis of the
superparamagnetic processes, collective magnetic excitations73
below TB, saturation magnetizations, and saturation internal
hyperfine magnetic fields observed will be presented in future
work.
Figure 8b compares the Mo¨ssbauer spectra obtained for the
four samples at T ) 4.2 K. Relatively sharp magnetic spectra
are observed. For sample 4, however, the magnetic structure is
superimposed on a broad, featureless absorption envelope. This
envelope cannot be attributed to superparamagnetic processes,
as at this temperature, far below the blocking temperature of
the sample, spin fluctuations are completely frozen relative to
the characteristic measuring time of the Mo¨ssbauer technique.
The broad envelope is attributed to the presence of a spin-glasslike, amorphous, FexO/Fe3O4 interfacial phase, as described
below. The solid lines over the experimental data points in
Figure 8b are the result of the superposition of four magnetic
subspectra associated with the Fe3+ and Fe2+ sites of the spinel
structure of ferrimagnetic Fe3O4, with Fe2+ sites of crystalline,
antiferromagnetic FexO and a glassy interfacial FexO/Fe3O4
phase (see caption of Figure 8c for color-coded contributions
of the various phases). The relative amounts of these phases
derived from spectral absorption areas, by assuming similar
recoil-free fractions for all phases, are tabulated in Table 4. This
crucial assumption of equal recoil-free fractions, which is needed
in order to translate Mo¨ssbauer spectral information to relative
contents of the various phases, is more reliable at 4.2 K than at
room temperature (300 K), because thermally activated lattice
vibrations are hindered at low temperature.
In Figure 8c we present again the 4.2 K Mo¨ssbauer spectrum
of sample 4. Above the experimental spectra, we present colorcoded Mo¨ssbauer signatures of individual subcomponent contributions. To the right, color-coded magnetic hyperfine field
distributions associated with each spectral signature are shown.
Spectral components in brown and green are associated with
the Fe3+ and Fe2+ sites of magnetite, respectively. The spectral
(72) Papaefthymiou, G. C. MRS Proc. 2000, 395, C2.4.1 and references therein.
(73) Mørup, S.; Topsøe, H. Appl. Phys. 1976, 11, 63.
Characterization of Nonstoichiometric Iron Oxides
ARTICLES
Table 5. Magnetic Data Correlated with X-ray Data
used particles (TEM)
Tannealing,a
time
phase
(crystal sizeb)
Hex/kOe
(cooling field/kOe)
mostly cubic NCs with a diagonal length of 14 nm and 12% SD
1
FexO (9 nm)
Fe3O4 (3 nm)
2
200 °C, 5 min
FexO (10 nm)
Fe3O4 (6 nm)
3
400 °C, 5 min
Fe3O4 (11 nm)
R-Fe (40 nm)
4
600 °C, 5 min
Fe3O4 (14 nm)
FexO (7 nm)
cubic NCs with a diagonal length of 12 nm and 8% SD
as synthesized
FexO (10 nm)
Fe3O4
after 4 weeks at RT
under nitrogen
150 °C
350 °C, 4 min
250 °C, 1 h, in air
Hc/kOe
(T)
Msc/emu g-1
(at field/kOe)
1.75
(50)
0.20
(50)
0
(50)
2.00
(10 K)
0.80
(10 K)
0.97
(10 K)
48
(50)
75
(70)
76
(70)
0
(50)
1.3
(10 K)
77
(70)
1.50
(10)
2.13
(20)
0.45
(10)
0.1
(10)
0.28
(5 K)
2.60
(5 K)
1.00
(10 K)
0.63
(10 K)
7 (10)
0
(10)
0.17
(5 K)
27
(50)
30
(20)
45
(20)
features
FC (50 Oe): maximum at
200 K (TN)
ZFC (50 Oe): max. at 200 K (TN),
FC (50 Oe): broad max. at 120 K
ZFC and FC (50 Oe): decrease in
magnetization between 120 and 100 K
(Verwey transition)
ZFC and FC (50 Oe): decrease in
magnetization between 120 and 100 K
(Verwey transition)
FC (50 Oe): maximum at 200 K (TN)
ZFC and FC (50 Oe): Tb at 270 K and
increase in magnetization between
125 and 90 K (TN)
particles are oxidized to maghemite,
Tb > 300 °C, broad max. in ZFC, FC
a All samples are annealed in a nitrogen atmosphere unless otherwise noted. b Calculated from line broadening in X-ray diffraction powder pattern. c Not
corrected for extraneous organic.
component in blue is associated with crystalline, antiferromagnetic FexO,74 and the severely broadened component in red is
associated with an interfacial FexO/Fe2O4 amorphous phase. The
very broad distribution in the magnitudes of internal magnetic
fields of the interfacial component indicates the presence of a
frustrated spin system, due to competing ferromagnetic and
antiferromagnetic interactions, producing a spin-glass-like phase.
The detailed characteristics of the glassy phase may depend
on the length of annealing time, cooling rate, and other
experimental conditions. For this sample, annealed at 600 °C
for only 5 min in order to avoid excessive particle-size growth,
the glassy component dominates, contributing about half of the
total absorption intensity. The calcination temperature of 600
°C is higher than 570 °C, above which FexO is stable. Thus,
magnetite is expected to be transformed to wu¨stite at this
temperature, in agreement with our conclusions in Table 4,
which indicate a much larger sum for the percent contributions
of FexO and spin-glass phase in sample 4, as compared to the
other three samples.
Magnetic Characterization. The magnetic properties of the
iron oxide nanocrystals were studied together with their corresponding annealed products. The results are summarized in
Table 5. Figure 9 displays ZFC and FC curves and hystereses
loops obtained from cubic 12 nm wu¨stite particles with a size
distribution of 8%. The ZFC of the as-synthesized material has
a maximum at 220 K, the FC at 205 K. These maxima appear
to mark the transition from paramagnetism to antiferromagnetism of wu¨stite, and correspond well with reported values.
This transition is also recognizable in the temperature dependence of coercivity: zero at 220 K and 80 Oe at 200 K, reaching
hyperbolically 285 Oe at 5 K (see Supporting Information Figure
9). The steady increase in coercivity of the wu¨stite particles
with decreasing temperature might be due to the pinning of
uncompensated surface spins, nonstoichiometry, or exchange
coupling of the FexO with incorporated seeds of magnetite in
(74) Shechter, H.; Hillman, P.; Ron, M. J. Appl. Phys. 1966, 37, 3043.
the initial material.75 Figure 9b was obtained after the wu¨stite
nanocrystals were annealed at 400 °C under nitrogen for 60
min. The heat treatment transfers the wu¨stite into a magnetiteR-Fe composite, while the iron is oxidized during the following
transfer into the SQUID. ZFC and FC show a maximum at about
270 K for the transition from ferrimagnetism to superparamagnetism. Two further kinks with inflection points at 120 K in
the ZFC and FC (see Figure 9b,j) could be attributed to the
Verwey transition. Despite the clear appearance of the transition
in ZFC and FC, the coercivity (Supporting Information Figures
9 and 10) is steadily increasing and does not display the reported
local minimum76 around the transition, which is assumed to be
due to shape anisotropy. The Verwey transition causes some
remarkable changes in properties, e.g., conductivity, magnetic
moment, or specific heat, and is directly related to the presence
of magnetite in these materials.77 The highest temperatures
(around 120 K) are obtained with synthetic magnetite under
involvement of sophisticated syntheses and crystallization
techniques, whereas the predicted influence of deviation from
the ideal stoichiometry seems to be less important in small
crystals between 30 and 50 nm.78
After oxidation of the cubic particles at 200 °C in oxygen
ZFC and FC curves, the magnetization increases toward a broad
maximum close to room temperature, exceeding our available
measurement range. The annealing conditions do not lead to
crystal growth but remove surfactant very efficiently. The
reduced spacing between the maghemite cubes allows stronger
magnetic dipole coupling, leading to a broad maximum shifted
to higher temperature.79,80 These measurements demonstrate how
wu¨stite crystals can be used to generate different magnetic
materials with distinct properties. The hystereses loops in Figure
(75) Dimitrov, D. V.; Hadjipanayis, G. C.; Papaefthymiou, V.; Simopoulos, A.
IEEE Trans. Magn. 1997, 33, 4363-4366.
(76) Zhou, Z.-J.; Yan, J.-J. J. Magn. Magn. Mater. 1992, 115, 87-98.
(77) Walz, F. J. Phys. Cond. Matter 2002, 14, R285-R340.
(78) Guigue-Millot, N.; Keller, N.; Perriat, P. Phys. ReV. B 2001, 64, 012402/
012401-012402/012404.
J. AM. CHEM. SOC.
9
VOL. 126, NO. 44, 2004 14595
Redl et al.
ARTICLES
9c-f show the magnetic response of material obtained by a
stepwise thermally induced transition from wu¨stite to magnetite.
Graph c shows the nearly linear response of the initially
generated wu¨stite to the external magnetic field at 5 K. The
linear response is typical for randomly oriented antiferromagnetic particles, the magnetic moments of which are pulled away
from the ideal orientation by the external magnetic field,
therefore leading to low magnetization.
The magnetic properties changed dramatically after the
sample was stored for 4 weeks under nitrogen and at room
temperature (Figure 9d). The magnetization (remnant and
saturation) has increased multifold. After field cooling, a shift
toward the opposite field is observed (Hex ) 2.1 kOe after field
cooling at 20 kOe). Annealing at higher temperatures (Figure
9f, 150 °C for 30 min; Figure 9g, 400 °C for 4 min) leads to an
increase in remnant and saturation magnetization, while the
coercivity and the shift are reduced (although the absolute
magnetization values presented are not corrected for extra
organic and therefore are noticeabley reduced in comparison
with bulk). These observations can be explained with the
transition from wu¨stite to magnetite and iron. Interfaces between
growing magnetite seeds in the wu¨stite matrix lead to exchange
coupling between the anti-ferromagnetic wu¨stite and the magnetite, which leads to increased coercivity and a reduced remnant
and saturation magnetization. SQUID measurements provide a
means to follow the disproportionation of the wu¨stite nanocrystals accurately. The measurements have shown that controlled annealing can be used to engineer material with distinct
magnetic properties ranging from anti-ferromagnetism to the
magnetic moment of magnetite.
Electronic Conduction in Iron-Based Nanocrystal Devices.
Electronic conduction in magnetic nanocrystal arrays is influenced by both the electrostatic energy for charging individual
grains and the relative orientation of nanocrystal magnetic
moments.33-35,81 Previous devices formed from monolayers or
multilayers of superparamagnetic hcp cobalt displayed negative
magnetoresistance at low temperatures (i.e., increased conductivity as the individual nanocrystal magnetizations were aligned
by an external magnetic field). Granular magnetite films78,82 or
sandwiched magnetite nanocrystals33,81 have also been studied
because of their half metallic properties and the metal-insulator
transition at the Verwey temperature. The complex nature of
the nanocrystals in this investigation makes them interesting
candidates for similar types of studies. As described above,
adjustment of nanoparticle composition is facilitated through
temperature- and time-dependent decomposition and therefore
allows simultaneous control over both the amount of conducting
material (iron and magnetite) and the magnetic properties.
The two-terminal nanocrystal devices used in this study were
constructed using a new technique which combines nanocrystal
self-assembly with conventional microfabrication. Previous
nanocrystal devices utilized self-assembly to close a 100 nm
gap between gold electrodes34,35 or utilized the LangmuirScha¨fer technique to form multilayers sandwiched between a
conducting substrate and a top electrode.33,81 In this case, device
fabrication begins by using optical lithography and reactive ion
etching to create holes of different sizes in an insulating SiO2
layer deposited on a conducting Pt film. The device processing
is depicted in Figure 10a. In the final device structure, the Pt
layer comprises a bottom electrode while the SiO2 film defines
the lateral device area (see the optical microscope image of the
wafer at this stage of fabrication in Figure 9a in the Supporting
Information) and shows a series of different shaped holes of
different sizes. The exposed Pt counter electrode appears light
colored in the image.
Nanocrystal multilayers were self-assembled onto the patterned wafer (see Figures 9b in the Supporting Information)
and annealed in a vacuum (450 °C, 1 h at 10-7 bar) prior to an
in situ electron-beam evaporation of an Al top electrode. Devices
were completed with a second lithography step and a wetchemical etch of the Al to provide device isolation. A schematic
cross section of the completed device is depicted in Figure 10b.
(79) Dai, J.; Wang, J.-Q.; Sangregorio, C.; Fang, J.; Carpenter, E.; Tang, J. J.
Appl. Phys. 2000, 87, 7397-7399.
(80) Zeng, H.; Sun, S.; Vedantam, T. S.; Liu, J. P.; Dai, Z.-R.; Wang, Z.-L.
Appl. Phys. Lett. 2002, 80, 2583-2585.
(81) Markovich, G.; Fried, T.; Poddar, P.; Sharoni, A.; Katz, D.; Wizansky, T.;
Millo, O. MRS Proc. 2003, 746, Q4.1.
(82) Tang, J.; Kai-Ying; Zhou, W. J. Appl. Phys. 2001, 89, 7690-7692.
Figure 9. SQUID measurements of cubic FexO nanocrystals with increasing
amount of incorporated magnetite. ZFC and FC (both cooled at 50 Oe) of
(a) as-synthesized nanocrystals (signal is scaled up by 1 order of magnitude
(compared with b); (b) after annealing at 400 °C under nitrogen for 60
min. Hystereses loops of (c) the originally obtained material. Hystereses
loops after field cooling of (d) the original material after storage for 4 weeks
under nitrogen at room temperature; (e) after annealing at 150 °C under
nitrogen for 30 min; (f) after annealing at 350 °C for 4 min. (No correction
for the weight of the organic surfactant was applied. From elemental analysis
the organic can be estimated to contribute about 30 wt %. Films were
produced by evaporation of solvent on a Si substrate.)
14596 J. AM. CHEM. SOC.
9
VOL. 126, NO. 44, 2004
Characterization of Nonstoichiometric Iron Oxides
ARTICLES
Figure 10. Schematic representation (a) of device fabrication and (b) of the device cross section. (c) SEM image of multilayers of the deposited FexO
nanoparticles covering a 0.3 µm gap of rectangular shape. Regions with hexagonal ordering are clearly visible.
This process allows parallel fabrication of many independent
devices on a single wafer. In these experiments, two different
types of devices were investigatedsdevices containing cubic
nanocrystals (11 nm edge length, 5% SD, see Figure 5a) and
14 nm faceted particles (12% SD, see SEM in Figure 10c). For
both types of device, there is neither aggregation of individual
nanoparticles nor crystal growth within the superlattices during
the 450 °C anneal, as confirmed by independent annealing
experiments and X-ray powder spectroscopy. The annealing
experiments also confirm that initial particles mainly composed
of FexO are completely transformed into magnetite and iron.
Completed devices containing cubic particles were unusable due
to either extremely high resistance (caused by too many
nanocrystal layers) or electronic short-circuits between top and
bottom electrode. A likely cause for this second type of failure
is the strong self-assembly tendency of cubic nanocrystals (see
Supporting Information, c and d). In contrast, devices formed
of 14 nm faceted particles form thin, hexagonally packed
multilayers which completely cover the Pt counter electrode
(Figure 10c).
The conductivity of all measured nanocrystal devices decreases strongly with decreasing temperature, as illustrated by
measurements of the zero-bias conductance (Gzero bias) of a 10
mm diameter device (Figure 11). Device conductivity was
measured using both a four-probe direct current measurement
(50 mV voltage bias) and a four-probe alternating current lockin technique (11 Hz, 500 mV excitation). The conductivity of
nanocrystal devices is governed by sequential electron tunneling
through the array, and at low bias electrons can only surmount
the significant electrostatic energy barrier (U) for tunneling
between nanocrystals via thermal fluctuations. In this example,
the dependence of Gzero bias on T falls somewhere between a
simple Arrhenius relationship (Gzero bias ∼ exp[-U/kBT], valid
for uniformly sized particles with a single activation energy U)
and a relationship appropriate for granular films with a broad
size distribution (Gzero bias ∼ exp[-(U*/kBT)-1/2], where U* is
related to the average activation energy in the system). This
observation seems reasonable in light of the nature of the
nanocrystals used in these devices (i.e., 12% SD). Such
intermediate situations between uniform and granular material
have been previously discussed using a simplified model,
assuming a normal distribution of particle sizes.33 To estimate
the activation energy in this system, the data of Figure 11a are
fitted with an Arrhenius form, from which an energy U ≈ 120
meV is calculated. This relatively high barrier is comparable
with the charging energy of particles with a diameter of 2 nm
arranged in a close-packed superlattice (nine nearest neighbors)
and particles separated from each other by 2 nm (governed by
interdigitating oleic acid molecules, oleic acid ≈ 2).34 As seen in
Figure 11a, the device conductance decreases continuously with
temperature, without any observable discontinuity at the Verwey
transition, even through this phase transition is easily detected
in ZFC or FC SQUID measurements (see Supporting Information Figure 10). The first-order Verwey phase transition in
nanoscale magnetite has been previously observed in conductivity measurements of both particle arrays or in single particles
(using scanning tunneling microscope) and by determination
of the magnetic moment.
Gtotal ∝
1
2Πσ2
[(
∫ exp -
J. AM. CHEM. SOC.
9
)
]
U - U0 2
U
dU
4σ
kBT
(1)
VOL. 126, NO. 44, 2004 14597
Redl et al.
ARTICLES
Figure 11d plots the mean resistance change between applied
fields of 0 and 1 T, for Vbias between -0.5 and 0.5 V (standard
deviations are indicated by error bars in the graph).
Two surprising results from our analysis of the temperatureand magnetic-field dependence of the conductivity of devices
formed of iron-based nanocrystals are the lack of an electronic
signature of the Verwey phase transition and the anomalously
high activation energy U for charge transport through the array.
One possible explanation, which is consistent with these
observations, is that the conductivity of the nanocrystalline
material is dominated by incorporated iron. According to the
previously discussed structural characterization of annealed
samples, we assume that annealing promotes an Fe/Fe3O4 core/
shell structure. A nanocrystal core of high-quality magnetite
will display a pronounced change in magnetization at the
Verwey transition temperature and will act to guide the
magnetization orientation of the surrounding Fe shell. The
tunneling rate for electrons moving between nanocrystals is not
influenced by the magnetization change of the Fe3O4 core at
the Verwey transition, but rather only by the magnetization of
the Fe shell. If the electronic states of the Fe shell and Fe3O4
core are sufficiently decoupled, this would also lead to an
increased activation energy U for electrons tunneling into Fe
shell states. Further experiments such as characterization of
nanocrystal devices annealed at different temperatures would
shed more light on why, in this case, we observe a clear Verwey
transition in nanocrystal magnetization but not magnetoresistance.
Conclusions
Figure 11. Plot of zero-bias conductivity, Gzero bias, vs (a) T -1 and (b)
T -1/2. (c) 300 K device resistance (50 mV bias) vs applied magnetic field.
(d) Mean change in device resistance for applied fields of 0 and 1 T. Device
magnetoresistance is unchanged for bias voltages up to Vbias ) 0.5 V.
As the applied magnetic field H is increased from zero, device
resistance drops sharply before slowing as H increases beyond
∼0.25 T. A typical example of the dependence of device
resistance on applied field (at 300 K and 50 mV bias) is shown
in Figure 11c. The position of the device resistance maximum
depends on the magnetic field sweep direction and correlates
well with the ZFC and FC coercivity (ca. 200 Oe) of similarly
annealed particles (see Supporting Information Figure 10). The
gap between ZFC and FC at 300 K is due to a blocking
temperature exceeding the measurement limit (at the longer
measurement time scale of the SQUID).
The maximum device resistance change between applied
fields of 0 and 1 T is 7% at 60 K and decreases monotonically
with increasing temperature, shrinking to 2% at 300 K (Figure
11d). This percentage decrease is of a magnitude which can be
understood in terms of increasing temperature-induced nanoparticle magnetic moment fluctuations. The smooth decrease
in magnetoresistance with increasing temperature gives no hint
of the Verwey phase transition in the nanocrystals comprising
the device. In contrast to previous observations of a strong
magnetoresistance decrease with increasing applied bias voltage,33,81 our devices show little change for Vbias up to 0.5 V.
14598 J. AM. CHEM. SOC.
9
VOL. 126, NO. 44, 2004
We have investigated the synthetic parameters that influence
the size, structure, and composition of iron oxide nanocrystals
prepared via iron salt and iron organometallic precursors. The
FexO/Fe3O4/Fe2O3 nanocrystal system proved to be a rich
resource from which to derive insight into the behavior and
reactivity of iron with oxygen, and the electronic and magnetic
properties that result. The preparation of pure wu¨stite nanocrystals by decomposition methods is complicated by the
metastable nature of wu¨stite. First, the disproportionation
promotes aggregation of the particles; second, nearly all the
investigated samples incorporate seeds of magnetite. Furthermore, the stability against oxidation of wu¨stite nanocrystals is
highly size-dependent. Particles smaller than 10 nm are easily
oxidized to magnetite or maghemite under ambient conditions.
The best synthetic results were obtained either with the
decomposition of iron(II) acetate or with a selective oxidation
method by decomposition of iron pentacarbonyl in the presence
of pyridine N-oxide. The oxidation and the product are hereby
dependent on the concentration of the oxidizer pyridine N-oxide
and surfactant oleic acid or lauric acid, which underlie a
preliminary acid-base equilibrium, probably determining the
free concentration of the oxidizer. This reaction is an example
of a controlled oxidation with means of an organic oxidizer in
nanoscale syntheses and yields cubic or spherical nanocrystals
of about 10-13 nm. Although the reported syntheses are not
able to deliver phase-pure wu¨stite, the product can be used as
a precursor for magnetite or maghemite particles. Furthermore,
the cubic sample readily assembles in three-dimensional superlattices, which can be directed and controlled by an external
magnetic field. The magnetic properties can be steadily changed
by controlled annealing or oxidation of the wu¨stite phase.
Characterization of Nonstoichiometric Iron Oxides
Intermediate composites display exchange coupling caused by
growing or diminishing interfaces between wu¨stite and magnetite. Superparamagnetism dominated the magnetic behavior
of all samples down to about 100 K. Thereafter, Mo¨ssbauer
spectroscopy gave insight into the behavior and relative
compositions of Fe2+ and Fe3+ in the different oxygen coordination environments. By measuring far below the blocking
temperature of the samples, spin fluctuations are completely
frozen relative to the characteristic measuring time of the
Mo¨ssbauer technique, and this permitted the observation of the
presence of a spin-glass-like, amorphous FexO/Fe3O4 interfacial
phase.
Iron oxide nanocrystal multilayers were self-assembled onto
a patterned wafer and, following device fabrication, the electronic conduction was measured. It was found that nanocrystal
core of high-quality magnetite will display a pronounced change
in magnetization at the Verwey transition temperature and will
act to guide the magnetization orientation of the surrounding
Fe shell. The tunneling rate for electrons moving between
nanocrystals is influenced not by the magnetization change of
the Fe3O4 core at the Verwey transition, but by the magnetization
of the Fe shell.
Acknowledgment. Our research team would like to thank
Dr. Ali Afzali (IBM, T.J. Watson Research Center) for DSC
and TGA measurements, and Dr. David R. Medeiros for the
ARTICLES
GC-MS measurements. This work was supported primarily by
the MRSEC Program of the National Science Foundation under
Award No. DMR-0213574 at Columbia University, in part by
the U.S. Department of Energy, Office of Basic Energy
Sciences, through the Catalysis Futures Grant DE-FG0203ER15463, and in part under the MRSEC NSF Award No.
DMR-0074537 at Villanova University. F.X.R. was supported
in part by the DARPA Metamaterials initiative under ONR
Contract No. N00014-01-C-0320.
Supporting Information Available: Discussion of the additional experimental parameters and size evolution of iron oxide
nanocrystals up to 40 nm; X-ray diffraction studies of composition and electron microscopy of individual and superlattices of
cubic nanocrystals; TEM and SAED images for wu¨ststite
particles in the size range 15-26 nm; FT-IR spectra of reaction
solutions; full temperature-dependent Mo¨ssbauer spectra of the
four investigated samples; coercivity vs temperature of 12 nm
cubic FeO nanocrystals; DSC curve of spherical 10 nm wu¨stite
nanocrystals; optical microscope images of substrate prepared
for conductivity measurements; and SQUID measurements (ZFC
and FC) of faceted FeO particle. This material is available free
of charge via the Internet at .
JA046808R
J. AM. CHEM. SOC.
9
VOL. 126, NO. 44, 2004 14599