Characterization, activity and kinetics of a visible light driven photocatalyst
Bạn đang xem bản rút gọn của tài liệu. Xem và tải ngay bản đầy đủ của tài liệu tại đây (807.32 KB, 7 trang )
Chemical Engineering Journal 157 (2010) 86–92
Contents lists available at ScienceDirect
Chemical Engineering Journal
journal homepage: www.elsevier.com/locate/cej
Characterization, activity and kinetics of a visible light driven photocatalyst:
Cerium and nitrogen co-doped TiO2 nanoparticles
Tao Yu a,∗ , Xin Tan a,b,∗ , Lin Zhao a , Yuxin Yin b , Peng Chen a , Jing Wei a
a
b
School of Environmental Science and Engineering, Tianjin University, No. 92, Weijin Road, Nankai District, Tianjin 300072, China
School of Chemical Engineering, Tianjin University, Tianjin 300072, China
a r t i c l e
i n f o
Article history:
Received 2 July 2009
Received in revised form 19 October 2009
Accepted 26 October 2009
Keywords:
TiO2
Cerium doping
Nitrogen doping
Photocatalyst
Visible light
a b s t r a c t
In order to effectively photocatalytically degrade azo dye under solar irradiation, anatase TiO2 that was
co-doped with cerium and nitrogen (Ti1−x Cex O1−y Ny ) nanoparticles (NPs) were synthesized using a onestep technique with a modified sol–gel process. The crystal structure and chemical properties were
characterized using XRD, BET and XPS. Oxynitride species, Ce4+ /Ce3+ pairs, and Ti–O–N and Ti–O–Ce
bonds were determined using XPS. The photocatalytic mechanism was investigated through methylene
blue (MB) photocatalytic degradation using various filtered wavelengths of light ( > 365 nm, > 420 nm,
> 500 nm, > 550 nm and > 600 nm) for a period of 10 h. Two experimental parameters were studied systematically, namely the atomic ratio of doped N to Ce and the irradiation wavelength number.
The photocatalytic degradation of MB over Ti1−x Cex O1−y Ny NPs in aqueous suspension was found to follow approximately first-order kinetics according to the Langmuir–Hinshelwood model. The enhanced
photocatalytic degradation was attributed to the increased number of photogenerated • OH radicals.
© 2009 Elsevier B.V. All rights reserved.
1. Introduction
Titanium dioxide has been applied as a promising environmentally friendly photocatalyst in many fields such as environmental
remediation, hydrogen production and solar energy utilization
[1–7]. Titanium dioxide is valued for its chemical stability, lack of
toxicity and low cost. Recently, there has been increasing interest
in the application of TiO2 nanoparticles (NPs) in the field of organic
and inorganic pollutant removal from wastewater. These practical
applications, however, have been limited by the large energy band
gap (3.2 eV), which can capture only less than 3% of the available
solar energy ( < 387 nm), as well as by the fast recombination of
photogenerated electron–hole (e− –h+ ) pairs, both on the surface
and in the core of TiO2 NPs. Photocatalysts that function in the
visible wavelengths (400 nm < < 800 nm) are desirable from the
viewpoint of solar energy utilization.
Many attempts have been made to enhance the utilization of
solar energy and to inhibit the recombination of photogenerated
e− –h+ pairs by doping the base photocatalyst with impurities. In
the past, transition metal ions and noble metal ions have been used
as dopants to broaden optical absorption in the visible light band for
practical applications [8,9]. Lanthanide (Ln)-doped TiO2 NPs have
been especially favored for their unique 4f electron configuration.
Among others, Ce-doped TiO2 NPs have attracted interest due to
∗ Corresponding author. Tel.: +86 22 27891291; fax: +86 22 27401819.
E-mail address: (T. Yu).
1385-8947/$ – see front matter © 2009 Elsevier B.V. All rights reserved.
doi:10.1016/j.cej.2009.10.051
their Ce3+ /Ce4+ redox couple, which results from the shift of cerium
oxide between CeO2 and Ce2 O3 under oxidizing and reducing conditions [10–13]. Lanthanide-doped photocatalysts, however, suffer
from utilization within the visible light spectrum [14,15]. Sato et
al. reported that NOx species can induce the band gap of TiO2 to
narrow greatly, which broadens its absorption spectra within the
visible light region. This research sparked a growing interest in
non-metal doping of TiO2 NPs [16–18]. Among the possibilities, Ndoped TiO2 exhibits significant photocatalytic activities in various
reactions under visible light [19–24]. Lattice oxygen atoms can be
replaced by doping non-metal elements and hence induce visible
light absorption by the modified TiO2 NPs. Nitrogen-doped TiO2
NPs, however, are limited by long-term instability, low reactivity
and low quantum efficiency [25]. In order to solve these problems,
many valuable efforts have been devoted to investigate the synthesis of TiO2 NPs co-doped with N and Ln elements. For example,
it was reported that nitrogen and lanthanum (La) co-doped TiO2
NPs show superior photocatalytic activity on the photocatalytic
degradation of methyl orange under visible light irradiation when
compared to only N-doped TiO2 or Ln-doped TiO2 [26–28].
In the work presented here, Ti1−x Cex O1−y Ny NPs were synthesized, and an aqueous solution of azo dye and methylene blue (MB)
was selected as a model pollutant to test photocatalytic activity
under various filtered wavelengths of light ( > 365 nm, > 420 nm,
> 500 nm, > 550 nm and > 600 nm). Two experimental parameters were studied, namely the atomic ratio of doped N to Ce and
the irradiation wavelength number. The possible mechanisms and
synergistic effects of co-doping N and Ce were discussed in detail.
T. Yu et al. / Chemical Engineering Journal 157 (2010) 86–92
2. Experimental
2.1. Materials
Titanium tetrabutoxide (Sigma–Aldrich, >97%) and cerium
nitrate hexahydrate (Sigma–Aldrich, >99%) were used as the starting materials. Urea (Sigma–Aldrich, >99%) was used as the source
of nitrogen. All reagents were used as received without any further
purification.
87
Table 1
Summary of SSA, XRD-determined average crystal size and BET-determined average
size of synthesized (A) BT NPs and Ti0.993 Ce0.007 O2−x Nx (x = (B) 0.0000, (C) 0.0058, (D)
0.0070, (E) 0.0089) NPs.
O% (at.%)
Ti% (at.%)
Ce (at.%)
x-Value
N% (at.%)
y-Value
BT
CeT
CeNT-1
CeNT-2
CeNT-3
53.6
23.1
0
57.1
24.19
0.71
56.4
24.61
0.69
51.6
21.77
0.70
52.6
20.68
0.72
0
0
0.52
0.70
0.89
2.2. Photocatalyst preparation
Bare TiO2 (denoted as BT) NPs and cerium and nitrogen codoped TiO2 (denoted as Ti1−x Cex O1−y Ny ) NPs were synthesized
using a one-step modified sol–gel technique. First, 8.5 ml titanium
tetrabutoxide was dissolved in 40 ml absolute ethanol and stirred
for 30 min to get a homogeneous solution. Cerium nitrate hexahydrate (0.021 g) and various amount of urea (1.0 g, 2.0 g and
3.0 g, respectively) were dissolved in a mixture of absolute ethanol
(20 ml) and double distilled water (2 ml). Then the mixture of
cerium nitrate hexahydrate with various amounts of urea was
dropped (30 drop/min) into the titanium tetrabutoxide solution
while stirring rapidly at room temperature. The resulting solution
was stirred continuously until a transparent gel formed. Then the
gel was put into a 70 ◦ C oven for 2 days to evaporate the ethanol,
which was followed by calcination at 550 ◦ C for 2 h in open air to
obtain the desired NPs. The values of x and y were determined by
XPS.
2.3. Characterization
X-ray diffraction analysis (XRD) with a CuKa ( = 1.5406 Å) radiation source over the scan range of 2Â between 10◦ and 90◦ , an
accelerating voltage of 18 kW and a current of 20 mA with a scan
speed of 0.5◦ /min and a 0.026◦ step size was employed to analyze
the phase state and crystal structure of the synthesized NPs. The
XRD patterns were obtained using a Smart Lab D/max 2500v/pc.
The average grain sizes were calculated using the Debye–Scherrer
formula. Specific surface area (SSA) of the synthesized NPs was
determined using the BET method (Micromeritics Tristar 3000) by
nitrogen adsorption at 77 K after degassing under flowing nitrogen
at 150 ◦ C for 3 h. X-ray photoelectron spectroscopy (XPS) conducted
using a PHI1600 ESCA system was employed to characterize the
chemical state of doped nitrogen and cerium atoms in the compounds as well as the other chemical ingredients of the synthesized
samples. In the XPS process, an AlKa X-ray beam was used in a vacuum chamber at 2 × 10⁻¹⁰ Torr. The depth of analysis was 20–50 Å.
evaluated with > 420 nm light using the same reaction system by
running the reaction for five cycles. The concentration of photocatalyst in suspension was kept at 1 g/L. At the end of every cycle, the
re-collected particles were washed several times using double distilled water till the residue solution was clear, and dried in a vacuum
drier for 48 h at room temperature. All photocatalytic experiments
were performed at room temperature. In order to demonstrate
the reproducibility of our experiments, all photocatalytic reactions
were repeated three times under identical conditions.
3. Results and discussion
3.1. Chemical state analysis
The XPS of synthesized BT and Ti1−x Cex O1−y Ny NPs is shown in
Figs. 2–5, the detailed Ti 2p XPS in Fig. 2, the detailed O 1s XPS in
Fig. 3, and the deconvoluted Ce 3d XPS, N 1s XPS in Figs. 4 and 5,
with the elemental percentage shown in Table 1.
The chemical composition of the as-prepared samples is shown
in Table 1, which illustrates that the composition of as-prepared
NPs was Ti and O, with a trace amount of cerium and nitrogen
dopant. In Table 1, we also determined the value of x to be 0.007,
and the values of y to be 0.0000, 0.0058, 0.0070 and 0.0089, corresponding to 0.0 g, 1.0 g, 2.0 g and 3.0 g urea which were added
into synthesis process, respectively. In order to simplify the names
of samples, we denoted them as Ti0.993 Ce0.007 O2−x Nx (x = 0.0000,
0.0058, 0.0070 and 0.0089) throughout this paper.
Fig. 1 shows that Ti 2p binding energy increased from 458.2 eV
for BT NPs to 458.5 eV for Ti0.993 Ce0.007 O2−x Nx (x = 0.0000) NPs and
458.7 eV for Ti0.993 Ce0.007 O2−x Nx (x = 0.0058, 0.0070 and 0.0089)
NPs, respectively. This indicates that the Ti elements mainly existed
as Ti4+ , and the fixation of doping Ce and N did not induce its
chemical shift. The chemical shift of Ti 2p binding energy was not
2.4. Photocatalytic activity measurement
An azo dye-MB aqueous solution with an initial concentration
of 15 mg/L was employed as the model reactant to test the photocatalytic activity of the synthesized BT NPs and the Ti1−x Cex O1−y Ny
NPs. In order to detect the effects of various wavelength number
for irradiation on the efficiency of MB photocatalytic degradation,
a 30-W fluorescent lamp with a long-pass optical filter was used
as the light source and five wavelengths ( > 365 nm, > 420 nm,
> 500 nm, > 550 nm and > 600 nm, respectively) were attained
by using different long wavelength filters with intensity adjusted
using a neutral density filter wheel. Then, 0.05 g of NPs was
suspended in 50 ml of MB aqueous solution. The photocatalytic
degradation of MB solute was followed by measuring its absorption in the range of 250–800 nm using a Varian Cary100 UV–vis
spectrometer and the corresponding residue concentration of the
MB solution was calculated using Lambert–Beer’s law. The stability of as-prepared particles for the degradation of MB solution was
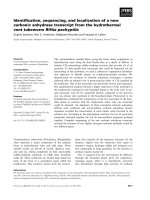
Fig. 1. (a) XRD patterns of (A) BT NPs and Ti0.993 Ce0.007 O2−x Nx (x = (B) 0.0000, (C)
0.0058, (D) 0.0070 and (E) 0.0089) NPs with varied amount of urea calcined at
550 ◦ C for 2 h in air, and (b) high resolution in the range of 23–28◦ of (A) BT NPs
and Ti0.993 Ce0.007 O2−x Nx (x = (B) 0.0000, (C) 0.0058, (D) 0.0070, (E) 0.0089) NPs with
varied amount of urea calcined at 550 ◦ C for 2 h in air.
88
T. Yu et al. / Chemical Engineering Journal 157 (2010) 86–92
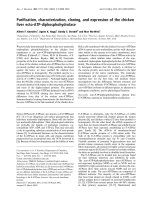
Fig. 2. Ti 2p XPS spectra with core level from 454 eV to 468 eV of synthesized (A) BT NPs and Ti0.993 Ce0.007 O2−x Nx (x = (B) 0.0000, (C) 0.0058, (D) 0.0070 and (E) 0.0089) NPs
with varied amount of urea calcined at 550 ◦ C for 2 h in air.
detected in any sample, which can be explained by the lack of reduction of the TiO2 valence state as investigated by Gole et al. [19].
Compared to XPS of bare TiO2 NPs, the 0.3 eV and 0.5 eV binding
energy differences were found in Ti0.993 Ce0.007 O2−x Nx (x = 0.0000)
NPs and Ti0.993 Ce0.007 O2−x Nx (x = 0.0058, 0.0070 and 0.0089) NPs,
respectively. The lower binding energy resulted from the increased
electron cloud density around Ti, which indicates that the atom
possessing lower electronegativity was introduced into the TiO2
crystal structure. It can also be further confirmed by the smaller
electronegativity of N (3.04 Pauling electronegativity scale) than O
(3.44 Pauling electronegativity scale).
In Fig. 2, the O 1s XPS spectrum shows a prominent peak at
530 eV, which was ascribed to the Ti–O bonds in TiO2 . From the
deconvoluted spectrum, a peak at around 531.7 eV was detected.
The oxygen species around this binding energy were first observed
in native oxide. Then, it was identified as a Ti–O–N bond in titanium or titanium suboxides by Saha and Hadand [23]. Recently,
the formation of oxynitride as investigated by Prokes et al. [29] has
been accepted. Based on the reported results, it was assigned to the
formation of oxynitride or Ti–O–Ce bond in this paper, because it
became stronger with increasing amount of doping nitrogen.
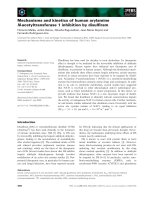
Fig. 3 shows the Ce 3d XPS spectrum of Ti0.993 Ce0.007 O2−x Nx
(x = 0.0000 and 0.0070) NPs. It was reported that Ce 3d spectra were assigned 3d 5/2 and 3d 3/2, two sets of spin orbital
multiples [30,31]. From Fig. 4, we can see that the peak shape
of Ce 3d XPS did not change after the incorporation of doping
nitrogen. The existence of the +4 oxidation state was dominant
in synthesized particles with a little +3 oxidation state giving
rise to several peaks around 910–900 eV in Ti0.993 Ce0.007 O2−x Nx
(x = 0.0000 and 0.0070) NPs, indicating the co-existence of Ce4+ and
Ce3+ in Ti0.993 Ce0.007 O2−x Nx (x = 0.0000 and 0.0070) NPs. The binding energy of the Ce 2p5/2 peak at around 885.8 eV indicates the
presence of CeO2 species, and the peaks in the range of 910–900 eV
were characterized by the presence of Ce2 O3 [28,30–35]. Because
the radii of Ce4+ (0.101 nm) and Ce3+ (0.111 nm) are both bigger
than Ti4+ (0.068 nm), it is difficult to dope them into a TiO2 crystal
lattice and substitute Ti4+ . Therefore, it was deduced that a Ce–O–Ti
bond formed at the interstitial sites or interfaces between CeO2
and TiO2 . Increased numbers of generated hydroxyl groups can
trap more photogenerated electrons due to an increased amount of
Ce2 O3 in Ti0.993 Ce0.007 O2−x Nx (x = 0.0070) NPs, which can be confirmed by the weaker electron configuration (5d 6s)0 4f2 O 2p4 ,
(5d 6s)0 4f1 O 2p5 and (5d 6s)0 4f0 O 2p6 than Ti0.993 Ce0.007 O2−x Nx
(x = 0.0000) NPs. Therein, electrons were trapped in Ce4+ /Ce3+ sites
effectively. And subsequently, the recombination photogenerated
electron–hole pairs were inhibited.
In Fig. 4, three core level peaks at 397.7 eV, 399.7 eV and 401.8 eV
were detected in as-prepared Ti0.993 Ce0.007 O2−x Nx (x = 0.0058,
0.0070 and 0.0089) NPs from their deconvoluted N 1s XPS spectrum. We selected Ti0.993 Ce0.007 O2−x Nx (x = 0.0070) NPs to conduct
the analysis here. It was clear that the element adjacent to nitrogen
directly influences its binding energy and the stronger the electronegativity of the adjacent element, the higher the binding energy
of nitrogen. In this paper, the first major peak at 397.7 eV was
attributed to substitutional N species in the Ti–O–N structure, due
to the fact that the binding energy was higher than that in N–Ti–N
(397.3 eV), and the corresponding Ti 2p core level at 459.2 eV was
significantly higher than that in TiN crystal (455.2 eV) [26]. When
an oxygen atom was substituted for the nitrogen atom in a TiO2
Fig. 3. O 1s XPS spectrum with the core level from 526 eV to 536 eV of synthesized
Ti0.993 Ce0.007 O2−x Nx (x = (a) 0.0000, (b) 0.0058, (c) 0.0070 and (d) 0.0089) NPs with
varied amount of urea calcined at 550 ◦ C for 2 h in air.
T. Yu et al. / Chemical Engineering Journal 157 (2010) 86–92
89
Fig. 4. Ce 3d deconvolution XPS spectrum with core level from 870 eV to 930 eV
of synthesized Ti0.993 Ce0.007 O2−x Nx (x = (a) 0.0000 and (b) 0.0070) NPs with varied
amount of urea calcined at 550 ◦ C for 2 h in air.
lattice, the electron density around N 1s could have been reduced
while that around Ti 2p increased, which then induced an increase
in N binding energy and a decrease in Ti 2p binding energy in
prepared NPs. The second peak at 399.5 eV was attributed to the
adsorbed NO or N species in Ti–N–O linkage [23]. The third peak at
401.8 eV was attributed to molecularly adsorbed N species on the
surface of the nitrogen modified titanium dioxide NPs [3,4], or the
formation of interstitial Ti–N bonding [26]. The latter was unlikely
in this present work because the nitrogen atoms in interstitial sites
existed in a higher oxidized state. For this reason, we assigned the
peak at 401.8 eV to molecularly adsorbed N species on the surface
of the particles. These nitrogen species can be desorbed at a low
temperature [22], or annealed away by heating the particles at temperature in excess of 550 ◦ C in vacuum [24]. It was likely that the
chemisorbed nitrogen did not contribute to catalytic activity.
3.2. Crystal structure analysis
XRD patterns of synthesized BT and Ti0.993 Ce0.007 O2−x Nx
(x = 0.0000, 0.0058, 0.0070 and 0.0089) NPs were shown in Fig. 5a
and b. A summary of SSA, crystalline structure and XRD-determined
average crystal size is shown in Table 2. Fig. 5a indicates that
the crystallinity was suppressed by the amount of doping with
cerium and nitrogen, and this trend was strengthened with the
doping amount increasing. Meanwhile, the growth of crystal size
of NPs was suppressed to different extent by the doping impurities, which can be ascribed to the segregation of the doping ions
at the grain boundary, in turn due to the bigger ionic radii of Ce3+
(0.111 nm) and Ce4+ (0.101 nm) than Ti4+ (0.068 nm), where it was
difficult for Ce3+ and Ce4+ to replace Ti4+ in the crystalline lattice.
No peaks other than anatase were detected in Fig. 1a, which confirmed that all doping cerium and nitrogen had been incorporated
into a TiO2 crystal structure. From Fig. 5b, we can see that the
width of anatase 1 0 1 crystal plane peak broadened as the nitrogen doping amount was increased. At the same time, the grain
Table 2
Elemental percentages determined by XPS of synthesized Ti1−x Cex O1−y Ny NPs.
Synthesized NPs
XRD analysis
a
Crystal size d (nm)
A
B
C
D
E
a
11.12
10.60
9.89
9.76
9.75
Calculated from anatase 1 0 1 crystal face.
BET analysis
Space (Å)
3.50
3.51
3.51
3.51
3.52
SSA (m2 /g)
71.24
90.79
85.32
83.42
88.01
Fig. 5. N 1s deconvolution XPS spectrum with core level from 397 eV to 402 eV of
synthesized Ti0.993 Ce0.007 O2−x Nx (x = 0.0070).
sizes of Ti0.993 Ce0.007 O2−x Nx (x = 0.0058, 0.0070 and 0.0089) NPs
were all smaller than Ti0.993 Ce0.007 O2−x Nx (x = 0.0000) NPs, which
is consistent with the results calculated by Scherrer’s formula. It
has been thought that doping nitrogen reduced the crystallization of anatase and retarded the transformation of amorphous
titanium dioxide to anatase, possibly due to the decomposition
of surplus urea in the mixture that might restrain the formation
and growth of the TiO2 crystal phase during the solid reaction process [13]. In Table 2, no distinct change of d space (d = 0.35 nm)
was observed in all experimental NPs, which demonstrates that
anatase crystal structure was still the predominant crystal phase.
All as-synthesized NPs with non-porous surface were confirmed
by adsorption–desorption isotherm (which is not shown here). In
Table 2, a larger SSA of Ti0.993 Ce0.007 O2−x Nx (x = 0.0058, 0.0070 and
0.0089) NPs was observed than the BT and Ti0.993 Ce0.007 O2−x Nx
(x = 0.0000) NPs, which can be attributed to the decreased particle
size resulting from the doping process.
3.3. Photocatalytic activities and mechanism analysis
The efficiency of photocatalytic degradation of MB aqueous
solution with various prepared NPs under visible light ( > 420 nm)
is shown in Fig. 6. In order to evaluate the photocatalytic activities of single doped particles and double doped particles, the
nitrogen-doped TiO2 (denoted as NT) NPs were also prepared here
using the same method as described in Section 2.2. The enhanced
photocatalytic activity of Ti0.993 Ce0.007 O2−x Nx (x = 0.0070) NPs was
attributed to the co-effect of doping with nitrogen and cerium
in as-prepared NPs. Doping with Ce ions served as the electron trap in the reaction because of their varied valences and
special 4f level [32,26,15]. Meanwhile, doping with nitrogen narrowed the band gap of Ti0.993 Ce0.007 O2−x Nx (x = 0.0058, 0.0070 and
90
T. Yu et al. / Chemical Engineering Journal 157 (2010) 86–92
Fig. 6. Efficiency of photocatalytic degradation of MB aqueous solution in the presence of prepared (A) BT NPs, Ti0.993 Ce0.007 O2−x Nx (x = (B) 0.0000, (C) 0.0058, (D)
0.0070, (E) 0.0089) NPs and (F) NT NPs under visible light ( > 420 nm).
0.0089) NPs to enhance their absorption within the visible light
region. The decreased photocatalytic activities were found with too
many doping impurities, such as Ti0.993 Ce0.007 O2−x Nx (x = 0.0089)
NPs, which can be explained by saying that overfull dopants
can act as recombination centers. In Fig. 6, synthesized cerium
and nitrogen co-doped TiO2 NPs (except for Ti0.993 Ce0.007 O2−x Nx
(x = 0.0058) NPs) exhibited a higher photocatalytic activity than BT
and Ti0.993 Ce0.007 O2−x Nx (x = 0.0000) NPs. It has been confirmed by
Turchi and Ollis [36] that the • OH radicals are the primary source
of oxidation in a photocatalytic system. When cerium was incorporated into a TiO2 crystal structure, a large numbers of • OH radicals
were generated due to the co-existence of Ce4+ /Ce3+ ion pairs, as
illustrated by the following equations [28]:
Ce4+ + e− → Ce3+
(1)
Ce3+ + O2 → O2 •− + Ce4+
(2)
h+ + H2 O → • OH + H+
(3)
O2
•−
+
+ 2H →
2• OH
(4)
• OH
These photogenerated
radicals had a positive effect on the
basis of organic reactant. It should be pointed out that bare TiO2
photocatalyst exhibits a significant removal of MB under visible
light (>420 nm) irradiation, which can be ascribed to adsorption of
reactant and slight dye self-sensitization. Moreover, it was reported
that MB can absorb visible light and photocatalytically degrade
itself to some extent. Therefore, the actual degradation efficiency
was calculated considering these factors and the MB solution without any photocatalyst being irradiated under fluorescent light and
visible light (>420 nm) for 6 h for comparison in this paper.
3.4. Kinetics of photocatalytic process analysis
Fig. 7 shows photocatalytic degradation of MB variations in
ln(Ct ) as a function of irradiation time and linear fitting curves of
Ti0.993 Ce0.007 O2−x Nx NPs. The summary of the first-order kinetics of
as-prepared NPs under visible light ( > 420 nm) within the initial
2 h is shown in Table 3.
From the experimental results showed in Fig. 6, it is plausible to
suggest that the reactions followed the first-order kinetics according to the Langmuir–Hinshelwood (LH) model within the initial 2 h.
The LH kinetic equation was mostly used to explain the kinetics of
the heterogeneous catalytic processes as given by:
r=−
dC
kr KC
=
1 + KC
dt
(5)
where r represents the rate of reaction that changes with time (t).
The rate expression based on LH expression can be reduced to first-
Fig. 7. Plots of photocatalytic degradation of MB variations in ln(Ct ) as a function of
irradiation time and linear fits of (A) BT NPs and Ti0.993 Ce0.007 O2−x Nx (x = (B) 0.0000,
(C) 0.0058, (D) 0.0070 and (E) 0.0089) NPs.
order kinetics when t = 0, C = C0 , it was described as follows:
− ln
C
C0
= kr t
(6)
where kr represents the apparent rate constant, C represents
the MB concentration in aqueous solution at any time t during
photocatalytic degradation, and t is reaction time. It was demonstrated that the current photocatalytic degradation process was
in good accordance with first-order kinetics resulting from the
linear correlation between ln(Ct ) and t. The apparent rate constant
k was found in the order of Ti0.993 Ce0.007 O1.993 N0.007 > Ti0.993
Ce0.007 O1.9911 N0.0089 > Ti0.993 Ce0.007 O1.9942 N0.0058 > Ti0.993 Ce0.007
O2.000 N0.000 > BT under visible light (>420 nm). It should be pointed
out that the first-order apparent rate constant was not proportional to the amount of doping cerium and nitrogen after it
reached 0.7 at.% Ce and 0.7 at.% N, which means that the optimal
doping percentage was found within the studied range, which is
consistent with the results shown in Fig. 6.
3.5. Effects of photocatalytic parameters analysis
Two experimental parameters were selected to investigate their
effects on MB photocatalytic degradation: the atomic ratio of doped
N to Ce and the irradiation wavelength number.
Fig. 8 shows the efficiency of photocatalytic degradation of
MB under various wavelengths of light ( > 365 nm, > 420 nm,
> 500 nm, > 550 nm and > 600 nm) in the presence of suspended Ti0.993 Ce0.007 O2−x Nx NPs for 6 h. It is well known that
the capacity of photogenerated electrons during the photocatalytic process mainly depends on the intensity of the incident
photons with matchable energy for irradiation. It was necessary
to the impact of wavelength number for irradiation on photocatalytic efficiency. Fig. 6 shows results of photocatalytic degradation
of MB versus various wavelength numbers for irradiation in the
presence of Ti0.993 Ce0.007 O2−x Nx NPs suspension for 6 h. Here,
Ti0.993 Ce0.007 O1.993 N0.007 NPs were selected as model photocatTable 3
Summary of the pseudo-first-order kinetics of various prepared NPs under visible
light ( > 420 nm) within the initial 2 h.
Sample ID
Fitted equation
R2
Rate
constant
BTNPs
Ti0.993 Ce0.007 O2.000 N0.0000 NPs
Ti0.993 Ce0.007 O1.9942 N0.0058 NPs
Ti0.993 Ce0.007 O1.993 N0.0070 NPs
Ti0.993 Ce0.007 O1.9911 N0.0089 NPs
y = 0.0026x + 0.7645
y = 0.0045x + 0.7781
y = 0.0035x + 0.7797
y = 0.0073x + 0.7806
y = 0.006x + 0.7715
0.9961
0.9945
0.9908
0.9948
0.9905
0.0026
0.0045
0.0035
0.0073
0.0060
T. Yu et al. / Chemical Engineering Journal 157 (2010) 86–92
Fig. 8. Plots of efficiency of photocatalytic degradation of MB versus various wavelength numbers for irradiation in the presence of Ti0.993 Ce0.007 O2−x Nx NPs suspension
for 6 h. Each point represents an average value of three or more separate experiments
and the vertical line represents the error associated with each reading expressed as
standard deviation.
alysts to carry out the following experiments due to their high
efficiency. As observed. in Fig. 8, a slightly decreased efficiency
was observed under > 365 nm light compared to the experimental results under > 420 nm light irradiation, which indicated that
the TiO2 NPs co-doping cerium and nitrogen acted as a visible
response semiconductor and the co-doped cerium and nitrogen
acted as a recombination center for the photogenerated carriers in the UV light spectrum. At wavelength numbers > 500 nm,
Ti0.993 Ce0.007 O1.993 N0.007 NPs still displayed notable activity relative to the experimental results under > 420 nm light irradiation
but differences in activity were muted at wavelengths > 550 nm
and > 600 nm, which resulted from the various extents of band
gap narrowed by the doping impurities.
Fig. 9 shows the relationship between the atomic ratio of doping N to Ce and the efficiency of photocatalytic degradation of MB
under visible light (>420 nm). In order to investigate the effects of
the atomic ratio of doping N to Ce on the efficiency of photocatalytic
degradation of MB, Ti0.993 Ce0.007 O2−x Nx (x = 0.0040 and 0.0110) NPs
were also prepared using the same method described in Section 2.2.
The experimental results in Fig. 7 clearly demonstrated that the
apparent rate strongly related to the atomic ratio of doping N to Ce.
It was accepted that the photoreaction was initiated by the photogenerated electron and hole pairs and the generation/separation of
photogenerated e− –h+ pairs, and the transformation of photons to
carriers, i.e., quantum efficiency, are all key factors in the photocat-
91
Fig. 10. Stabilities of as-prepared particles for the photocatalytic degradation of MB
aqueous solution under visible light ( > 420 nm) irradiation.
alytic process [37]. The initial reaction rate increased with increased
the dopants cerium and nitrogen amounts increasing first. And
then the degradation rate showed a maximum when the dopant
amount reached 0.7 at.% Ce and 0.7 at.% N. With further increases
in the dopant amounts, the decomposition rate decreased, which
can be ascribed to the formation of a recombination center of photogenerated e− –h+ pairs. It was explained for synthesized NPs, the
4f level plays an important role in interfacial charge transfer, and
cerium ions can act as an effective electron scavenger. Moreover,
the existence of Ce4+ /Ce3+ pairs created a charge imbalance, resulting in more hydroxide ions adsorbed on the surface. The adsorbed
hydroxide ions act as traps that inhibit recombination of photogenerated e− –h+ pairs as well. It should be pointed out that no distinct
changes in SSA or particle size were observed (Table 2) among these
as-synthesized particles, so the recombination of photogenerated
e− –h+ was assigned to the key factor for the decreased efficiency of
photocatalytic degradation of MB. So, the interfacial charge transfer being a determining-rate step for photocatalytic reaction was
determined in this paper.
3.6. Stability of photocatalyst
Fig. 10 shows the stability of the as-prepared photocatalyst for
MB solution degradation. Based on the results reported in Fig. 6,
we selected BT NPs, NT NPs, CT NPs and Ti0.993 Ce0.007 O1.993 N0.007
NPs as model photocatalysts to carry out the stability evaluation experiments. In addition, from Fig. 6, we can see that for
Ti0.993 Ce0.007 O1.993 N0.007 NPs, when the reaction was run over 3 h,
the MB can be decomposed completely, so we selected the initial
2 h as the reaction duration in the stability evaluation experiments.
It is evident from Fig. 10 that Ti0.993 Ce0.007 O1.993 N0.007 NPs are more
stable that BT NPs, NT NPs and CT NPs, while the similar stabilities
were found for the NT NPs and CT NPs. Overall, the results here
show a clear relationship between the types of synthesized NPs
and stability.
4. Conclusions
Fig. 9. Relationship between the atomic ratio of doping N to Ce in prepared
Ti0.993 Ce0.007 O2−x Nx and the efficiency of photocatalytic degradation of MB under
visible light (>420 nm) irradiation. Each point represents an average value of three
or more separate experiments and the vertical line represents the error associated
with each reading expressed as standard deviation.
Cerium and nitrogen co-doped anatase TiO2 NPs were successfully synthesized using a one-step technique with a modified
sol–gel process. The best experimental result for the photocatalytic degradation of a MB aqueous solution under visible light
( > 420 nm) was found with Ti0.993 Ce0.007 O2−x Nx (x = 0.0070) NPs,
which was confirmed by the reaction rate constant of first-order
kinetics calculated using the LH model. The interfacial charge transfer was determined to be a key step for photocatalytic reaction
in the current study. The synergistic effect of doping with cerium
92
T. Yu et al. / Chemical Engineering Journal 157 (2010) 86–92
and nitrogen together effectively inhibited the recombination of
photogenerated electrons and holes.
Acknowledgement
This project was financial supported by National Natural Science
Foundation of China (20776103).
References
[1] A. Fujishima, K. Honda, Electrochemical photolysis of water at a semiconductor
electrode, Nature 238 (1972) 37–38.
[2] B. O’Regan, M. Gratzel, A low cost high-efficiency solar cell based on dyesensitized colloidal TiO2 films, Nature (London) 353 (1991) 737–739.
[3] S. Sato, Photocatalytic activity of NOx -doped TiO2 in the visible light region,
Chem. Phys. Lett. 123 (1986) 126–128.
[4] R. Asahi, T. Ohwaki, K. Aoki, Y. Taga, Visible-light photocatalysis in nitrogendoped titanium oxides, Science 293 (2001) 269–271.
[5] A. Fujishima, T.N. Rao, D.A. Tryk, Titanium dioxide photocatalysis, J. Photochem.
Photobiol. C: Photochem. Rev. 1 (2000) 1–21.
[6] J.J. Xu, Y.H. Ao, D.G. Fu, Study on photocatalytic performance and degradation
kinetics of X-3B with lanthanide-modified titanium dioxide under solar and
UV illumination, J. Hazard. Mater. 164 (2009) 762–768.
[7] Z.G. Zou, J.H. Ye, H. Arakawa, Photocatalytic water splitting into H2 and/or O2
under UV and visible light irradiation with a semiconductor photocatalyst, Int.
J. Hydrogen Energy 28 (2003) 663–669.
[8] M.R. Hoffmann, S.T. Martin, W. Choi, D.W. Bahnemannt, Environmental applications of semiconductor photocatalysis, Chem. Rev. 95 (1995) 69–96.
[9] M.A. Fox, M.T. Dulay, Heterogeneous photocatalysis, Chem. Rev. 93 (1993) 341.
[10] F.B. Li, X.Z. Li, M.F. Hou, K.W. Cheah, W.C.H. Choy, Enhanced photocatalytic
activity of Ce3+ –TiO2 for 2-mercaptobenzothiazole degradation in aqueous suspension for odour control, Appl. Catal. A: Gen. 285 (2005) 181–189.
[11] N. Sasirekha, S. John, S. Basha, K. Shanthi, Photocatalytic performance of Ru
doped anatase mounted on silica for reduction of carbon dioxide, Appl. Catal.
B: Environ. 62 (2006) 169–180.
[12] K. Nagaveni, M.S. Hegde, G. Madras, Structure and photocatalytic activity of
Ti1−x Mx O2±␦ (M = W, V, Ce, Zr, Fe, and Cu) synthesized by solution combustion
method, J. Phys. Chem. B 108 (2004) 20204–20212.
[13] W.K. Jo, J.T. Kim, Application of visible-light photocatalysis with nitrogendoped or unmodified titanium dioxide for control of indoor-level volatile
organic compounds, J. Hazard. Mater. 164 (2009) 360–366.
[14] M.I. Litter, J.A. Navio, Photocatalytic properties of iron-doped titania semiconductors, J. Photochem. Photobiol. A: Chem. 98 (1996) 171–181.
[15] J.C.S. Wu, C.H. Chen, A visible-light response vanadium-doped titania nanocatalyst by sol–gel method, J. Photochem. Photobiol. A: Chem. 163 (2004) 509–515.
[16] P. Zabek, J. Eberl, H. Kisch, On the origin of visible light activity in carbonmodified titania, Photochem. Photobiol. Sci. 8 (2009) 264–269.
[17] W.Z. Yang, C. Chen, F.Q. Wu, Photodegradation of rhodamine B under visible light by bimetal codoped TiO2 nanocrystals, J. Hazard. Mater. 164 (2009)
615–620.
[18] Y. Izumi, T. Itoi, S. Peng, Structure and photocatalytic role of sulfur or nitrogendoped titanium oxide with uniform mesopores under visible light, J. Phys.
Chem. C 113 (2009) 6706–6718.
[19] J.L. Gole, D. John, C. Burda, Y.B. Lou, X.B. Chen, Highly efficient formation of
visible light tunable TiO2−x Nx photocatalysts and their transformation at the
nanoscale, J. Phys. Chem. B 108 (2004) 1230–1240.
[20] S. Sakthivel, M. Janczarek, H. Kisch, Visible light activity and photoelectrochemical properties of nitrogen-doped TiO2 , J. Phys. Chem. B 108 (2004)
19384–19387.
[21] H. Irie, Y. Watanabe, K. Hashimoto, Nitrogen-concentration dependence on
photocatalytic activity of TiO2−x Nx powders, J. Phys. Chem. B 107 (2003)
5483–5486.
[22] O. Diwald, T.L. Thompson, T. Zubkov, E.G. Goralski, S.D. Walck, J.T. Yates Jr.,
Photochemical activity of nitrogen-doped rutile TiO2 (1 1 0) in visible light, J.
Phys. Chem. B 108 (2004) 6004–6008.
[23] C.N. Saha, G.T. Hadand, Titanium nitride oxidation chemistry: an X-ray photoelectron spectroscopy study, J. Appl. Phys. 72 (1992) 3072–3079.
[24] E. Gyorgy, A.P. Pino, P. Serra, J.L. Morenza, Depth profiling characterisation of
the surface layer obtained by pulsed Nd:YAG laser irradiation of titanium in
nitrogen, Surf. Coat. Technol. 173 (2003) 265–270.
[25] D. Li, H. Haneda, S. Hishata, N. Ohashi, Synthesis by spray pyrolysis and surface
characterization, Chem. Mater. 17 (2005) 2588–2595.
[26] H. Wei, W. Wu, N. Lun, F. Zhao, Preparation and photocatalysis of TiO2 Nanoparticles co-doped with nitrogen and lanthanum, J. Mater. Sci. 4 (2004) 1305–
1308.
[27] Y. Sakatani, J. Nunoshige, H. Ando, K. Okusako, H. Koike, T. Takata, J.N. Kondo,
M. Hara, K. Domen, Photocatalytic decomposition of acetaldehyde under visible light irradiation over La3+ and N Co-doped TiO2 , Chem. Lett. 32 (2003)
1156–1157.
[28] C. Liu, X.H. Tang, C.H. Mo, Z.M. Qiang, Characterization and activity of visiblelight-driven TiO2 photocatalystcodoped with nitrogen and cerium, J. Solid State
Chem. 181 (2008) 913–919.
[29] S.M. Prokes, J.L. Gole, X.B. Chen, Defect-related optical behavior in surfacemodified TiO2 nanostructures, Adv. Funct. Mater. 15 (2005) 161–167.
[30] M.R. Benjaram, A. Khan, Y. Yamada, T. Kobayashi, S. Loridant, Structural characterization of CeO2 –TiO2 and V2 O5 /CeO2 –TiO2 Catalysts by Raman and XPS
techniques, J. Phys. Chem. B 107 (2008) 5162–5167.
[31] Z.L. Liu, B. Guo, L. Hong, H. Jiang, Preparation and characterization of cerium
oxide doped TiO2 nanoparticles, J. Phys. Chem. Solid 66 (2005) 161–167.
[32] W. Xu, Y. Gao, H.Q. Liu, The Preparation, Characterization, and their photocatalytic activities of rare-earth-doped TiO2 nanoparticles, J. Catal. 207 (2002)
151–157.
[33] K.T. Ranjit, I. Willner, S.H. Bossmann, A.M. Braun, Lanthanide oxide doped
titanium dioxide photocatalysts: effective photocatalysts for the enhanced
degradation of salicylic acid and t-cinnamic acid, J. Catal. 204 (2001) 305–
313.
[34] K.T. Ranjit, I. Willner, S.H. Bossmann, A.M. Braun, Lanthanide oxide-doped
titanium dioxide photocatalysts: novel photocatalysts for the enhanced
degradation of p-chlorophenoxyacetic acid, Environ. Sci. Technol. 35 (2001)
1544–1549.
[35] B.M. Reddy, A. Khan, Y. Yamada, T. Kobayashi, S. Loridant, J. Volta, Raman and
X-ray photoelectron spectroscopy study of CeO2 –ZrO2 and V2 O5 /CeO2 –ZrO2
catalysts, Langmuir 19 (2003) 3025–3030.
[36] C.S. Turchi, D.F. Ollis, Photocatalytic degradation of organic water contaminants: mechanism involving hydroxyl radical attack, J. Catal. 122 (1990)
178–192.
[37] X.G. Hou, F.H. Hao, B. Fan, X.N. Gu, X.Y. Wu, A.D. Liu, Modification of TiO2 photocatalytic films by V+ ion implantation, Nucl. Instrum. Method Phys. Res. B
243 (2006) 99–102.