Effective visible light active boron and carbon modified tio2 photocatalyst for
Bạn đang xem bản rút gọn của tài liệu. Xem và tải ngay bản đầy đủ của tài liệu tại đây (868.8 KB, 8 trang )
Applied Catalysis B: Environmental 97 (2010) 182–189
Contents lists available at ScienceDirect
Applied Catalysis B: Environmental
journal homepage: www.elsevier.com/locate/apcatb
Effective visible light-active boron and carbon modified TiO2 photocatalyst for
degradation of organic pollutant
Yongmei Wu a , Mingyang Xing a , Jinlong Zhang a,b,∗ , Feng Chen a
a
b
Key Laboratory for Advanced Materials and Institute of Fine Chemicals, East China University of Science and Technology, 130 Meilong Road, Shanghai 200237, PR China
School of Chemistry and Materials Science, Guizhou Normal University, Guiyang 550001, PR China
a r t i c l e
i n f o
Article history:
Received 21 December 2009
Received in revised form 28 March 2010
Accepted 29 March 2010
Available online 4 April 2010
Keywords:
C and B modification
Titanium dioxide
Visible light photocatalytic activity
Photocatalyst
a b s t r a c t
A visible light-active TiO2 photocatalyst modified by boron and carbon was synthesized by sol–gel followed solvothermal process. The resulting photocatalyst was characterized by X-ray diffraction (XRD),
X-ray photoelectron spectroscopy (XPS), UV–vis absorption spectroscopy, and electron paramagnetic
resonance (EPR). It was found that the boron and carbon modified TiO2 showed obvious absorption in
the range 400–500 nm. XPS results suggested boron species entered into interstitial site of TiO2 matrix
and formed the B–O–Ti bond, while carbon species were in the form of carbonates species. EPR results
showed the existence of oxygen vacancy in carbon and boron modified TiO2 . This may result in the sensitivity of the as-synthesized photocatalyst to visible light. The resulting boron and carbon modified TiO2
exhibited significantly higher photocatalytic activity than carbon modified TiO2 and undoped anatase
TiO2 on the degradation of Acid Orange 7 (AO7) in aqueous solution under visible light irradiation. The
presence of carbon originating from organic precursor has great influence on the surface properties of
B-doped TiO2 .
© 2010 Elsevier B.V. All rights reserved.
1. Introduction
Semiconductor photocatalytic materials have been extensively
studied in the fields of environmental purification. In this application, titanium dioxide is most widely used, because it has
advantages in inexpensiveness, chemical stability, and nontoxicity
in addition to its favorable optoelectronic property [1,2]. However, its wide band gap (3.0–3.2 eV) allows it to absorb only the
ultraviolet light which accounts for merely 5% of the solar photons, thereby hampering its wide use. In order to utilize the solar
energy efficiently, many studies have been carried out to extend
the spectral response of TiO2 into the visible region and enhance
its photocatalytic activity. Recently, a promising way to achieve the
visible light activity of TiO2 is doping TiO2 with a non-metal element, such as N [3–5], C [6–8], S [9], P [10], and halogen atoms [11].
More recently, boron doping begins to attract attention in electrochemical and functional materials application studies because it is
prompting the creation of electron acceptor level [12–21]. However, controversial reports are found in the literature on B-doped
TiO2 . On the basis of DFT calculations, Geng et al. [12] reported
∗ Corresponding author at: Lab for Advanced Materials and Institute of Fine Chemicals, East China University of Science and Technology, Shanghai 200237, PR China.
Tel.: +86 21 64252062; fax: +86 21 64252062.
E-mail address: (J. Zhang).
0926-3373/$ – see front matter © 2010 Elsevier B.V. All rights reserved.
doi:10.1016/j.apcatb.2010.03.038
that boron atoms can be doped into TiO2 either in the interstitial position or at the O site and the O substitution would lead
to narrowing of the bandgap. Contrary to the above mentioned
reports, Chen et al. [13] reported that doped boron ion was situated in the interstitial TiO2 structure, forming a possible chemical
environment such as Ti–O–B resulting in blue-shift of the absorption edge of insterstitial B-doped TiO2 compared to undoped TiO2 .
This B-doped TiO2 photocatalyst showed higher activity than pure
TiO2 sample in the photocatalytic reaction of nicotinamide adenine dinucleotide (NADH) under UV light irradiation. Jung et al. [14]
also reported a blue-shift of the light absorption in B-doped TiO2
when the boron content is less than 5%. On the other hand Yang
et al. suggested a red-shift of the absorption edge in substitutional
B- to O-doped anatase and blue-shift of absorption in interstitial
B-doped anatase [15]. Moon et al. [16] synthesized B-doped TiO2
using sol–gel method and boric acid triethyl ester as boron source
and the B/TiO2 photocatalyst showed a red-shift in the absorption
edge and enhanced photocatalytic activity towards decomposition
of water under UV light. Zhao et al. [17] reported that doping TiO2
with boron and Ni2 O3 resulted in the improvement of TiO2 in both
visible light response and photocatalytic efficiency. Lambert and
co-workers [18] also reported low level of boron doped TiO2 lead
to significant absorption of visible light and better photoactivity for
degradation of methyl tert-butyl ether (MTBE) than undoped TiO2 .
Zaleska et al. synthesized boron modified TiO2 using boric acid and
boric acid triethyl ester (BATE) by the sol–gel method and by grind-
Y. Wu et al. / Applied Catalysis B: Environmental 97 (2010) 182–189
ing anatase powder with boron dopant. They acclaimed that boron
doping extended absorption edge to visible light region leading to
induced activity on the prepared samples on the photooxidation
of phenol under visible light instead of under UV light compared
to pure TiO2 [19,20]. The highest photoactivity was observed over
the sample obtained by impregnation with 2 wt.% of BATE and calcined at 400 ◦ C. Not only boron species were observed in the B-TiO2
samples but also carbon species arising from incomplete precursor
decomposition were also observed. They proposed that visible light
activity of the B-doped sample can be rather related to the presence of boron than carbon. Gombac et al. [21] synthesized B-doped
TiO2 and B–N-codoped TiO2 photocatalysts by sol–gel followed by
calcination process at high temperatures. A blue-shift of absorption edge for B doped TiO2 was observed with respect to pure
anatase and rutile, which was attributed to its lower nanocrystal dimension. Interestingly, even calcination at 450 ◦ C for 6 h, this
B-doped photocatalyst containing carbon was confirmed by XPS,
which gave a peak located at 286.0 eV related to C–O originating
from the organic titanium precursor. It is should be noted that there
is some confusion in the assignment of the carbon species in the
reported works. It is evident that existence of the carbon in the
synthesized TiO2 is unavoidable due to the organic solvents and
the alkoxide groups in the Ti source. As a result, the carbon element is always detected in nearly all the XPS analysis. However,
their assignment is rather diverse. In most cases, these C species
were ascribed to adventitious carbon which is not responsible for
visible response of the photocatalyst [19–21]. Some researchers
claimed that these C species could be incorporated into the lattice
to replace O and endow the TiO2 with visible light activity [22–25].
For example, Kisch and co-workers [22] have proved that carboncontaining titania, prepared by a modified sol–gel process using
different titanium alkoxide precursors, was able to photodegrade
p-chlorophenol under visible light ( > 400 nm). Colón et al. found
the presence of carbon species in TiO2 samples after calcination at
973 K, which showed a broad spectrum of 400–600 nm, it was proposed that carbon residuals were responsible for the formation of
oxygen vacancies in the TiO2 specimens which could lead to visible
light absorption [23]. Yang et al. [24] argued that alkoxide groups
of titanium source can also be used as a C source during the sol–gel
synthesis of C–N codoped TiO2 . Choi and co-workers reported that
carbon-doped TiO2 prepared from a conventional sol–gel synthesis
using titanium alkoxide precursor without adding external carbon
precursors and they claimed that the carbons species from titanium
alkoxide precursor could be incorporated into the lattice of TiO2 by
a controlled calcination at temperature ranging from 200 to 300 ◦ C
[25]. In our previous study, C and N co-doped TiO2 synthesized by a
microemulsion-hydrothemal process without calcinations exhibited better photoactivity for degradation of Rhodamine B under
visible light than P25, the carbon species originated from titanium
alkoxide could be doped into the lattice of TiO2 [26]. This shows that
the effect of carbon species originating from organic compound on
the properties of TiO2 as well as its photocatalytic performance
under visible light cannot be ignored. It was found that B and N
codoped TiO2 [21,27], B and F codoped TiO2 [28] showed higher
photocatalytic activity and peculiar characteristics compared with
single element doping into TiO2 . However, to our best knowledge,
carbon and boron comodified TiO2 using sol–gel process followed
with solvothermal method under moderate conditions has not yet
been reported.
Here we prepared boron and carbon modified TiO2 by sol–gel
followed by solvothermal process. The photoactivity of B and C
comodified TiO2 was evaluated by the photodegradation of Acid
orange 7 (AO7) under visible light irradiation. We have found that
the presence of carbon species originating from organic precursor
has great influence on the surface properties of B-doped TiO2 as
well as its photocatalytic performance.
183
2. Experimental
2.1. Catalyst preparation
The boron and carbon modified TiO2 nanoparticles were prepared by combining sol–gel method followed with solvothermal
treatment. 6 mL tetrabutyl titanate was dissolved into 17 mL anhydrous ethanol (solution A), solution B consisted of 35 mL anhydrous
ethanol, 0.1 mL concentrated nitric acid (68%), 1.6 mL water and the
required stoichiometric amount H3 BO3 . Then solution A was added
drop-wise to solution B under magnetic stirring. The resultant mixture was stirred at room temperature for 4 h until the transparent
sol was obtained. The sol was then aged for two days and the gel
was obtained, which was then transferred into a 100 mL Tefloninner-liner stainless steel autoclave. The autoclave was kept for
10 h under 180 ◦ C for crystallization. After this solvothermal treatment, the precipitate gained was washed by distilled water, dried
at 100 ◦ C for 24 h and calcined at 300 ◦ C for 2 h. The boron doping concentration (x) was chosen as 0.5, 1.0, 2.0, 5.0, which was
the mole percentage of boron element in the theoretical titania
powder. The obtained photocatalysts with corresponding boron
concentration were denoted as xB–C–TiO2 . The carbon modified
TiO2 sample was also prepared by the same method in the absence
of H3 BO3 , denoted as C–TiO2 . Commercial pure anatase TiO2 (produced by Shanghai Kangyi Co., Ltd.) with specific surface area of
120 m2 /g and primary particle size of 10 nm were used for comparison purpose. In order to check the effect of carbon, 1.0B–C–TiO2 was
calcined at 300 ◦ C for 2 h under static air, air flow (100 ml/min) and
N2 flow (100 ml/min), respectively and the samples were denoted
as 1.0B–C–TiO2 -1, 1.0B–C–TiO2 -2, 1.0B–C–TiO2 -3.
2.2. Catalyst characterization
XRD analysis of the as-prepared photocatalysts was carried out
at room temperature with a Rigaku D/max 2550 VB/PC apparatus
using Cu K␣ radiation ( = 1.5406 Å) and a graphite monochromator, operated at 40 kV and 30 mA. Diffraction patterns were
recorded in the angular range of 10–80◦ with a stepwidth of
0.02◦ s−1 . The X-band EPR spectra were recorded at room temperature (Varian E-112). To analyze the light absorption of the
photocatalysts, UV–vis absorption spectra were obtained using a
scan UV–vis spectrophotometer (Varian Cary 500) equipped with
an integrating sphere assembly, while BaSO4 was used as a reference. To investigate the chemical states of the photocatalysts, X-ray
photoelectron spectroscopy (XPS) was recorded with PerkinElmer
PHI 5000C ESCA System with Al K␣ radiation operated at 250 W.
The shift of binding energy due to relative surface charging was
corrected using the C 1s level at 284.6 eV as an internal standard.
The content of carbon in the sample was determined by DTA–TG
on a PerkinElmer Pyris Diamond Setaram instrument from room
temperature to 800 ◦ C at a constant rate of 10 ◦ C min−1 under air
with a flow rate of 50 mL min−1 .
2.3. Photocatalytic activity test
The photocatalytic activities of samples were evaluated in terms
of the degradation of acid orange 7 (AO7) under visible light illumination. The photocatalyst powder (0.08 g) was dispersed in a
100 mL quartz photoreactor containing 80 mL of a 20 mg L−1 AO7
solution. The mixture was sonicated for 10 min and stirred for
30 min in the dark in order to reach the adsorption–desorption
equilibrium. A 1000 W tungsten halogen lamp equipped with a UV
cut-off filters ( > 420 nm) was used as a visible light source (the
average light intensity was 60 mW cm−2 ). The lamp was cooled
with flowing water in a quartz cylindrical jacket around the lamp,
and ambient temperature was maintained during the photocat-
184
Y. Wu et al. / Applied Catalysis B: Environmental 97 (2010) 182–189
Table 1
Lattice parameters of C–TiO2 with different B doping.
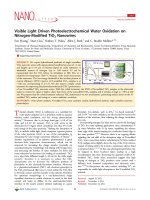
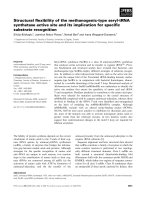
Fig. 1. XRD patterns of samples with different amount of B: (a) C–TiO2 , (b)
0.5B–C–TiO2 , (c) 1.0B–C–TiO2 , (d) 2.0B–C–TiO2 , and (e) 5.0B–C–TiO2 .
alytic reaction. At the given time intervals, the analytical samples
were taken from the mixture and immediately centrifuged, then
filtered through a 0.22 m Millipore filter to remove photocatalysts. The concentration of the filtrate was analyzed by checking the
absorbance at 484 nm with a UV–vis spectrophotometer (Varian).
The reproducibility was checked by repeating the measurements at
least three times and was found to be within the acceptable limit
(±5%).
• OH radicals generated on the photocatalysts surface under visible light irradiation were investigated using a Varian cary eclipse
fluorescence spectrophotometer. About 0.10 g of the photocatalyst was added to 30 ml of terephthalic acid solution with a
concentration of 0.83 g/L. The • OH radicals generated by means
of visible light irradiation reacted with terephthalic acid to produce high fluorescence hydroxyterephthalic acid. The amount of
2-hydroxyterephthalic acid corresponded to the amount of • OH
radicals [29]. The 2-hydroxyterephthalic acid is the only product
with any significant fluorescence. The shapes of the spectra characteristic to the reaction product and wavelength of maximum
emission were the same, whereas only the intensities of these spectra were changed. To determine the amount of • OH radicals, the
peak areas were calculated.
3. Results and discussion
3.1. XRD analysis
XRD was carried out to investigate the changes of C–TiO2 phase
structure after boron doping. Fig. 1 shows the effect of different
amount of B dopant on the crystal structure of C–TiO2 nanoparticles calcined at 300 ◦ C for 2 h. It is found that all diffraction peaks can
be perfectly indexed as anatase phase of TiO2 [JCPDS no. 21-1272,
spacegroup: I41 /amd (1 4 1)]. No significant characteristic peaks for
boron oxide were detected. It may be attributed to the lower boron
content in these samples beyond the detection limit of XRD technique. According to the line width analysis of the anatase (1 0 1)
diffraction peak based on the Scherrer formula, the average crystalline sizes of all these samples estimated by Scherrer formula are
summarized in Table 1. As can be seen from Table 1, the crystallite sizes of boron and carbon modified TiO2 are slightly lower than
that of C modified TiO2 , which indicates the occurrence of a slight
lattice distortion in the structure of anatase TiO2 .
To further investigate the effect of boron doping on the crystal structure of C–TiO2 , the lattice parameters of all boron doping
samples calculated using Bragg’s law (2d sin  = ) and a formula
(1/d2 = (h2 + k2 )/a2 + l2 /c2 ) for a tetragonal system are listed in
Table 1. It is clearly seen that the lattice parameter of a-axis for all
boron doping samples is unchanged with increase in the amount
Sample
Crystalline size (nm)
C–TiO2
0.5B–C–TiO2
1.0B–C–TiO2
2.0-C–TiO2
5.0-C–TiO2
13.0
12.9
12.7
12.4
11.0
Lattice parameter
a-Axis
c-Axis
3.7856
3.7869
3.7875
3.7853
3.7887
9.4975
9.4992
9.5071
9.5127
9.4777
C concent wt.%
0.8
1.4
1.5
0.9
1.0
of boron dopant. As amount of boron doping ranges from 0.5%
to 2.0%, the lattice parameter of c-axis increases, indicating that
boron ions may have entered into interstitial site of C–TiO2 matrix
leading to swell of unit cell volume. Considering the radius of B3+
(0.023 nm) and Ti4+ (0.064 nm), it is difficult for B3+ to substitute
of Ti4+ . DFT calculation for B-doped TiO2 by some groups showed
that B atom can be doped into TiO2 either in the insterstitial position or at the O site [12,15]. The similar experimental phenomenon
was also observed by Chen et al. [13]. However, the c-axis parameter of 5.0B–C–TiO2 decreases, which implies that some boron ions
may separate from the lattice of TiO2 and form diboron trioxide, the
amount of diboron trioxide is minute, hence below the detection
limit of XRD technique.
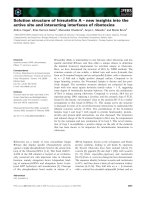
Fig. 2 shows the effect of calcinations temperature on the phase
structure of 5.0B–C–TiO2 . Only anatase phase was observed with
the calcination temperatures increasing from 300 to 700 ◦ C, while
with respect to C–TiO2 sample, rutile phase appeared when the calcinations temperature was reached 700 ◦ C (not shown). Our results
suggest that doping with B suppressed the phase transformation of
anatase to rutile, which is in agreement with literature proposal
[13].
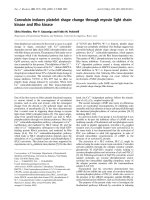
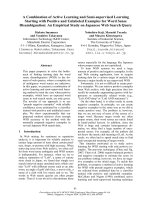
3.2. TG–DTA analysis
TG–DTA spectra of uncalcined 1.0B–C–TiO2 under air atmosphere and under N2 atmosphere are shown in Fig. 3. It can be
seen that the profiles of the two DTA curves at T < 400 ◦ C are quite
different. 1.0B–C–TiO2 in air shows a single peak at ca. 280 ◦ C and
a shoulder peak at 310 ◦ C. The first one is due to the removal of
strongly bound water or surface hydroxyl. The second one can be
attributed to decomposition of organic compound. This is an indication that some carbon species exists in the as-prepared sample
when calcined at 300 ◦ C under air atmosphere. However, only a
broad peak at 150 ◦ C was observed in the sample of 1.0B–C–TiO2
under nitrogen atmosphere, which is due to the loss of physically
Fig. 2. XRD patterns of 5.0B–C–TiO2 sample under different calcination temperature: (a) 300, (b) 400, (c) 500, (d) 600, and (e) 700 ◦ C.
Y. Wu et al. / Applied Catalysis B: Environmental 97 (2010) 182–189
185
Fig. 3. TG–DTA spectra of uncalcined 1.0B–C–TiO2 (A) at air atmosphere (B) at N2 atmosphere.
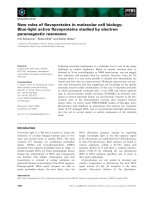
Fig. 4. XPS spectra of C–TiO2 and 1.0B–C–TiO2 of (A) Ti 2p (B) B 1s.
adsorbed water. Strongly bound water or surface hydroxyl ions
in the sample are slowly being eliminated with the rise of temperature from 100 to 300 ◦ C. Thermogravimetric analysis (TG) is
used to estimate the carbon content in the sample. Taking the mass
loss of pure TiO2 as a reference, the carbon content can be calculated to be 1.5, 0.5 and 3.0 wt.% for 1.0B–C–TiO2 -1, 1.0B–C–TiO2 -2
and 1.0B–C–TiO2 -3, respectively. Clearly, the carbon content in the
1.0B–C–TiO2 samples calcined under nitrogen atmosphere is higher
than that of sample with treatment under air atmosphere. Additionally, the C content in the samples with different boron doping
are summarized in Table 1. It can be seen that the carbon content in
C–TiO2 sample is about 0.8 wt.%. When the boron doping into TiO2 ,
the C content in these sample is keep ranging from 0.9 to 1.5 wt.%.
Significant variation of carbon content with increasing amount of
boron dopant is not observed due to these carbon species coming
from organic precursor.
3.3. XPS analysis
Ti 2p XPS spectra of C–TiO2 and 1.0B–C–TiO2 samples are shown
in Fig. 4(A) The binding energies of Ti 2p3/2 and Ti 2p1/2 for C–TiO2
sample is at 458.6 and 464.3 eV, which agree with Ti(IV) in titanium
oxide [30]. Compared to C–TiO2 sample, Ti 2p peaks show positive
shift of 0.2 eV for 1.0B–C–TiO2 sample. It was reported that boron
doping favor the formation of Ti3+ on the surface or subsurface layer
of TiO2 [31]. But in our XPS result there is no evidence of Ti3+ formation. This may be attributed to low amounts of Ti3+ which could
not be detected by XPS technique. For 1.0B–C–TiO2 sample, the
B 1s appears at the binding energy of 191.5 eV (Fig. 4(B)). Based
on XPS results, the B concentrations were 0.72% (atom ration).
Peaks at 187.5 eV corresponding to B–Ti bond in TiB2 and peak
at 193.0 eV corresponding B-O from B2 O3 were not found in our
sample. As reported by Lambert and co-workers [18], low binding
energy peak at 190.6 eV corresponds to species capable of inducing
the unprecedented visible light photocatalytic activity of B-doped
TiO2 . However, this peak did not appear in the B 1s spectra either.
Chen et al. [13] and Huo et al. [32] suggested that the peak at
191.5 eV may be assigned to B atom in the interstitial position of
TiO2 and formation of B–O–Ti bond. Therefore, we assume that the
peak at 191.5 eV corresponds to B atoms in the interstitial position
of TiO2 and formation of B–O–Ti bond.
C1s XPS spectra of C–TiO2 , 1.0B–C–TiO2 -1 and 1.0B–C–TiO2 -3
samples are shown in Fig. 5. There are two XPS peaks at 284.6 and
288.3–288.5 eV observed among these samples which could be the
contribution of two states of carbon species. The lower binding
energy at 284.6 eV is associated with the adventitious elemental
carbon [33,34]. Another peak at 288.5 eV suggests the existence of
C–O, indicating the formation of carbonated species [6,23]. Kisch
and co-worker suggested that this peak should be related to the
carbonate species as an interstitial dopant [6,23]. Ren et al. [35]
and Li et al. [8] proposed that carbon may substitute some of the
lattice titanium atoms and form a Ti–O–C structure. The origin of
visible light absorption of carbon modified TiO2 is mostly ascribed
to interstitial carbon doping. We agree with Kisch’s opinion, this
peak can be an interstitial doping carbon species. Some reports have
also confirmed that carbon species originating from the organic
titanium precursor could be doped into the TiO2 [22,24,25].
3.4. UV–vis absorption spectra
Fig. 6(A) shows the UV–vis absorption spectra of C–TiO2 and
C–B–TiO2 samples compared with commercial pure anatase TiO2.
186
Y. Wu et al. / Applied Catalysis B: Environmental 97 (2010) 182–189
with two excess electrons, which would further reduce two Ti4+
ions to form Ti3+ . So we assume that B doping may lead to increased
formation of oxygen vacancies and thus slightly improving the visible photoabsorption capability.
Fig. 7(A) and (B) shows the UV–vis absorption spectra of
1.0B–C–TiO2 at calcinations under different gas atmosphere. It can
be seen that the band gap energy of 1.0B–C–TiO2 under air flow,
static air and nitrogen flow are 2.95, 2.85 and 2.73 eV, respectively.
Obviously, the decrease of band gap energy is related to the carbon content. Kisch et al. also reported that the optical properties of
carbon modified TiO2 are related to carbon content [6].
3.5. EPR spectra analysis
Fig. 5. C1s XPS spectra of C–TiO2 and 1.0B–C–TiO2 sample calcined in static air and
N2 flow
The band gap energies were determined from a plot (˛h )1/2 versus photon energy(h ) using the following equation which shows
indirect relationship of the absorption coefficient ˛ and band gap
Eg . [36]
(˛h )
1/2
∞h − Eg
where is the frequency and h is Planck’s constant. The Tauc plot,
(˛h )1/2 versus h , is shown in Fig. 6(B). The pure anatase TiO2 has
the band gap energy of 3.08 eV. The band gap for C–TiO2 sample
is about 2.92 eV, which is smaller than that of pure anatase TiO2 .
In the case of 1.0B–C–TiO2 and 5.0B–C–TiO2 , they have the same
band gap energy of 2.85 eV indicating that low level of B doping
has no significant influence on Eg probably due to the formation
new phase of B2 O3 . Similar results have been obtained by Huo
et al. [32]. The origin of absorption bands in the visible spectral
range for anion doped TiO2 specimens remains a hot topic of discussion. Some researchers reported that anion modification in titania
increases visible light absorption by introducing localized states in
the band gap [9,37], while some of studies revealed that intrinsic
defects, including those defects associated with oxygen vacancies,
contribute to the absorption of light in the visible spectral region
[38,39]. A recent study by Kuznetsov and Serpone has proposed
that the commonality in all these anion doped titania rests with
formation of oxygen vacancies and the advent of color centers that
absorb the visible light radiation [40]. Ke and co-workers [41] have
proposed that boron doping favors formation of an oxygen vacancy
EPR spectra of C–TiO2 and 1.0B–C–TiO2 samples calcined in
static air and N2 flow recorded at ambient temperature are shown
in Fig. 8. The symmetric signal at g = 2.004 was detected in C–TiO2
and 1.0B–C–TiO2 samples calcined in static air and N2 flow. Nakamura et al. [42] reported that the symmetrical and sharp EPR signal
at g = 2.004 detected on plasma-treated TiO2 arose from the electron trapped on the oxygen vacancy. Serwicka [43] observed a sharp
signal at g = 2.003 on the vacuum-reduced TiO2 at 673–773 K. They
attributed this signal to a bulk defect, probably an electron trapped
on an oxygen vacancy. Similar EPR signal has been observed in Cdoped anatase TiO2 [8,21,44] and B-doped TiO2 [31]. Li et al. [8]
also reported that the used carbon-doped titania still had a strong
EPR signal at g = 2.0055 after use in photocatalytic test. Interestingly, similar signal (g = 2.004) was also found in N-doped TiO2
by Feng et al. [45]. Serpone and co-workers assigned the signal at
g = 2.003–2.005 to the one electron trapped on the oxygen vacancy
or referred to as an F center vacancy [40]. It was reported that
the F center vacancy located below the band conduction edge of
TiO2 results in the reduced TiOx and anion doped TiO2 photocatalyst to be responsive to visible light [40]. It can be seen that the
intensity of this signal for 1.0B–C–TiO2 sample became stronger
after introducing boron species. This result suggests that B doping
favors the formation of oxygen vacancy. Compared to 1.0B–C–TiO2
sample calcined in static air, 1.0B–C–TiO2 samples calcined in N2
flow shows stronger intensity, implying that much more F center
vacancy are produced and this is related to the content of carbon.
Feng et al. also observed the visible light photoactivity increase in
N doped TiO2 with the intensity of the major peak at g = 2.004 from
which it was deduced that the F defects were formed in a well crystallized TiO2 surface layer [45]. Another broad signal of g = 2.146
for 1.0B–C–TiO2 samples calcined in N2 flow may be attributed
to photo-generated hole trapped species [44]. So it is reasonable
to assume that F center vacancy actually exist in the C–TiO2 and
B, C modified TiO2 and the existence of oxygen vacancy results in
the sensitivity of the as-synthesized photocatalyst to visible light.
Fig. 6. (A) Diffuse reflectance spectra of C–TiO2 with different B doping and (B) plot of transformed Kubelka–Munk function versus the energy of the light absorbed.
Y. Wu et al. / Applied Catalysis B: Environmental 97 (2010) 182–189
187
Fig. 7. (A) Diffuse reflectance spectra of C–TiO2 calcined under different gas atmosphere and (B) plot of transformed Kubelka–Munk function versus the energy of the light
absorbed.
Additionally, the content of carbon has an important role in the
formation of F center vacancy as well as photocatalytic activity.
3.6. Photocatalytic activity
Fig. 9 shows the dependence of photocatalytic degradation of
AO7 under visible light irradiation on pure anatase TiO2 , C–TiO2
and B and C modified TiO2 . The degradation rate of AO7 on the
pure anatase TiO2 under visible light irradiation is very low, which
can be attributed to the self-sensitization of AO7. Obviously, the
photocatalytic activity of C–TiO2 is superior to that of pure TiO2 for
the degradation of AO7. Besides the self-sensitization of AO7, the
carbonate species on the surface of C–TiO2 cause the absorption
edge extension to visible light range and thus play an important
role in improving visible light photoactivity. When a small amount
of B atoms were introduced into C–TiO2 powders, the visible lightinduced photocatalytic activities of the prepared samples were
enhanced. At 1.0% B dopant, the photocatalytic activity of B and
C modified TiO2 sample reached a maximum value, and its activity
exceeded that of pure anatase TiO2 by a factor of more than three.
With further increase of the amount of B dopant, the photocatalytic
activity of the sample decreased, indicating that excess amount of
boron would become the recombination centers of the photoinduced electrons and holes, which is detrimental to photocatalytic
reactions.
Fig. 8. EPR spectra of C–TiO2 and 1.0B–C–TiO2 samples calcined in static air and N2
flow.
The higher photocatalytic activity of boron and carbon modified TiO2 here observed may be attributed to the following reasons.
On the one hand, both boron and carbon modifications lead to a
narrower band gap than C–TiO2 , as discussed previously, which
benefits the generation of more photo-induced electrons and holes
to participate in the reaction. On the other hand, B doping compared to C doping could improve the amount of oxygen vacancies
which is confirmed by EPR result. The existence of these oxygen
vacancies in the photocatalyst would act as electron trapping centers, which would avoid the recombination process leaving holes
free to proceed to the surface and participate in the photocatalytic
process by a mechanism involving direct or indirect oxidation by
holes, leading to the enhanced quantum efficiency [46,47]. Gombac
and co-workers suggested that B-doping creates reduced Ti3+ centers and fivefold coordinated Ti3+ ions associated with the presence
of oxygen vacancies at the surface were able to reduce molecular oxygen to reactive superoxide species [31]. According to Di
Valentin’s DFT calculation, they proposed that boron in interstitial
positions could behave as a three-electron donor with formation
of B3+ and reduction of Ti4+ to Ti3+ , which favors the formation
of oxygen vacancies [48]. Our experimental result demonstrated
that B doping favors the formation of amount of oxygen vacancies that facilitate the separation and transfer of charge carriers,
thereby promoting the photocatalytic activity. Therefore, the synergic contributions from the enhanced absorption in the visible
light region and the improved quantum efficiency result in the
enhanced vis-photocatalytic activities for boron and carbon modified TiO2 photocatalysts.
Fig. 10 shows the dependence of photocatalytic degradation
of AO7 under visible light irradiation on 1.0B–C–TiO2 calcined
Fig. 9. AO7 degradation under visible light illumination for 5 h in the presence of
C–TiO2 with different boron doping, pure anatase TiO2 .
188
Y. Wu et al. / Applied Catalysis B: Environmental 97 (2010) 182–189
are produced in the 1.0B–C–TiO2 calcined under N2 flow hence can
serve as color centers (F vacancy center) and make it more active
under visible light. Therefore these oxygen vacancies are not only
beneficial for the production of more free • OH radicals, but also
effectively restrain the recombination of electrons and holes, thus
enhancing the photoactivities. Some reports on carbon modified
TiO2 have confirmed that carbon doping could improve the ability for • OH radicals generation [49,52]. Therefore, it is reasonable
to conclude that the presence of carbon originating from organic
precursor has great influence on the surface properties of TiO2 .
4. Conclusions
Fig. 10. AO7 degradation under visible light illumination for 5 h in the presence of
1.0B–C–TiO2 calcined under different gas atmosphere.
The boron and carbon modified TiO2 was prepared by sol–gel
followed solvothermal process. The doping of boron could efficiently inhibit the grain growth and suppress the anatase to rutile
transformation. The presence of boron and carbon favors the formation of oxygen vacancies and the advent of color centers that absorb
the visible light radiation. All boron and carbon modified TiO2
showed increased photoactivity over that pure anatase TiO2 and
carbon modified TiO2 in the photodegradation of AO7 under visible
light illumination. This is due to more oxygen vacancies induced by
B and C modification which could capture photo-induced electrons
and thus inhibit their recombination with photo-induced holes,
leading to the enhanced quantum efficiency. Moreover, boron and
carbon modified TiO2 calcined under N2 atmosphere exhibited
higher photoactivity owning to good visible absorption ability and
highest amount of • OH radicals created. Therefore, the presence of
carbon originating from organic precursor has great influence on
the surface properties of B and C modified TiO2 .
Acknowledgments
Fig. 11. Plots of the induced fluorescence peak area at 426 nm against irradiation
time for terephthalic acid on 1.0B–C–TiO2 calcined under different gas atmosphere
(a) 1.0B–C–TiO2 -2, (b) 1.0B–C–TiO2 -1, (c) 1.0B–C–TiO2 -3.
under different gas atmosphere. 1.0B–C–TiO2 calcined under N2
flow exhibits the highest photoactivity among these samples, indicating that higher concentration of carbon would produce both
visible light absorption and high photocatalytic efficiency. It was
suggested that carbon modification would affect the surface property of TiO2 such as • OH generation under UV or visible light
irradiation [49]. The analysis of • OH radical’s formation on the
surface of sample under visible light irradiation was performed
by fluorescence technique using terephthalic acid, which readily
reacted with • OH radicals to produce highly fluorescent product,
2-hydroxyterephthalic acid. The intensity of the peak attributed
to 2-hydroxyterephtalic acid is proportional to the amount of • OH
radicals formed [50].
In Fig. 11 the formation of • OH radicals on the surface of
1.0B–C–TiO2 under calcinations under different gas atmosphere is
shown with time of visible light irradiation. The amount of the produced • OH radicals increases with visible irradiation time. It can be
seen that 1.0B–C–TiO2 calcined under air flow produce less amount
of • OH radicals than 1.0B–C–TiO2 calcined under N2 flow and static
air. Meanwhile, the highest amount of OH radicals was created in
the 1.0B–C–TiO2 calcined under N2 flow, which showed the highest
photoactivity amongst these three kinds of photocatalysts. It was
reported that • OH radicals play important roles in the liquid phase
of photodegradation of organic pollutants [51]. Generally, the presence of surface oxygen deficiencies can act as capture centers for the
photoexcited electrons, and then transfer the electrons to adsorbed
molecular oxygen to produce superoxide O2 − . This superoxide O2 −
radicals react with proton forming H2 O2 , which can produce free
• OH radicals [51]. Our EPR result shows that more oxygen vacancies
This work has been supported by National Nature Science Foundation of China (20773039, 20977030), National
Basic Research Program of China (973 Program, 2007CB613301,
2010CB732306) and the Ministry of Science and Technology of
China (2006AA06Z379, 2006DFA52710).
References
[1] A. Fujishima, T.N. Rao, D.A. Tryk, J. Photochem. Photobiol. C 1 (2000) 1–21.
[2] M.R. Hoffmann, S.T. Martin, W. Choi, D.W. Bahnemann, Chem. Rev. 95 (1995)
69–96.
[3] R. Asashi, T. Morikawa, T. Ohwakl, K. Aoki, Y. Taga, Science 293 (2001) 269–271.
[4] C. Burda, Y. Lou, X. Chen, A.C. Samia, J. Stout, J.L. Gole, Nano Lett. 3 (2003)
1049–1051.
[5] Y. Cong, J.L. Zhang, F. Chen, M. Anpo, D. He, J. Phys. Chem. C 111 (2007)
10618–10623.
[6] S. Sakthivel, H. Kisch, Angew. Chem. Int. Ed. 42 (2003) 4908–4911.
[7] C. Xu, R. Killmeyer, M.L. Gray, S.U.M. Khan, Appl. Catal. B: Environ. 64 (2006)
312–317.
[8] Y. Li, D.S. Hwang, N.H. Lee, S.J. Kim, Chem. Phys. Lett. 404 (2005) 25–29.
[9] H. Luo, T. Takata, Y. Lee, J. Zhao, K. Domen, Y. Yan, Chem. Mater. 16 (2004)
846–849.
[10] L. Lin, W. Lin, J.L. Xie, Y.X. Zhu, B.Y. Zhao, Y.C. Xie, Appl. Catal. B: Environ. 75
(2007) 52–58.
[11] D. Li, H. Haneda, S. Hishita, N. Ohashi, Chem. Mater. 17 (2005) 2588–2595.
[12] H. Geng, S. Yin, X. Yang, Z. Shuai, B. Liu, J. Phys.: Condens. Mater. 18 (2006)
87–96.
[13] D. Chen, D. Yang, Q. Wang, Z. Jiang, Ind. Eng. Chem. Res. 45 (2006) 4110–4116.
[14] Y. Jung, S.B. Park, S.K. Ihm, Appl. Catal. B: Environ. 51 (2004) 239–245.
[15] K. Yang, Y. Dai, B. Huang, Phys. Rev. B 195 (2007) 109201–109206.
[16] S.C. Moon, H. Mametsuka, S. Tabata, E. Suzuki, Catal. Today 58 (2000) 125–132.
[17] W. Zhao, W. Ma, C. Chen, J. Zhao, Z. Shuai, J. Am. Chem. Soc. 126 (2004)
4782–4783.
[18] S. In, A. Orlov, R. Berg, F. García, S.P. Jimenez, M.S. Tikhov, D.S. Wright, R.M.
Lambert, J. Am. Chem. Soc. 129 (2007) 13790–13791.
[19] A. Zaleska, J.W. Sobczak, E. Grabowska, J. Hupka, Appl. Catal. B: Environ. 78
(2008) 92–100.
[20] A. Zaleska, E. Grabowska, J.W. Sobczak, M. Gazda, J. Hupka, Appl. Catal. B: Environ. 89 (2009) 469–475.
Y. Wu et al. / Applied Catalysis B: Environmental 97 (2010) 182–189
[21] V. Gombac, L.D. Rogatis, A. Gasparotto, G. Vicario, T. Montini, D. Barreca, G. Balducci, P. Fornasiero, E. Tondello, M. Graziani, Chem. Phys. 339 (2007) 111–123.
[22] C. Lettmann, K. Hildenbrand, H. Kisch, W. Macyk, W.F. Maier, Appl. Catal. B:
Environ. 32 (2001) 215–227.
[23] G. Colón, M.C. Hidalgo, G. Munuera, I. Ferino, M.G. Cutrufello, J.A. Navío, Appl.
Catal. B: Environ. 63 (2006) 45–59.
[24] X. Yang, C. Cao, L. Erickson, K. Hohn, R. Maghirang, K. Klabunde, J. Catal. 260
(2008) 128–133.
[25] Y. Park, W. Kim, H. Park, T. Tachikawa, T. Majima, W. Choi, Appl. Catal. B:
Environ. 91 (2009) 355–361.
[26] Y. Cong, F. Chen, J.L. Zhang, M. Anpo, Chem. Lett. 35 (2006) 800–801.
[27] G. Liu, Y.N. Zhao, C.H. Sun, F. Li, G.Q. Lu, H.M. Cheng, Angew. Chem. Int. Ed. 47
(2008) 4516–4520.
[28] E.A. Reyes-Garcia, Y. Sun, D. Raftery, J. Phys. Chem. C 111 (2007) 17146.
[29] K. Ishibashi, A. Fujishima, T. Watanabe, K. Hashimoto, J. Photochem. Photobiol.
A: Chem. 134 (2000) 139–142.
[30] J.F. Zhu, F. Chen, J.L. Zhang, H.J. Chen, M. Anpo, J. Mol. Catal. A: Chem. 216 (2004)
35–43.
[31] M. Fittipaldi, V. Gombac, T. Montini, P. Fornasiero, M. Graziani, Inorg. Chim.
Acta 361 (2008) 3980–3987.
[32] Y. Huo, X. Zhang, Y. Jin, J. Zhu, H. Li, Appl. Catal. B: Environ. 83 (2008) 78–84.
[33] S.Y. Treschev, P.W. Chou, Y.H. Tseng, J.B. Wang, E.V. Perevedentseva, C.L. Cheng,
Appl. Catal. B: Environ. 79 (2008) 8–16.
[34] E. Papirer, R. Lacroix, J.B. Donnet, G. Nanse, P. Fioux, Carbon 33 (1995) 63–72.
189
[35] W. Ren, Z. Ai, F. Jia, L. Zhang, X. Fan, Z. Zou, Appl. Catal. B: Environ. 69 (2007)
138–144.
[36] J. Tauc, Mater. Res. Bull. 5 (1970) 721–729.
[37] X. Chen, C. Burda, J. Am. Chem. Soc. 130 (2008) 5018–5019.
[38] V.N. Kuznetsov, N. Serpone, J. Phys. Chem. B 110 (2006) 25203–25209.
[39] N. Serpone, J. Phys. Chem. B 110 (2006) 24287–24293.
[40] V.N. Kuznetsov, N. Serpone, J. Phys. Chem. C 113 (2009) 15110–15123.
[41] N.O. Gopal, H.H. Lo, S.C. Ke, J. Am. Chem. Soc. 130 (2008) 2760–2761.
[42] I. Nakamura, N. Negishi, S. Kutsuna, T. Ihara, S. Sugihara, K. Takeuchi, J. Mol.
Catal. A: Chem. 161 (2000) 205–212.
[43] E. Serwicka, Colloids Surf. 13 (1985) 287–293.
[44] E.A.R. Garcia, Y. Sun, K.R.R. Gil, D. Raftery, Solid State Nucl. Mag. Reson. 35 (2009)
74–81.
[45] C. Feng, Y. Wang, Z. Jin, J. Zhang, S. Zhang, Z. Wu, Z. Zhang, New J. Chem. 32
(2008) 1038–1046.
[46] Z. Lin, A. Orlov, R.M. Lambert, M.C. Payne, J. Phys. Chem. B 109 (2005)
20948–20952.
[47] C. Di Valentin, G. Pacchioni, A. Selloni, Phys. Rev. Lett. 97 (2006)
166803–166804.
[48] E. Finazzi, C. Di Valentin, G. Pacchioni, J. Phys. Chem. C 113 (2009) 220–228.
[49] M. Janus, E. Kusiak, A.W. Morawski, Catal. Lett. 131 (2009) 506–511.
[50] T. Hirakawa, Y. Nosaka, Langmuir 18 (2002) 3247–3254.
[51] A. Fujishima, X. Zhang, D.A. Tyrk, Surf. Sci. Rep. 63 (2008) 515–582.
[52] Q. Xiao, L. Ouyang, Chem. Eng. J. 148 (2009) 248–253.