VẬT lý địa CHẤN intruduction geophysics
Bạn đang xem bản rút gọn của tài liệu. Xem và tải ngay bản đầy đủ của tài liệu tại đây (1.51 MB, 24 trang )
Introduction to Geophysics
What is Geophysics??
Goals
•
To make you aware and capable of implementing/discussing as many
geophysical techniques as possible
–
Radar Interferometry
–
Isostasy
–
Earthquakes
–
Gravity
–
Magnetism
–
Paleomagnetism
–
Bathymetry
–
GPS
–
Seismic Refraction
–
Time series analysis
–
Seismic Reflection
–
Heat Flow
–
Down-hole logging
–
Vertical seismic profiles (VSP)
–
Geophysical analysis of rock samples
Geophysics at the Coarsest Scale
• What techniques do we have to look at a region at the coarsest scale?
– Satellite imagery – ie Landsat, SPOT
– Satellite altimetry
– Satellite gravity
– Satellite magnetism
– DEMs
• Digital elevation models
– DEMs from space – SRTM
• Shuttle radar topography mission
Some Gravity Basics
•
We will cover gravity in more detail later in the class – but for now
here are the important concepts:
Newton’s Law of Gravitation states that the force of attraction F
between two masses m1 and m2 whose dimensions are small with
respect to the distance r between them is given by the equation below,
where G is the Gravitational Constant (6.67x10⁻¹¹ m3kg-1s-2).
Gm1m2
F=
r2
r
m1
m2
Some Gravity Basics
For the case of a mass above the earth we can re-write the previous equation
using M as the mass of the Earth, m as the mass of the object, and R as the
distance between the centers of the objects
GM
F = 2 m = mg
R
GM
g= 2
R
R
m
M
Force is related to mass by acceleration, and the term g is known as the
gravitational acceleration.
On this theoretical Earth gravity would be constant, however, the Earth’s ellipsoidal
shape, rotation, irregular surface relief and internal mass distribution cause gravity
to vary over its surface.
Some Gravity Basics
The gravitational field can be defined in terms of the gravitational potential, U:
GM
U=
R
Gravitational acceleration g is a vector quantity, having both magnitude and
direction. The gravitational potential U is a scalar, having only magnitude. The
first derivative of U in any direction is the component of gravity in that direction.
Equipotential surfaces are those on which the gravitational potential is constant,
ie. the geoid.
The ocean surface is an equipotential surface, and defines the geoid.
Shape of the Earth
The geoid is one way of defining the shape of the earth, but we can also use
the ellipsoid. The earth is not a perfect sphere, it is an oblate spheroid
We can approximate the shape of the earth by an ellipsoid
•Radius from center to equator = 6378.16 km
•Radius from center to pole = 6356.77 km
•Polar shortening of 1 part in 298.25 – often referred to as flattening
The geoid and the ellipsoid are not coincident as the earth is not
homogeneous
From />
Shape of the Earth
Similarly, a satellite orbiting the earth moves up and down along its orbit as it is
affected by the same gravitational forces that produce the geoidal surface.
From />
Geoid
Sandwell et al, bathy workshop.
Large geoid low over India (~100 m) – mass defficency
A ship going from Darwin, Australia, to the southern tip of India is going
downhill!
Geoid highs over trenches – old and cold subducted slabs
Satellite Altimetry
Satellites do not carry accelerometers
Gravity variations can be calculated from changes in the position (shifts in
orbital height) of a satellite as it orbits due to variations in gravity.
•Tracking of radio signals (using Doppler shifts in frequency) from the
satellite help to determine these variations
•Locating the position of the satellite with satellite laser ranging
•Measure the changing height of the surface (sea level with reference to the
ellipsoid) with radar or laser altimetry
The presence of extra mass on the seafloor
is to cause a deviation of gravitational
attraction such that water above the
seamount “bunches up”.
Sandwell et al, bathy workshop.
Satellite Altimetry
The satellite uses a radar pulse to
measure the distance to the sea surface.
Repeating this pulse every 0.001
seconds allows the noise levels to be
reduced (waves etc). The difference
between this distance and that to the
theoretical ocean surface is the geoid
anomaly.
Note that each height value represents
an average of observations taken during
1 second when the satellite moves about
7 km over the ground. Height precision is
on the order of 3 cm.
Sandwell et al, bathy workshop.
Gravity from Space
Deriving the gravity field
from space is only good
for looking at coarse
detail, mainly in
unexplored regions.
From />
As the geiod (gravitational
potential) and the gravity
field are related, the
gravity field can be
calculated from a map of
the geoid. This is one of
the first methods used to
get a detailed image of the
seafloor.
Geoid and gravity maps
of part of the Gulf of
Mexico
Gravity from Space
From />
Tonga-Kermadec Trench,
Louisville Seamount Chain
Southern Oceans around
Antarctica
Bathymetry
Sandwell et al, bathy workshop.
The obvious way to collect bathymetry data for the oceans is using acoustic
methods along sparse ship tracks. The above map shows survey ship tracks in the
South Pacific at the scale of the continental US. Making a map of the US using only
data from along these tracks would obviously be very ineffective. A systematic
survey of the oceans by ships would take more than 200 years of survey time at a
cost of billions of U.S. dollars.
Bathymetry from Space
From />
In contrast A complete satellite survey can be made in five years for under
$100M. This has not yet been done, but we are part of the way there.
Gravity is correlated with bathymetry at short wavelength
• By examining the correlation between bathymetry along sparse ship
tracks and the corresponding satellite gravity values, a function can be
derived to convert satellite gravity data to bathymetry where there are no
ship tracks.
• This function varies depending on the geology
• Highly sedimented
• No sediment
• etc
Bathymetry from Space
From />
Topography
There are a number of sources of topography – many are the domain of
geographers, ie:
•Maps (USGS, etc)
•Conventional Digital elevation models (DEM)
•Many of these are derived from contour maps (digitized).
•Popular GIS programs can display and analyze these.
Geophysicists get involved when the technology gets a little more complicated.
For example:
•Imaging radar systems (for example the SIR-A, -B, and –C flown on the
Space Shuttle) typically use variations in the signal bounced back from the
ground to create an image
From />
Imaging Radar
From />
In this image, the color scene comes from
a Landsat image from the Sahara desert
in NW Sudan. The diagonal strip is from
an image acquired from SIR-A flown in
Nov. 1981. Because the sand is dry and
has a low dielectric constant the radar
waves penetrate up to 3 m, imaging not
just the sand, but also the bedrock below
it
Radar Interferometry
Radar imagery taken on two different dates can be compared, and the phase
difference determined to calculate the distances to point targets. This was taken to
the next level with the Space Shuttle Topography Mission (SRTM) in 2000.
•Rather than compare two images taken on different dates, two images were
collected simultaneously from slightly different locations.
•What is phase difference?
This is an example of the use of phase
difference when collecting interferometric
sidescan data.
•Two adjacent transducer arrays
•Both receive at the same time.
•As they are next to each other they are
receiving basically the same signal
•However, the signal coming to array A may
have traveled slightly further than that arriving at
array B.
•This translates into a phase difference.
•The phase difference can be used to determine
the angle from which the signal came.
•Combined with travel time, this tells us the
distance to that point on the seafloor
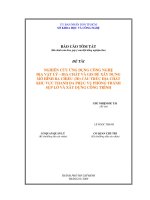
SRTM
A similar principle can be used from space, but the transducers (antenna) have to
be further apart – in this case 60 m.
From />
A transmit antenna illuminates the terrain
with a radar beam which is scattered by
the surface. Two receive antennas with a
fixed separation between them (baseline)
record the backscattered radar echo from
slightly different positions resulting in two
different radar images.
The two signals received at both ends of
the baseline show a phase shift due to
different signal paths. Through the
calculation of the relationship between
target-receiver distances and the phase
difference one obtains elevation
information which can be turned into
digital elevation models and maps.
SRTM
/>
SRTM
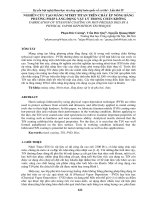
SRTM
USGS G-TOP30 and digitized data
Using this method, near global topography has been generated at a pixel size of
1 arc-second (approximately 30 m). So far, data at this resolution is only available
for the continental US. For other regions the data is available at a pixel size of 3
arc-seconds (90 m).
The above image compares 90 m SRTM data for the Papuan Peninsula with the
previously available 30 arc-second data (~1 km grid size).
References Used
1. Basic gravitational theory:
• Kearey, P., M. Brooks, and I. Hill, An Introduction to Geophysical Exploration.
2. The geoid, satellite altimetry
• />3. Calculating bathymetry from satellite gravity
• />• Smith, W. H. F. and D. T. Sandwell, Bathymetric prediction from dense satellite
altimetry and sparse shipboard bathymetry, J. Geophys. Res., 99, 2180321824, 1994.
• Sandwell, D.T., Gille, S.T., and W.H.F. Smith, eds., Bathymetry from Space:
Oceanography, Geophysics, and Climate, Geoscience Professional Services,
Bethesda, Maryland, June 2002, 24 pp.,
www.igpp.ucsd.edu/bathymetry_workshop.
4. Imagaing Radar (and a small amount of interferometry).
• />5. Radar Interferometry (SRTM mission)
• />• />• />