VẬT lý địa CHẤN grav
Bạn đang xem bản rút gọn của tài liệu. Xem và tải ngay bản đầy đủ của tài liệu tại đây (2.14 MB, 8 trang )
Additional references not referenced in the text
Ander, M. E., Govro, J., Shi, J., and Aliod, D., 1999b, Deep Penetration Density: A new
borehole gravity meter: SEG Expanded Abstracts, 18, 39-392.
Cowan, D.R., and Cowan, S., 1993, Separation filtering applied to aeromagnetic data:
Exploration Geophysics24, 429-436.
Longman, I.M., 1959, Formulas for computing the tidal accelerations due to the moon and the
sun: J. Geoph. Res., 64, 2351-2355.
Marson, I. and Klingele, E. E., 1993, Advantages of using the vertical gradient of gravity for 3-D
interpretation : Geophysics, 58, 1588-1595.
Sandwell, D.T., 1991, Geophysical applications of satellite altimetry: Rev. Geophys. Suppl., 29,
132-137.
Verduzco, B., Fairhead, J.D., Green, C.M., and MacKenzie, C., 2004, New insights into
magnetic derivatives for structural mapping: The Leading Edge, 23, 116-119.
Vine, F. J. and D. H. Matthews, 1963, Magnetic anomalies over oceanic ridges, Nature, 199,
947-949.
Figure captions
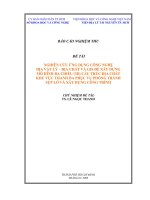
Figure 1. Satellite-derived marine free-air gravity field, merged with terrestrial gravity field,
published by Sandwell and Smith (2001), courtesy of the NOAA-NGDC.
75
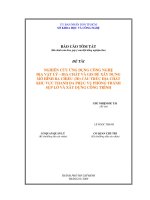
Figure 2. Perspective view of a 3D model representing the base of aquifer sediments in the
Albuquerque and neighboring basins. Gravity modeling, which focused on separating the effects
of the aquifer thickness from the underlying sedimentary package plus Precambrian basement,
used the iterative technique of Jachens and Moring (1990) constrained by drill hole information.
The model was combined with faults synthesized from geophysical interpretations and geologic
mapping to give a 3D surface that ultimately served as the lower limit of a regional ground-water
flow model for the entire basin area. From Grauch et al. (2002).
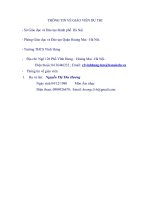
Figure 3. Gzz, the partial derivative with respect to the Z axis, of the vertical force of gravity.
Left: Gzz derived from conventional Bouguer gravity. Center: Gzz as measured with FTG survey.
Right: “Best estimate” of Gzz where all tensor components have been incorporated in data
enhancement procedures.
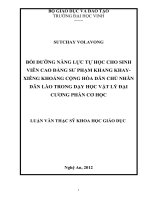
Figure 4. Prestack depth-migration profile along line B through K-2 Field. Top: Kirchhoff
migration. Center: Kirchhoff migration with base of salt horizon shown in yellow, as determined
by FTG inversion. Bottom: Wave-equation prestack depth-migration which also shows the
presence of a salt keel. Yellow horizon shows the FTG inversion result
Figure 5. Vertical gravity gradient, Gzz, from the Ekati survey. The image below shows an
enlarged section of a south-east part of the image above. Two dykes separated at just over 300 m
are resolved on the lower image, in which the white bar has a horizontal dimension of 300 m.
Figure 6. Vertical gravity, Gz, from the Ekati survey.
76
Figure 1
77
Figure 2
78
Figure 3
79
Figure 4
80
Figure 5
81
Figure 6
82