VẬT lý địa CHẤN seisnotes
Bạn đang xem bản rút gọn của tài liệu. Xem và tải ngay bản đầy đủ của tài liệu tại đây (523.23 KB, 55 trang )
Refraction Seismology
Definition
Refraction Seismology - A method that maps geologic structure using the travel times
of head waves. Head waves are elastic waves that enter a high-velocity medium
(refractor) near the critical angle and travel in the high-velocity medium nearly parallel
to the refractor surface before returning to the surface of the Earth. The objective in
refraction surveys is to measure the arrival times of head waves as a function of sourcereceiver distance so that the depth to the refractors in which they traveled can be
determined*.
Useful References
Burger, H. R., Exploration Geophysics of the Shallow Subsurface, Prentice Hall P T R, 1992.
Robinson, E. S., and C. Coruh, Basic Exploration Geophysics, John Wiley, 1988.
Telford, W. M., L. P. Geldart, and R. E. Sheriff, Applied Geophysics, 2nd ed., Cambridge University
Press, 1990.
An introduction to refraction seismology. Course notes describing the principles of refraction
seismology.
*Definition from the Encyclopedic Dictionary of Exploration Geophysics by R. E. Sheriff, published by the
Society of Exploration Geophysics.
Exploration Geophysics: Refraction Seismic Notes 06/20/02
1
Introduction
Seismic Methods: Refraction and Reflection
Advantages and Disadvantages of Seismic Methods Versus Other Methods Studied
Advantages and Disadvantages of Refraction and Reflection Methods
Elastic Waves
Types of Seismic Waves
Wave Propagation: Wavefronts and Raypaths
Seismology and Geology
Wave Interaction with Boundaries
Snell's Law
Velocities and Rock Properties
Seismic Velocities of Common Earth Materials
Refraction Basics
Another Simple Earth Model: Low-Velocity Layer Over a Halfspace
Head Waves
Records of Ground Motion
Travel-time Curves for a Simple Earth Model
First Arrivals
Determining Earth Structure from Travel Times
Derivation of Travel Time Equations
High-Velocity Layer Over a Halfspace: Reprise
Refraction Seismic Equipment and Field Procedures
Equipment Overview
Types of Seismic Sources
Seismometers or Geophones
Recording Ground Displacement at Several Offsets Simultaneously
Recording Systems
Sources of Noise
Interpretation of Seismic Observations
Picking Times of Arrivals
Wave Propagation with Multiple Horizontal Layers
Exploration Geophysics: Refraction Seismic Notes 06/20/02
2
Travel Time Curves from Multiple Horizontal Layers
Hidden Layers
Head Waves from a Dipping Layer: Shooting Down Dip
Head Waves from a Dipping Layer: Shooting Up Dip
A Field Procedure for Recognizing Dipping Beds
Estimating Dips and Depths from Travel Time Observations
Exploration Geophysics: Refraction Seismic Notes 06/20/02
3
Seismic Methods: Refraction and Reflection
Like the DC resistivity method, seismic methods, as typically applied in exploration seismology, are considered
active geophysical methods. In seismic surveying, ground movement caused by some source* is measured at a
variety of distances from the source. The type of seismic experiment differs depending on what aspect of the
recorded ground motion is used in the subsequent analysis. We do not mean to imply by this statement that any
seismic experiment can be done from a given set of observations. On the contrary, the two types of experiments
described below have very different acquisition requirements. These acquisition differences, however, arise
from the need to record specific parts of the Earth's ground motion over specific distances.
One of the first active seismic experiments was conducted in 1845 by Robert Mallet, considered by many to be
the father of instrumental seismology. Mallet measured the time of transmission of seismic waves, probably
surface waves, generated by an explosion. To make this measurement, Mallet placed small containers of
mercury at various distances from the source of the explosion and noted the time it took for the surface of the
mercury to ripple after the explosion. In 1909, Andrija Mohorovicic used travel-times from earthquake sources
to perform a seismic refraction experiment and discovered the existence of the crust-mantle boundary now
called the Moho.
The earliest uses of seismic observations for the exploration of oil and mineral resources date back to the 1920s.
The seismic refraction technique, described briefly below, was used extensively in Iran to delineate structures
that contained oil. The seismic reflection method, now the most commonly used seismic method in the oil
industry, was first demonstrated in Oklahoma in 1921. A plaque commemorating this event was erected on the
site by the Society of Exploration Geophysicists in 1971.
Refraction Seismology -Refraction experiments are based on the times of arrival of the initial ground
movement generated by a source recorded at a variety of distances. Later arriving complications in the
recorded ground motion are discarded. Thus, the data set derived from refraction experiments consists of
a series of times versus distances. These are then interpreted in terms of the depths to subsurface
interfaces and the speeds at which motion travels through the subsurface within each layer. These speeds
are controlled by a set of physical constants, called elastic p arameters that describe the material.
Reflection Seismology - In reflection experiments, analysis is concentrated on energy arriving after the
initial ground motion. Specifically, the analysis concentrates on ground movement that has been
reflected off of subsurface interfaces. In this sense, reflection seismology is a very sophisticated version
of the echo sounding used in submarines, ships, and radar systems. In addition to examining the times of
arrival of these, reflection seismic processing extracts information about the subsurface from the
amplitude and shape of the ground motion. Subsurface structures can be complex in shape but like the
refraction methods, are interpreted in terms of boundaries separating material with differing elastic
parameters.
Each of these techniques has specific advantages and distadvantages when compared to each other and when
compared to other geophysical techniques. For these reasons, different industries apply these techniques to
differing degrees. For example, the oil and gas industries use the seismic reflection technique almost to the
exclusion of other geophysical techniques. The environmental and engineering communities use seismic
techniques less frequently than other geophysical techniques. When seismic methods are used in these
communities, they tend to emphasize the refraction methods over the reflection methods.
*Any of a variety of sources can be used. Typically these sources are manmade, thus satisfying our definition of
Exploration Geophysics: Refraction Seismic Notes 06/20/02
4
an active geophysical survey. One could imagine using natural sources like earthquakes. Experiments that use
natural sources to generate ground motion, however, are considered passive experiments.
Advantages and Disadvantages of Seismic Methods
When compared to the other geophysical methods we've described thus far, the seismic methods have several
distinct advantages and several distinct disadvantages.
Seismic Methods
Advantage
Disadvantage
Can detect both lateral and depth variations in a physically
relevant parameter: seismic velocity.
Amount of data collected in a survey can
rapidly become overwhelming.
Can produce detailed images of structural features present
in the subsurface.
Data is expensive to acquire and the
logistics of data acquisition are more
intense than other geophysical methods.
Can be used to delineate stratigraphic and, in some
instances, depositional features.
Data reduction and processing can be
time consuming, require sophisticated
computer hardware, and demand
considerable expertise.
Response to seismic wave propagation is dependent on rock Equipment for the acquisition of seismic
density and a variety of physical (elastic) constants. Thus,
observations is, in general, more
any mechanism for changing these constants (porosity
expensive than equipment required for
changes, permeability changes, compaction, etc.) can, in
the other geophysical surveys considered
principle, be delineated via the seismic methods.
in this set of notes.
Direct detection of common contaminants
present at levels commonly seen in
hazardous waste spills is not possible.
If an investigator has deemed that the target of interest will produce a measurable seismic anomaly, you can see
from the above list that the primary disadvantages to employing seismic methods over other methods are
economically driven. The seismic methods are simply more expensive to undertake than other geophysical
methods. Seismic can produce remarkable images of the subsurface, but this comes at a relatively high
economic cost. Thus, when selecting the appropriate geophysical survey, one must determine whether the
possibly increased resolution of the survey is justified in terms of the cost of conducting and interpreting
observations from the survey.
Direct detection of hydrocarbons, in some instances, is
possible.
Advantages and Disadvantages of the Refraction and Reflection
Methods
On the previous page, we attempted to describe some of the advantages and disadvantages of the seismic
methods when compared to other geophysical methods. Like the electrical methods, the seismic method
encompasses a broad range of activities, and generalizations such as those made on the previous page are
dangerous. A better feel for the inherent strengths and weaknesses of the seismic approach can be obtained by
comparing and contrasting the two predominant seismic methods, refraction and reflection, with each other.
Exploration Geophysics: Refraction Seismic Notes 06/20/02
5
Refraction Methods
Advantage
Disadvantage
Reflection Methods
Advantage
Disadvantage
Refraction
observations generally
employ fewer source
and receiver locations
and are thus relatively
cheap to acquire.
Because many source and receiver
locations must be used to produce
meaningful images of the Earth's
subsurface, reflection seismic
observations can be expensive to
acquire.
Little processing is
done on refraction
observations with the
exception of trace
scaling or filtering to
help in the process of
picking the arrival
times of the initial
ground motion.
Reflection seismic processing can
be very computer intensive,
requiring sophisticated computer
hardware and a relatively highlevel of expertise. Thus, the
processing of reflection seismic
observations is relatively
expensive.
Because such a small
portion of the recorded
ground motion is used,
developing models and
interpretations is no
more difficult than our
previous efforts with
other geophysical
surveys.
Because of the overwhelming
amount of data collected, the
possible complications imposed by
the propagation of ground motion
through a complex earth, and the
complications imposed by some of
the necessary simplifications
required by the data processing
schemes, interpretations of the
reflection seismic observations
require more sophistication and
knowledge of the process.
Refraction seismic
observations require
relatively large
source-receiver
offsets (distances
between the source
and where the
ground motion is
recorded, the
receiver).
Reflection seismic
observations are
collected at small
source-receiver
offsets.
Refraction seismic
only works if the
speed at which
motions propagate
through the Earth
increases with depth.
Reflection seismic
methods can work
no matter how the
speed at which
motions propagate
through the Earth
varies with depth.
Exploration Geophysics: Refraction Seismic Notes 06/20/02
6
Refraction seismic
observations are
Reflection seismic
generally interpreted observations can be
more readily
in terms of layers.
These layers can
interpreted in terms
have dip and
of complex geology.
topography.
Reflection seismic
Refraction seismic observations use the
entire reflected
observations only use
wavefield (i.e., the
the arrival time of
time-history of
the initial ground
ground motion at
motion at different
different distances
distances from the
source (i.e., offsets). between the source
and the receiver).
A model for the
subsurface is
The subsurface is
constructed by
directly imaged from
attempting to
the acquired
reproduce the
observations.
observed arrival
times.
As you can see from the above list, the reflection technique has the potential for being more powerful in terms
of its ability to generate interpretable observations over complex geologic structures. As stated before, however,
this comes at a cost. This cost is primarily economic. Reflection surveys are more expensive to conduct than
refraction surveys. As a consequence, environmental and engineering concerns generally opt for performing
refraction surveys when possible. On the other hand, the petroleum industry uses reflection seismic techniques
almost to the exclusion of other geophysical methods.
In this set of notes, we will only consider seismic refraction methods.
Elastic Waves
When the is Earth rapidly displaced or distorted at some point, the energy imparted into the Earth by the source
of the distortion can be transmitted in the form of elastic waves. A wave is a disturbance that propagates
through, or on the surface of, a medium. Elastic waves satisfy this condition and also propagate through the
medium without causing permanent deformation of any point in the medium. Elastic waves are fairly common.
For example, sound propagates through the air as elastic waves and water waves propagate across the surface of
a pond as elastic waves.
In fact, water waves on the surface of a pond offer a convenient analogy for waves propagating through the
earth. When a pebble is thrown into a pond, the disturbance caused by the pebble propagates radially outward in
all directions. As the ripples move away from their source, notice that there are two distinct ways of looking at
the waves as they travel. These two distinct viewpoints are called frames of reference.
We can view the waves propagating across the surface of the pond from above the pond. At any time,
Exploration Geophysics: Refraction Seismic Notes 06/20/02
7
the waves form a circular ring around the source with some radius that is governed by the speed at
which the wave propagates through the water and the time elapsed since the wave originated at the
source. In this viewpoint, we fix time and we view the wavefield at any location across the entire
surface.
We can view these same waves as they propagate through some fixed location on the surface of the
pond. That is, imagine that instead of observing the waves from above the pond, we are in a small boat
on the surface of the pond, and we record how the boat moves up and down with respect to time as the
wave propagates past the boat. In this viewpoint, we fix our spatial location and view the wavefield at
this location at all times.
These two viewpoints give us two fundamentally different pictures of the exact same wave. Assume that our
ripple propagating outward from the source can be approximated by a sine wave.
From the first perspective, we can examine the wave at any location on the surface of the pond at some fixed
time. That wave would then be described as shown in the figure below.
In this reference frame, the wave is defined by two parameters: amplitude and wavelength. Amplitude is the
peak to trough height of the wave divided by two. Wavelength is the distance over which the wave goes
through one complete cycle (e.g., from one peak to the next, or from one trough to the next).
From our second perspective, we can examine the wave at a fixed location on the surface of the pond as it
propagates past us. That is, as time varies. That wave would be described as shown below.
Exploration Geophysics: Refraction Seismic Notes 06/20/02
8
In this frame of reference the wave is described by an amplitude and a period. The amplitude described in this
frame is identical to the amplitude described previously. Period is the time over which the wave is observed to
complete a single cycle. Another commonly used description related to period is the frequency. Frequency is
nothing more than the reciprocal of the period. If the period is measured in seconds (s), frequency has the units
of Hertz (Hz), 1/s.
As you might expect, period and wavelength are related. They are related by the speed at which the wave
propagates across the surface of the pond, c, where c equals the wavelength divided by the period of the wave.
Seismic Waves
Waves that propagate through the earth as elastic waves are referred to as seismic waves. There are two broad
categories of seismic waves: body waves and surface waves.
Body waves - These are elastic waves that propagate through the Earth's interior. In reflection and
refraction prospecting, body waves are the source of information used to image the Earth's interior. Like
the ripples on the surface of the pond example described previously, body waves propagate away from
the source in all directions. If the speed at which body waves propagate through the Earth's interior is
constant, then at any time, these waves form a sphere around the source whose radius is dependent on
the time elapsed since the source generated the waves. Shown below is a cross section through the earth
with body waves radiated from a source (red circle) shown at several different times. In the figure
below, ms stands for milli-seconds. One milli-second equals one one-thousandth of a second (i.e., there
are one thousand milli-seconds in a second).
Exploration Geophysics: Refraction Seismic Notes 06/20/02
9
Click Here for Movie Version
(127Kb)
The color being plotted is proportional to the amplitude of the body wave. Light blue-green is zero
amplitude, red is a large positive amplitude, and purple is a large negative amplitude. Notice that this
plot is explicitly constructed in a reference frame that fixes time, thus allowing us to examine the spatial
variations of the seismic wave. At any given time, notice that the wave is circular with its center located
at the source. This circle is, of course, nothing more than a two-dimensional section of the spherical
shape the wave has in three-dimensions.
Seismic body waves can be further subdivided into two classes of waves: P waves and S waves.
P Waves - P waves are also called primary waves, because they propagate through the medium
faster than the other wave types. In P waves, particles consistituting the medium are displaced in
the same direction that the wave propagates, in this case, the radial direction. Thus, material is
being extended and compressed as P waves propagate through the medium. P waves are
analogous to sound waves propagating through the air.
S Waves - S waves are sometimes called secondary waves, because they propagate through the
medium slower than P waves. In S waves, particles consistituting the medium are dispaced in a
direction that is perpendicular to the direction that the wave is propagating. In this example, as
the wave propagates radially, the medium is being deformed along spherical surfaces.
Most exploration seismic surveys use P waves as their primary source of information. The figure shown
above could, however, represent either P or S waves depending on the speed chosen to generate the plot.
Surface Waves - Surface waves are waves that propagate along the Earth's surface. Their amplitude at
the surface of the Earth can be very large, but this amplitude decays exponentially with depth. Surface
waves propagate at speeds that are slower than S waves, are less efficiently generated by buried sources,
and have amplitudes that decay with distance from the source more slowly than is observed for body
waves. Shown below is a cross section through a simplified Earth model (the speed of wave propagation
is assumed to be constant everywhere) showing how surface waves would appear at various times in this
Exploration Geophysics: Refraction Seismic Notes 06/20/02
10
medium.
Like body waves, there are two classes of surface waves, Love and Rayleigh waves, that are
distinquished by the type of particle motion they impose on the medium. For our purposes, it is not
necessary to detail these differences. Suffice it to say that for virtually all exploration surveys, surface
waves are a form of noise that we attempt to suppress. For reflection surveys in particular, suppression
of surface wave energy becomes particularly important, because the amplitudes of surface waves
generated from shallowly buried sources are often observed to be larger than the amplitudes of the body
waves you are attempting to record and interpret. For refraction surveys, surface waves are less of a
problem because we are only interested in the time of arrival of the first wave. Surface waves are never
the first arrival. In all of the remaining discussion about seismic waves, we will consider only body
waves.
Wavefronts and Raypaths
In the previous geophysical methods explored, in particular magnetics and resistivity, we often employed two
different descriptions of the physical phenomena being observed. For example, when discussing magnetism we
looked at both the strength of the magnetic field and the direction of the magnetic field. When discussing
resistivity, we discussed both the electrical potential and current flow.
Similarly, there are two equally useful descriptions of seismic waves: wavefronts and raypaths. The relationship
between these two descriptions is shown below.
Exploration Geophysics: Refraction Seismic Notes 06/20/02
11
Raypaths - Raypaths are nothing more than lines that show the direction that the seismic wave is
propagating. For any given wave, there are an infinite set of raypaths that could be used. In the example
shown above, for instance, a valid raypath could be any radial line drawn from the source. We have
shown only a few of the possible raypaths.
Wavefront - Wavefronts connect positions of the seismic wave that are doing the same thing at the same
time. In the example shown above, the wavefronts are spherical in shape. One such wavefront would be
the sphere drawn through the middle of the dark blue area. This surface would connect all portions of
the wave that have the largest possible negative amplitude at some particular time.
In principle and in practice, raypaths are equivalent to the directions of current flow, and wavefronts are
equivalent to the equipotential lines described in the resistivity section. They are also equivalent to field
direction and strength in magnetism.
Notice that in this example, wavefronts are perpendicular to raypaths. This is in general always true. So, given
either a set of wavefronts or a set of raypaths, we can construct the other. This was also true for current flow
and equipotential surfaces in resistivity and for field strength and field direction in magnetism.
Through much of the development to follow, we will use a raypath description of seismic wave propagation.
This description will allow for a much easier computation of the propagation times of specific seismic phases,
because we will be able to explicitly construct the path along which the seismic wave has travelled before being
recorded by our receiver. As we will see next, although the raypaths for the waves shown above are very
simple, as we begin to construct models of the Earth that contain speed variations, these raypaths will become
more complex.
Wave Interaction with Boundaries
Thus far we have considered body wave propagation through media that has a constant speed of seismic wave
propagation. What happens if the media consists of layers, each with a different speed of seismic wave
propagation?
Exploration Geophysics: Refraction Seismic Notes 06/20/02
12
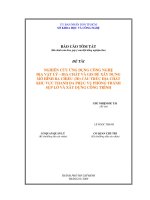
Consider the simple model shown below.
Although more complex than the homogeneous models considered previously, this model is still very simple,
consisting of a single layer over a halfspace. In this particular example, the speed* at which seismic waves
propagate in the layer is faster than the speed at which they propagate in the halfspace. Let's now watch the
seismic waves propagate through this medium and see how they interact with the boundary at 150 meters.
Shown below are three snapshots of the seismic wave at times of 25, 50, and 75 ms**.
Exploration Geophysics: Refraction Seismic Notes 06/20/02
13
Click Here for Movie Version
(129Kb)
From 0 to 50 ms, the wave propagates solely within the upper layer. Thus, our pictures of the wavefield look
identical to those generated previously. After 50 ms, the wave begins to interact with the boundary at 150
meters depth. Part of the wave has penetrated the boundary. The portion of the wavefield that has penetrated the
boundary is referred to as the refracted wave***. Also notice that part of the wave has bounced off, or reflected
off, of the boundary. This part of the wavefield is referred to as the reflected wave***. This is the portion of the
wavefield that is used in reflection surveying. Finally, part of the wavefield has not interacted with the
boundary at all. This part of the wavefield is called the direct wave.
There are several interesting features to note about the refracted arrival.
First, notice that the wavefront defining the refracted arrival is still circular, but its radius is no longer
centered on the source. Geophysicists would describe this as a change in the curvature of the wavefront.
Second, notice that the apparent wavelength of the refracted arrival is much shorter than the direct
Exploration Geophysics: Refraction Seismic Notes 06/20/02
14
arrival.
Both of these phenomena are related to the presence of the discontinuity. Remember that the period of a wave is
related to its wavelength through the speed at which the wave propagates through the medium. The wavelength
is equal to the speed times the period. Thus, if the period of the wave remains constant and the speed of the
medium decreases, the wavelength of the wave must also decrease.
The change in curvature of the wavefront as the wave passes through the interface implies that the raypaths
describing the direction of propagation of the wave change direction through the boundary. This change in
direction of the raypath as it crosses a boundary is described by a well-known law known as Snell's Law.
Finally, of fundamental importance to note is that if you were observing the ground's motion from any point on
the Earth's surface, you would observe two distinct waves. Initially, you would observe an arrival that is large in
amplitude and that is the direct wave. Then, some time later, you would observe a smaller amplitude reflected
wave. The time difference between your observation of these two arrivals is dependent on your distance from
the source, the speed of wave propagation in the layer, and the depth to the boundary. Thus, by observing this
time difference we may be able to learn something about the subsurface structure.
*Unless otherwise indicated, we will now assume that we are looking at P wave propagation through the Earth.
Thus, the speeds indicated are appropriate for P waves.
**ms stands for milliseconds. One millisecond is one one-thousandth of a second.
***We have simplified the situation a bit here. In general, when a P wave interacts with a boundary, it
generates not only a reflected and a refracted P wave, but it can also generate a reflected and a refracted S
wave. Conversely, S waves that interact with boundaries can generate reflected and refracted P waves. These
conversions of P waves to S waves and S waves to P waves are called mode conversions. We will assume that
no mode conversions occur. For refraction surveys, this is not a seriously flawed assumption, because again, we
are considering only the time of arrival of the initial wave. P to S wave mode conversions will never be the first
arrival. For reflection surveys, unless we were interested in recording S wave arrivals or mode conversions, we
design our survey and choose the recording equipment to minimize their effects.
Snell's Law
If we include raypaths for the reflected, refracted, and direct arrivals described on the previous page, we would
find that a selected set of the raypaths would look like those shown below.
Exploration Geophysics: Refraction Seismic Notes 06/20/02
15
These raypaths are simply drawn to be perpendicular to the direction of propagation of the wavefield at all
times. As they interact with the boundary, these raypaths obey Snell's Law. Snell's Law can be derived any
number of different ways, but the way it is usually described is that the raypath that follows Snell's Law is the
path by which the wave would take the least amount of time to propagate between two fixed points.
file:///home/tboyd
Consider the refracted raypaths shown above. In our particular case, v2, the velocity of the
halfspace, is less than v1, the velocity of the layer. Snell's Law states that in this case, i2, the angle
between a perpendicular to the boundary and the direction of the refracted raypath, should be
smaller than i1, the angle between a perpendicular to the boundary and the direction of the direct raypath. This
is exactly the situation predicted by the wavefronts shown in the figure above.
If v2 had been larger than v1, a situation we will consider in some detail later, then Snell's Law predicts that i2
would be greater than i1. In this case, the wavefront of the refracted wavefield would have smaller curvature
than the wavefront of the direct field (in the present case, the wavefront of the refracted field has greater
curvature than the wavefront of the direct field).
Snell's law can also be applied to the reflected raypath by setting v2 equal to v1. If v2 is equal to v1, then the
angle of reflection, i2, should be equal to the angle of the incident wave, i1, as we would expect from our
physics classes. Again, this is exactly the situation predicted by the wavefronts of the reflected wavefield shown
above.
As one final note for the case under consideration, for a high velocity layer overlying a low velocity halfspace,
the waves described previously and shown above (i.e., direct, reflected, and refracted) are the only body waves
observed. Notice also that if we were to place receivers at the Earth's surface, we would never observe the
refracted arrival. It continues to propagate downward, never returning to the surface.
Seismic Wave Speeds and Rock Properties
Before pursuing wave propagation issues any further, let's take a moment to describe how all this wave
propagation stuff relates to geologic structure. It's clear from the previous examples that variations in the speed
at which seismic waves propagate through the Earth* can cause variations in seismic waves recorded at the
Earth's surface. For example, we've shown that reflected waves can be generated from a planar boundary in
Exploration Geophysics: Refraction Seismic Notes 06/20/02
16
seismic wave speed that can be recorded at the Earth's surface. How do
these velocity variations relate to properties of the rocks or soils through
which the waves are propagating?
It can be shown that in homogeneous**, isotropic*** media the
velocities of P and S waves through the media are given by the
expressions shown to the right. Where Vp and Vs are the P and S wave
velocities of the medium, is the density of the medium, and and k are
referred to as the shear and bulk modulii of the media. Taken together,
and k are also known as elastic parameters. The elastic parameters
quantitatively describe the following physical characteristics of the
medium.
✁
✁
Bulk Modulus - Is also known as the incompressability of the
medium. Imagine you have a small cube of the material making up the medium and that you subject this
cube to pressure by squeezing it on all sides. If the material is not very stiff, you can image that it would
be possible to squeeze the material in this cube into a smaller cube. The bulk modulus describes the ratio
of the pressure applied to the cube to the amount of volume change that the cube undergoes. If k is very
large, then the material is very stiff, meaning that it doesn't compress very much even under large
pressures. If k is small, then a small pressure can compress the material by large amounts. For example,
gases have very small incompressabilities. Solids and liquids have large incompressabilities.
✂
✂
Shear Modulus - The shear modulus describes how difficult it is to deform a cube of the material under
an applied shearing force. For example, imagine you have a cube of material firmly cemented to a table
top. Now, push on one of the top edges of the material parallel to the table top. If the material has a
small shear modulus, you will be able to deform the cube in the direction you are pushing it so that the
cube will take on the shape of a parallelogram. If the material has a large shear modulus, it will take a
large force applied in this direction to deform the cube. Gases and fluids can not support shear forces.
That is, they have shear modulii of zero. From the equations given above, notice that this implies that
fluids and gases do not allow the propagation of S waves.
Any change in rock or soil property that causes , , or k to change will cause seismic wave speed to change.
For example, going from an unsaturated soil to a saturated soil will cause both the density and the bulk modulus
to change. The bulk modulus changes because air-filled pores become filled with water. Water is much more
difficult to compress than air. In fact, bulk modulus changes dominate this example. Thus, the P wave velocity
changes a lot across water table while S wave velocities change very little.
✁
Although this is a single example of how seismic velocities can change in the subsurface, you can imagine
many other factors causing changes in velocity (such as changes in lithology, changes in cementation, changes
in fluid content, changes in compaction, etc.). Thus, variations in seismic velocities offer the potential of being
able to map many different subsurface features.
*Geophysicists refer to the speed at which seismic waves propagate through the Earth as seismic wave velocity.
Clearly, in the context of defining how fast seismic energy is transmitted through a medium, speed is a more
appropriate word to use than velocity. From our introductory physics classes, recall that velocity implies not
only the speed at which something is moving but also the direction in which it is moving (i.e., speed is a scalar
quantity, velocity is a vector quantity). Regardless of this well-established difference in the meaning of the two
terms, in geophysical jargon, the term velocity is used as a synonym for speed.
Exploration Geophysics: Refraction Seismic Notes 06/20/02
17
**Homogeneous media are those whose properties do not vary with position.
***Isotropic media are those whose properties at any given position do not vary with direction.
Seismic Velocities of Earth Materials
The P and S wave velocities of various earth materials are shown below.
Material
P wave Velocity
(m/s)
S wave Velocity
(m/s)
Air
332
Water
1400-1500
Petroleum
1300-1400
Steel
6100
3500
Concrete
3600
2000
Granite
5500-5900
2800-3000
Basalt
6400
3200
Sandstone
1400-4300
700-2800
Limestone
5900-6100
2800-3000
Sand (Unsaturated)
200-1000
80-400
Sand (Saturated)
800-2200
320-880
Clay
1000-2500
400-1000
Glacial Till
(Saturated)
1500-2500
600-1000
Unlike density, there can be a large variation in seismic velocity between different rock types and between
saturated and unsaturated soils. Even with this variation, however, there is still considerable overlap in the
measured velocities. Hence, a knowledge of seismic velocity alone is not sufficient to determine rock type.
Another Simple Earth Model: Low-Velocity Layer Over a Halfspace
Thus far we have considered body wave propagation through constant velocity media and in media consisting
of a high-velocity layer overlying a lower velocity halfspace. As observed on the surface of the Earth, a
constant velocity media only generates direct waves while the layered model generates direct and reflected
waves. What happens if the media consists of a low-velocity layer overlying a high-velocity halfspace?
Consider the Earth model shown below.
Exploration Geophysics: Refraction Seismic Notes 06/20/02
18
Shown below are a few snapshots of the seismic waves as they propagate away from the source at times of 65,
80, and 110 ms**.
Exploration Geophysics: Refraction Seismic Notes 06/20/02
19
For these times, the wavefield qualitatively looks like that observed for our previous layered model consisting
of a high-velocity layer overlying a low-velocity halfspace. This is true with exception to the relative curvature
and the wavelength differences of the refracted wavefield compared to the direct and the reflected wavefield. In
this particular case, the refracted wavefield is more curved than the direct wavefield as a consequence of the
raypaths bending at the boundary in accordance with Snell's Law. Because the velocities increase across the
boundary with depth, the refracted wavefield now has a longer wavelength than the direct or the reflected
wavefield. The opposite sense of the velocity constrast across the boundary produced the opposite relationship
in wavelengths in our previous layered structure.
From 0 to about 70 ms, the wave propagates solely within the upper layer. After 70 ms, the wave begins to
interact with the boundary at 100 meters depth. As before, upon interaction with the boundary, part of the wave
is transmitted through the boundary, the refracted wave, and part bounces off of the boundary, the reflected
wave.
Exploration Geophysics: Refraction Seismic Notes 06/20/02
20
If we allow the waves to propagate further, an interesting phenomenon begins to occur with relation to the
refracted arrival. Consider the snapshot shown below.
Click Here for Movie Version
(127Kb)
As the refracted arrival propagates through the halfspace, because it travels faster than the direct arrival in the
layer, it begins to move across the layer boundary before the direct arrival. The refracted arrival is propagating
horizontally at the velocity of the halfspace, and the direct and the reflected arrivals propagate horizontally at
the speed of the layer.
As the refracted wave moves across the layer boundary, it generates a new wave type in the layer called a
critically refracted or head wave that propagates upward to the surface. The movie version of the above
snapshots show this phenomenon the best. In the previously considered layered model, a high-velocity layer
overlying a low-velocity halfspace, this arrival never exists. This is primarily because the refracted arrival, the
direct arrival, and the reflected arrival all move across the boundary at the same rate (There is never a
separation in the arrivals at the boundary that we see above).
In this particular example, note that if you were observing the ground's motion from any point on the Earth's
surface, you could observe three distinct waves. The reflected arrival will always be observed after the direct
arrival at any distance from the source, thus it can never be the first arriving energy. At short distances between
the source and the receiver, the direct arrival would be observed first. At long distances, however, notice that
the critically refracted arrival could be observed before the direct arrival.
These observations, if the velocity of the material increases with depth, the seismic waves recorded initially at a
given receiver will be of the direct wave at short source/receiver distances and the head wave at long
source/receiver distances, form the basis of the seismic refraction method.
Head Waves
In the previous example, we discovered that if a low-velocity layer overlies a higher velocity halfspace that in
Exploration Geophysics: Refraction Seismic Notes 06/20/02
21
addition to the direct and reflected arrivals, we also observe what is called
a head wave. In refraction seismic surveying, we measure the earliest times
of arrival of the seismic waves at various distances from the source. For the
layer over a halfspace model, this earliest arriving energy could be
associated with either the direct wave or the head wave.
Computing the time of arrival of the direct wave is relatively simple. It is
nothing more than the horizontal distance between the source and the
receiver divided by the speed at which the wave propagates in the layer. To
compute the time of arrival of the head wave, we need to describe the path
along which the head wave propagates. The path along which a wave
travels is described mathematically by the wave's raypath. Snell's law
provides the necessary mathematical framework for developing the raypath
of our head wave.
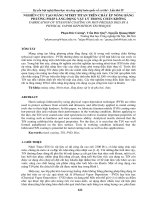
Raypaths must be perpendicular to wavefronts. Thus, as shown in the
figure below, we can sketch three raypaths from the boundary between the layer and the halfspace (red) and the
wavefront describing the head wave. The angle between each of these raypaths and a perpendicular to the
boundary is given by ic.
Substituting ic for i1 into Snell's law and solving for i2, we find that i2 equals 90 degrees. That is, the ray
describing the head wave does not penetrate into the halfspace, but rather propagates along the interface
separating the layer and the halfspace. ic is called the critical angle, and it describes the angle that the incident
raypath, i1, must assume for i2 to be equal to 90 degrees.
From this raypath description of the head wave, it looks as though energy propagates downward to the interface
at the critical angle at a speed of v1 (speed of wave propagation in the layer), propagates horizontally along the
interface at a speed of v2 (speed of wave propagation in the halfspace), and then is transmitted back up through
the layer at the critical angle at a speed of v1.
Although the head wave must travel along a longer path than the direct arrival before it can be recorded at the
Exploration Geophysics: Refraction Seismic Notes 06/20/02
22
Earth's surface, it travels along the bottom of the layer at a faster speed than the direct arrival. Therefore, as is
apparent in the movie showing the head wave, it can be recorded prior to the time of arrival of the direct wave
at certain distances.
Records of Ground Motion
Thus far, we have shown wave propagation through a variety of media. When seismic waves interact with a
boundary in the subsurface, some of the energy is transmitted through the boundary, some is reflected off of the
boundary, and if the velocities of the media separated by the boundary represent a velocity increase to the
propagating wave, some of the energy is transmitted along the boundary in the form of head waves.
Unfortunately, we can not record the wave field as it propagates through the earth at all points and at all times
as was done to produce the snapshots and movies shown previously. Instead, we must be content to record the
wavefield along the surface of the Earth. That is, what we will actually record is the motion of the Earth's
surface caused by seismic wave propagation through the Earth generated by our seismic source. Instruments
that are capable of recording ground motion are referred to as seismometers or geophones. These instruments
will be described in more detail later. Suffice it to say now, that they are capable of recording the ground
motion produced by the seismic waves we are interested in studying.
An example of the ground motion we would
record from a seismic wave propagating
through our layer over a halfspace model is
shown to the right. Time runs along the
horizontal axis, and amplitude of the ground
motion runs along the top. The line in the plot,
therefore, represents the time history of ground
motion at this one particular location, which is
referred to as a seismogram. In this case, the
seismometer employed records only up/down
ground motion. For this example, trace
excursion downward represents ground motion
that was upward. A trace excursion upward
represents ground motion that was downward.
There are two distinct seismic arrivals recorded on this record: one at a time of about 100 ms, the other at about
150 ms*. From this single record along, it is impossible for us to tell what these arrivals actually are. For
example, the first arrival could be the direct arrival or the head wave. Usually, we will record ground motion at
a number of different receivers and plot this motion as a function of time and as a function of distance from the
source. An example of such a plot is shown below.
Exploration Geophysics: Refraction Seismic Notes 06/20/02
23
In this case, time runs along the vertical axis and distance from the source along the horizontal axis. At each
appropriate shot and receiver distance, we have plotted the seismogram (record of ground motion at that
location). In this particular experiment, receivers are located at five meter distance intervals. Plots such as these
are usually referred to as shot records.
The advantage of looking at shot records is that you can see how the time of arrivals varies as distance from the
shot varies. This variation in the time versus distance is commonly referred to as moveout. Arrivals with large
moveouts dip steeply on shot records. Those with a small amount of moveout dip less steeply.
If you examine the shot record shown above carefully, you can see the three seismic waves defined previously
(i.e., direct, reflected, and refracted). Using the snapshots or movies of wave propagation presented earlier, try
to identify the three arrivals on this shot record. Remember that the reflected arrival can never be the first
arrival recorded on a given seismogram.
*These times represent the time after the source was initiated.
Travel-Time Curves
For this simple model under consideration, we can compute what the arrival times of the various seismic waves
should be and overlay these predicted arrival times on top of our shot record.
Exploration Geophysics: Refraction Seismic Notes 06/20/02
24
As expected, the first arrival at short offsets is the direct arrival. This arrival has a very large amplitude and its
moveout is constant over all offsets. That is, its arrival times fall along a straight line when plotted versus
offset. At larger offsets (>275 m), the first arrival is the refracted arrival. This arrival is characterized by small
amplitudes and a constant moveout that is smaller in value than the moveout of the direct arrival. That is, the
slope of the line connecting the arrival times of the refracted arrival is smaller (the line is flatter) than the direct
arrival. The last arrival recorded at all offsets is the reflected arrival. Notice that the reflected arrival does not
have a constant moveout at all offsets*. Its moveout is zero at zero offset and it approaches the moveout of the
direct arrival at very large offsets.
Plots of the times of arrivals of the various recorded waves versus offset from the source are called travel-time
curves. We will often show the travel-time curves of seismic arrivals without overlaying them on shot records
as shown below.
Exploration Geophysics: Refraction Seismic Notes 06/20/02
25