Assessment in counseling chapter 3
Bạn đang xem bản rút gọn của tài liệu. Xem và tải ngay bản đầy đủ của tài liệu tại đây (194.63 KB, 19 trang )
Reliability
Chapter 3
Classical Test Theory
∗ Every observed score is a combination of true
score and error
Obs. = T + E
∗ Reliability =
s
1−
s
2
E
2
O
s
=
s
2
T
2
O
Reliability
∗ Systematic versus unsystematic error
∗ Reliability only takes unsystematic error into
account
Reliability & Correlation
∗ Reliability often based on consistency between two
sets of scores
∗ Correlation: Statistical technique used to examine
consistency
Positive Correlation
Negative Correlation
Pearson-Product Moment
Correlation Coefficient
∗ Correlation coefficient: a numerical indicator of the
relationship between two sets of data
∗ Pearson-Product Moment correlation coefficient is
most common
r=
∑ z1 z 2
N
Coefficient of Determination
∗ The percentage of shared variance between two sets of
data
Types of Reliability
∗ Test-Retest
∗ Alternate/Parallel Forms
∗ Internal Consistency Measures
Test-Retest
∗ Correlating performance on first administration
with performance on the second
∗ Co-efficient of stability
Alternate/Parallel Forms
∗ Two forms of instrument, administered to same
individuals
Internal Consistency Measures
∗ Split-half reliability
∗ Spearman-Brown formula
∗ Kuder-Richardson formulas
∗ KR 20
∗ KR 21
∗ Coefficient Alpha
Nontypical Situations
∗ Typical methods for determining reliability may not
be suitable for:
∗ Speed tests
∗ Criterion-referenced tests
∗ Subjectively-scored instruments
∗ Interrater reliability
Evaluating Reliability Coefficients
∗ Examine purpose for using instrument
∗ Be knowledgeable about reliability coefficients of
other instruments in that area
∗ Examine characteristics of particular clients
against reliability coefficients
∗ Coefficients may vary based on SES, age,
culture/ethnicity, etc.
Standard Error of Measurement
SEM = s 1 − r
∗ Provides estimate of range of scores if someone were to
take instrument repeatedly
∗ Based on premise that when individuals take a test
multiple times, scores fall into normal distribution
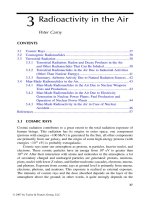
SEM: Example
∗ Sam’s SAT Verbal = 550
∗ r = .91; s = 100
∗ SEM = 100 1 − .91
= 100 .09
= 100 × .3
= 30
∗ 68% of the time, Sam’s true score would fall between 520 and 580
∗ 95% of the time, Sam’s true score would fall between 490 and 610
∗ 99.5% of the time, Sam’s true score would fall between 460 and 640
Determining Range of Scores Using
SEM
Standard Error of Difference
∗ Method to determine if difference between two
scores is significant
∗ Takes into account SEM of both scores
Alternative Theoretical Model
∗ Generalizability or Domain Sampling Theory
∗ Focus is on estimating the extent to which specific
sources of variation under defined conditions are
contributing to the score on the instrument