Master’s thesis Towards a Big Data Reference Architecture
Bạn đang xem bản rút gọn của tài liệu. Xem và tải ngay bản đầy đủ của tài liệu tại đây (7.35 MB, 147 trang )
Eindhoven University of Technology
Department of Mathematics and Computer Science
Master’s thesis
Towards a Big Data Reference Architecture
13th October 2013
Author:
Supervisor:
Assessment committee:
Markus Maier
dr. G.H.L. Fletcher
dr. G.H.L. Fletcher
dr. A. Serebrenik
dr.ir. I.T.P. Vanderfeesten
Abstract
Technologies and promises connected to ‘big data’ got a lot of attention lately. Leveraging emerging
‘big data’ sources extends requirements of traditional data management due to the large volume,
velocity, variety and veracity of this data. At the same time, it promises to extract value from
previously largely unused sources and to use insights from this data to gain a competitive advantage.
To gain this value, organizations need to consider new architectures for their data management systems
and new technologies to implement these architectures. In this master’s thesis I identify additional
requirements that result from these new characteristics of data, design a reference architecture
combining several data management components to tackle these requirements and finally discuss
current technologies, which can be used to implement the reference architecture. The design of
the reference architecture takes an evolutionary approach, building from traditional enterprise
data warehouse architecture and integrating additional components aimed at handling these new
requirements. Implementing these components involves technologies like the Apache Hadoop ecosystem
and so-called ‘NoSQL’ databases. A verification of the reference architecture finally proves it correct
and relevant to practice.
The proposed reference architecture and a survey of the current state of art in ‘big data’ technologies
guides designers in the creation of systems, which create new value from existing, but also previously
under-used data. They provide decision makers with entirely new insights from data to base decisions
on. These insights can lead to enhancements in companies’ productivity and competitiveness, support
innovation and even create entirely new business models.
ii
Preface
This thesis is the result of the final project for my master’s program in Business Information Systems
at Eindhoven University of Technology. The project was conducted over a time of 7 months within
the Web Engineering (formerly Databases and Hypermedia) group in the Mathematics and Computer
Science department.
I want to use this place to mention and thank a couple of people. First, I want to express my greatest
gratitude to my supervisor George Fletcher for all his advice and feedback, for his engagement and
flexibility. Second, I want to thank the members of my assessment committee, Irene Vanderfeesten
and Alexander Serebrenik, for reviewing my thesis, attending my final presentation and giving me
critical feedback. Finally, I want to thank all the people, family and friends, for their support during
my whole studies and especially during my final project. You helped my through some stressful and
rough times and I am very thankful to all of you.
Markus Maier, Eindhoven, 13th October 2013
iii
1
Introduction
1.1
Motivation
Big Data has become one of the buzzwords in IT during the last couple of years. Initially it was
shaped by organizations which had to handle fast growth rates of data like web data, data resulting
from scientific or business simulations or other data sources. Some of those companies’ business
models are fundamentally based on indexing and using this large amount of data. The pressure to
handle the growing data amount on the web e.g. lead Google to develop the Google File System
[119] and MapReduce [94]. Efforts were made to rebuild those technologies as open source software.
This resulted in Apache Hadoop and the Hadoop File System [12, 226] and laid the foundation for
technologies summarized today as ‘big data’.
With this groundwork traditional information management companies stepped in and invested to
extend their software portfolios and build new solutions especially aimed at Big Data analysis. Among
those companies were IBM [27, 28], Oracle [32], HP [26], Microsoft [31], SAS [35] and SAP [33, 34].
At the same time start-ups like Cloudera [23] entered the scene. Some of the ‘big data’ solutions are
based on Hadoop distributions, others are self-developed and companies’ ‘big data’ portfolios are
often blended with existing technologies. This is e.g. the case when big data gets integrated with
existing data management solutions, but also for complex event processing solutions which are the
basis (but got further developed) to handle stream processing of big data 1 .
The effort taken by software companies to get part of the big data story is not surprising considering
the trends analysts predict and the praise they sing on ‘big data’ and its impact onto business and
even society as a whole. IDC predicts in its ‘The Digital Universe’ study that the digital data created
and consumed per year will grow up to 40.000 exabyte by 2020, from which a third 2 will promise
value to organizations if processed using big data technologies [115]. IDC also states that in 2012 only
0.5% of potentially valuable data were analyzed, calling this the ‘Big Data Gap’. While the McKinsey
Global Institute also predicts that the data globally generated is growing by around 40% per year,
they furthermore describe big data trends in terms of monetary figures. They project the yearly value
of big data analytics for the US health care sector to be around 300 billion $. They also predict a
possible value of around 250 billion Ä for the European public sector and a potential improvement of
margins in the retail industry by 60% [163].
1
2
e.g. IBM InfoSphere Streams [29]
around 13.000 exabyte
1
CHAPTER 1. INTRODUCTION
With this kind of promises the topic got picked up by business and management journals to emphasize
and describe the impact of big data onto management practices. One of the terms coined in that
context is ‘data-guided management’ [157]. In MIT Sloan Management Review Thomas H. Davenport
discusses how organisations applying and mastering big data differ from organisations with a more
traditional approach to data analysis and what they can gain from it [92]. Harvard Business Review
published an article series about big data [58, 91, 166] in which they call the topic a ‘management
revolution’ and describe how ‘big data’ can change management, how an organisational culture needs
to change to embrace big data and what other steps and measures are necessary to make it all work.
But the discussion did not stop with business and monetary gains. There are also several publications
stressing the potential of big data to revolutionize science and even society as a whole. A community
whitepaper written by several US data management researchers states, that a ‘major investment in Big
Data, properly directed, can result not only in major scientific advances but also lay the foundation
for the next generation of advances in science, medicine, and business’ [45]. Alex Pentland, who is
director of MIT’s Human Dynamics Laboratory and considered one of the pioneers of incorporating
big data into the social sciences, claims that big data can be a major instrument to ‘reinvent society’
and to improve it in that process [177]. While other researchers often talk about relationships in
social networks when talking about big data, Alex Pentland focusses on location data from mobile
phones, payment data from credit cards and so on. He describes this data as data about people’s
actual behaviour and not so much about their choices for communication. From his point of view,
‘big data is increasingly about real behavior’ [177] and connections between individuals. In essence
he argues that this allows the analysis of systems (social, financial etc.) on a more fine-granular
level of micro-transactions between individuals and ‘micro-patterns’ within these transactions. He
further argues, that this will allow a far more detailed understanding and a far better design of new
systems. This transformative potential to change the architecture of societies was also recognized by
mainstream media and is brought into public discussion. The New York Times e.g. declared ‘The
Age of Big Data’ [157]. There were also books published to describe how big data transforms the way
‘we live, work and think’ [165] to a public audience and to present essays and examples how big data
can influence mankind [201].
However the impact of ‘big data’ and where it is going is not without controversies. Chris Anderson,
back then editor in chief of Wired magazine, started a discourse, when he announced ‘the end of
theory’ and the obsolescence of the scientific method due to big data [49]. In his essay he claimed,
that with massive data the scientific method - observe, develop a model and formulate hypothesis,
test the hypothesis by conducting experiments and collecting data, analyse and interpret the data would be obsolete. He argues that all models or theories are erroneous and the use of enough data
allows to skip the modelling step and instead leverage statistical methods to find patterns without
creating hypothesis first. In that sense he values correlation over causation. This gets apparent in the
following quote:
Who knows why people do what they do? The point is they do it, and we can track and
measure it with unprecedented fidelity. With enough data, the numbers speak for themselves.
[49]
Chris Anderson is not alone with his statement. While they do not consider it the ‘end of theory’
in general, Viktor Mayer-Schönberger and Kenneth Cukier also emphasize on the importance of
correlation and favour it over causation [165, pp. 50-72]. Still this is a rather extreme position and
is questioned by several other authors. Boyd and Crawford, while not denying its possible value,
published an article to provoke an overly positive and simplified point of view of ‘big data’ [73]. One
point they raise is, that there are always connections and patterns in huge data sets, but not all of
them are valid, some are just coincidental or biased. Therefore it is necessary to place data analysis
2
1.1. MOTIVATION
within a methodological framework and to question the framework’s assumptions and the possible
biases in the data sets to identify the patterns, that are valid and reasonable. Nassim N. Taleb agrees
with them. He claims that an increase of data volume also leads to an increase of noise and that
big data essentially means ‘more false information’ [218]. He argues that with enough data there
are always correlations to be found, but a lot of them are spurious 3 . With this claim Boyd and
Crawford, as well as Talib, directly counter Anderson’s postulations of focussing on correlation instead
of causation. Put differently those authors claim, that data and numbers do not speak for themselves,
but creating knowledge from data always includes critical reflection and critical reflection also means
to put insights and conclusions into some broader context - to place them within some theory.
This also means, that analysing data is always subjective, no matter how much data is available. It is
a process of individual choices and interpretation. This process starts with creating the data4 and
with deciding what to measure and how to measure it. It goes on with making observations within
the data, finding patterns, creating a model and understanding what this model actually means [73].
It further goes on with drawing hypotheses from the model and testing them to finally prove the
model or at least give strong indication for its validity. The potential to crunch massive data sets can
support several stages of this process, but it will not render it obsolete.
To draw valid conclusions from data it is also necessary to identify and account for flaws and biases in
the underlying data sets and to determine which questions can be answered and which conclusions can
be validly drawn from certain data. This is as true for large sets of data as it is for smaller samples.
For one, having a massive set of data does not mean that it is a full set of the entire population or
that it is statistically random and representative [73]. Different social media sites are an often used
data source for researching social networks and social behaviour. However they are not representative
for the entire human population. They might be biased towards certain countries, a certain age group
or generally more tech-savvy people. Furthermore researchers might not even have access to the
entire population of a social network [162]. Twitter’s standard APIs e.g. do not retrieve all but only
a collection of tweets, they obviously only retrieve public tweets and the Search API only searches
through recent tweets [73].
As another contribution to this discussion several researchers published short essays and comments as
a direct response to Chris Anderson’ article [109]. Many of them argue in line with the arguments
presented above and conclude that big data analysis will be an additional and valuable instrument to
conduct science, but it will not replace the scientific method and render theories useless.
While all these discussions talk about ‘big data’, this term can be very misleading as it puts the focus
only onto data volume. Data volume, however, is not a new problem. Wal-Mart’s corporate data
warehouse had a size of around 300 terrabyte in 2003 and 480 terrabyte in 2004. Data warehouses of
that size were considered really big in that time and techniques existed to handle it 5 . The problem
of handling large data is therefore not new in itself and what ‘large’ means is actually scaling as
performance of modern hardware improves. To tackle the ‘Big Data Gap’ handling volume is not
enough, though. What is new, is what kind of data is analysed. While traditional data warehousing
is very much focussed onto analysing structured data modelled within the relational schema, ‘big
data’ is also about recognizing value in unstructured sources6 . These sources are largely uncovered,
yet. Furthermore, data gets created faster and faster and it is often necessary to process the data in
almost real-time to maintain agility and competitive advantage.
3
4
5
6
e.g. due to noise
note that this is often outside the influence of researchers using ‘big data’ from these sources
e.g. the use of distributed databases
e.g. text, image or video sources
3
CHAPTER 1. INTRODUCTION
Therefore big data technologies need not only to handle the volume of data but also its velocity7 and
its variety. Gartner comprised those three criteria of Big Data in the 3Vs model [152, 178]. Coming
together the 3Vs pose a challenge to data analysis, which made it hard to handle respective data
sets with traditional data management and analysis tools: processing large volumes of heterogeneous,
structured and especially unstructured data in a reasonable amount of time to allow fast reaction to
trends and events.
These different requirements, as well as the amount of companies pushing into the field, lead to
a variety of technologies and products labelled as ‘big data’. This includes the advent of NoSQL
databases which give up full ACID compliance for performance and scalability [113, 187]. It also
comprises frameworks for extreme parallel computing like Apache Hadoop [12], which is built based on
Google’s MapReduce paradigm [94], and products for handling and analysing streaming data without
necessarily storing all of it. In general many of those technologies focus especially on scalability and a
notion of scaling out instead of scaling up, which means the capability to easily add new nodes to the
system instead of scaling a single node. The downside of this rapid development is, that it is hard to
keep an overview of all these technologies. For system architects it can be difficult to decide which
respective technology or product is best in which situation and to build a system optimized for the
specific requirements.
1.2
Problem Statement and Thesis Outline
Motivated by a current lack of clear guidance for approaching the field of ‘big data’, the goal of
this master thesis is to functionally structure this space by providing a reference architecture. This
reference architecture has the objective to give an overview of available technology and software
within the space and to organize this technology by placing it according to the functional components
in the reference architecture. The reference architecture shall also be suitable to serve as a basis for
thinking and communicating about ‘big data’ applications and for giving some decision guidelines for
architecting them.
As the space of ‘big data’ is rather big and diverse, the scope needs to be defined as a smaller
subspace to be feasible for this work. First, the focus will be on software rather than hardware.
While parallelization and distribution are important principles for handling ‘big data’, this thesis will
not contain considerations for the hardware design of clusters. Low-level software for mere cluster
management is also out of scope. The focus will be on software and frameworks that are used for the
‘big data’ application itself. This includes application infrastructure software like databases, it includes
frameworks to guide and simplify programming efforts and to abstract away from parallelization and
cluster management, and it includes software libraries that provide functionality which can be used
within the application. Deployment options, e.g. cloud computing, will be discussed shortly where
they have an influence onto the application architecture, but will not be the focus.
Second, the use of ‘big data’ technology and the resulting applications are very diverse. Generally, they
can be categorized into ‘big transactional processing’ and ‘big analytical processing’. The first category
focusses on adding ‘big data’ functionality to operational applications to handle huge amounts of
very fast inflowing transactions. This can be as diverse as applications exist and it is very difficult,
if not infeasible, to provide an overarching reference architecture. Therefore I will focus on the
second category and ‘analytical big data processing’. This will include general functions of analytical
applications, e.g. typical data processing steps, and infrastructure software that is used within the
application like databases and frameworks as mentioned above.
7
4
Velocity refers to the speed of incoming data
1.2. PROBLEM STATEMENT AND THESIS OUTLINE
Building the reference architecture will consist of four steps. The first step is to conduct a qualitative
literature study to define and describe the space of ‘big data’ and related work (Sections 2.1 and 2.3.2)
and to gather typical requirements for analytical ‘big data’ applications. This includes dimensions
and characteristics of the underlying data like data formats and heterogeneity, data quality, data
volume, distribution of data etc., but also typical functional and non-functional requirements, e.g.
performance, real-time analysis etc. (Chapter 2.1). Based on this literature study I will design a
requirements framework to guide the design of the reference architecture (Chapter 3).
The second step will be to design the reference architecture. To design the reference architecture,
first I will develop and describe a methodology from literature about designing software architectures,
especially reference architectures (Sections 2.2.2 and 4.1). Based on the gathered requirements, the
described methodology and design principles for ‘big data’ applications, I will then design the reference
architecture in a stepwise approach (Section 4.2).
The third step will be again a qualitative literature study aimed to gather an overview of existing
technologies and technological frameworks developed for handling and processing large volumes of
heterogeneous data in reasonable time (see the 3 V model [152, 178]). I will describe those different
technologies, categorize them and place them within the reference architecture developed before
(Section 4.3). The aim is to provide guidance in which situations which technologies and products are
beneficial and a resulting reference architecture to place products and technologies in. The criteria for
technology selection will again be based on the requirements framework and the reference architecture.
In a fourth step I will verify and refine the resulting reference architecture by applying it to case
studies and mapping it against existing ‘big data’ architectures from academic and industrial literature.
This verification (Chapter 5) will test, if existing architecture can be described by the reference
architecture, therefore if the reference architecture is relevant for practical problems and suitable
to describe concrete ‘big data’ applications and systems. Lessons learned from this step will be
incorporated back into the framework.
The verification demonstrates, that this work was successful, if the proposed reference architecture
tackles requirements for ‘big data’ applications as they are found in practice and as gathered through
a literature study, and that the work is relevant for practice as verified by its match to existing
architectures. Indeed the proposed reference architecture and the technology overview provide value by
guiding reasoning about the space of ‘big data’ and by helping architects to design ‘big data’ systems.
that extract large value from data and that enable companies to improve their competitiveness due to
better and more evidence-based decision making.
5
2
Problem Context
In this Chapter I will describe the general context of this thesis and the reference architecture to
develop. First, I will give a definition of what ‘big data’ actually is and how it can be characterized
(see Section 2.1). This is important to identify characteristics that define data as ‘big data’ and
applications as ‘big data applications’ and to establish a proper scope for the reference architecture. I
will develop this definition in Section 2.1.1. The definition will be based on five characteristics, namely
data volume, velocity, variety, veracity and value. I will describe these different characteristics in
more detail in Sections 2.1.2 to 2.1.6. These characteristics are important, so one can later on extract
concrete requirements from them in Chapter 3 and then base the reference architecture described in
Chapter 4 on this set of requirements.
Afterwards in Section 2.2, I will describe what I mean, when I am talking about a reference architecture.
I will define the term and argue why reference architectures are important and valuable in Section
2.2.1, I will describe the methodology for the development of this reference architecture in Section
2.2.2 and I will decide about the type of reference architecture appropriate for the underlying problem
in Section 2.2.3. Finally, I will describe related work that has been done for traditional data warehouse
architecture (see Section 2.3.1) and for big data architectures in general (see Section 2.3.2).
2.1
Definition and Characteristics of Big Data
2.1.1
Definition of the term ‘Big Data’
As described in Section 1.1, the discussion about the topic in scientific and business literature are
diverse and so are the definitions of ‘big data’ and how the term is used. In one of the largest
commercial studies titled ‘Big data: The next frontier for innovation, competition, and productivity’
the McKinsey Global Institute (MGI) used the following definition:
Big data refers to datasets whose size is beyond the ability of typical database software
tools to capture, store, manage, and analyze. This definition is intentionally subjective and
incorporates a moving definition of how big a dataset needs to be in order to be considered
big data. [163]
With that definition MGI emphasizes that there is no concrete volume threshold for data to be
considered ‘big’, but it depends on the context. However the definition uses size or volume of data
as only criterion. As stated in the introduction (Section 1.1), this usage of the term ‘big data’ can
6
2.1. DEFINITION AND CHARACTERISTICS OF BIG DATA
be misleading as it suggests that the notion is mainly about the volume of data. If that would be
the case, the problem would not be new. The question how to handle data considered large at a
certain point in time is a long existing topic in database research and lead to the advent of parallel
database systems with ‘shared-nothing’ architectures [99]. Therefore, considering the waves ‘big data’
creates, there must obviously be more about it than just volume. Indeed, most publications extend
this definition. One of this definitions is given in IDC’s ‘The Digital Universe’ study:
IDC defines Big Data technologies as a new generation of technologies and architectures,
designed to economically extract value from very large volumes of a wide variety of
data by enabling high-velocity capture, discovery, and/or analysis. There are three main
characteristics of Big Data: the data itself, the analytics of the data, and the presentation
of the results of the analytics. [115]
This definition is based on the 3V’s model coined by Doug Laney in 2001 [152]. Laney did not use
the term ‘big data’, but he predicted that one trend in e-commerce is, that data management will
get more and more important and difficult. He then identified the 3V’s - data volume, data velocity
and data variety - as the biggest challenges for data management. Data volume means the size of
data, data velocity the speed at which new data arrives and variety means, that data is extracted
from varied sources and can be unstructured or semistructured. When the discussion about ‘big data’
came up, authors especially from business and industry adopted the 3V’s model to define ‘big data’
and to emphasize that solutions need to tackle all three to be successful [11, 178, 194][231, 9-14].
Surprisingly, in the academic literature there is no such consistent definition. Some researchers use
[83, 213] or slightly modify the 3V’s model. Sam Madden describes ‘big data’ as data that is ‘too
big, too fast, or too hard’ [161], where ‘too hard’ refers to data that does not fit neatly into existing
processing tools. Therefore ‘too hard’ is very similar to data variety. Kaisler et al. define Big Data as
the amount of data just beyond technology’s capability to store, manage and process efficiently’, but
mention variety and velocity as additional characteristics [141]. Tim Kraska moves away from the 3
V’s, but still acknowledges, that ‘big data’ is more than just volume. He describes ‘big data’ as data for
which ‘the normal application of current technology doesn’t enable users to obtain timely, cost-effective,
and quality answers to data-driven questions’ [147]. However, he leaves open which characteristics of
this data go beyond ‘normal application of current technology’. Others still characterise ‘big data’
only based on volume [137, 196] or do not give a formal definition [71]. Furthermore some researchers
omit the term at all, e.g. because their work focusses on single parts 1 of the picture.
Overall the 3V’s model or adaptations of it seem to be the most widely used and accepted description
of what the term ‘big data’ means. Furthermore the model clearly describes characteristics that can
be used to derive requirements for respective technologies and products. Therefore I use it as guiding
definition for this thesis. However, given the problem statement of this thesis, there are still important
issues left out of the definition. One objective is to dive deeper into the topic of data quality and
consistency. To better support this goal, I decided to add another dimension, namely veracity (or
better the lack of veracity). Actually, in industry veracity is sometimes used as a 4th V, e.g. by IBM
[30, 118, 224][10, pp. 4-5]. Veracity refers to the trust into the data and is to some extent the result
of data velocity and variety. The high speed in which data arrives and needs to be processed makes
it hard to consistently cleanse it and conduct pre-processing to improve data quality. This effect
gets stronger in the face of variety. First, it is necessary to do data cleansing and ensure consistency
for unstructured data. Second the variety of many, independent data sources can naturally lead to
inconsistencies between them and makes it hard if not impossible to record metadata and lineage
for each data item or even data set. Third, especially human generated content and social media
analytics are likely to contain inconsistencies because of human errors, ill intentions or simply because
1
e.g. solely tackling unstructuredness or processing streaming data
7
CHAPTER 2. PROBLEM CONTEXT
there is not one truth as these sources are mainly about opinion and opinion differs.
After adding veracity, there is still another issue with the set of characteristics used so far. All of them
focus on the characteristics of the input data and impose requirements mainly on the management
of the data and therefore on the infrastructure level. ‘Big data’ is however not only about the
infrastructure, but also about algorithms and tools on the application level that are used to analyse
the data, process it and thereby create value. Visualization tools are e.g. an important product family
linked to ‘big data’. Therefore I emphasize another V - value - that aims at the application side, how
data is processed there and what insights and results are achieved. In fact, this is already mentioned
in IDC’s definition cited above, where they emphasize the ‘economic extraction of value’ from large
volumes of varied and high-velocity data [115].
One important note is that, while each ‘big data’ initiative should provide some value and achieve
a certain goal, the other four characteristics do not need to be all present at the same time for
a problem to qualify as ‘big data’. Each combination of characteristics (volume, velocity, variety,
veracity) that makes it hard or even impossible to handle a problem with traditional data mangement
methods may suffice to consider that problem ‘big data’. In the following I will describe the mentioned
characteristics in more detail.
2.1.2
Data Volume
As discussed in Chapters 1.1 and 2.1.1 handling volume is the obvious and most widely recognized
challenge. There is however no clear or concrete quantification of when volume should be considered
‘big’. This is rather a moving target increasing with available computing power. While 300 terrabyte
were considered big 10 years before, today petabyte are considered big and the target is moving
more and more to exabyte and even zettabyte [115]. There are estimates that Walmart’s processes
more than 2.5 petabytes per hour, all from customer transactions [166]. Google processes around 24
petabytes per day and this is growing [92, 165]. To account for this moving target, big volume can be
considered as ‘data whose size forces us to look beyond the tried-and-true methods that are prevalent
at that time’ [137].
Furthermore ‘big’ volume is not only dependent on the available computing, but also on other
characteristics and the application of the data. In a paper describing the vision and execution plan
for their ‘big data’ research, researchers from MIT e.g. claim, that the handling of massive data sets
for ‘conventional SQL analytics’ is well solved by data warehousing technology, while massive data is
a bigger challenge for more complex analytics 2 [213].
It is also obvious that big volume problems are interdependent with velocity and variety. The volume
of a data set might not be problematic, if it can be bulk-loaded and a processing time of one hour is
fine. Handling the same volume might be a really hard problem, if it is arriving fast and needs to be
processed within seconds. On the same time handling volume might get harder as the data set to
be processed gets unstructured. This adds the necessity to conduct pre-processing steps to extract
the information needed out of the unstructuredness and therefore leads to more complexity and a
heavier workload for processing that data set. This exemplifies why volume or any other of ‘big data’s’
characteristics should not be considered in isolation, but dependent on other data characteristics.
If we are looking at this interdependence, we can also try to explain the increase of data volume due
to variety. After all, variety also means, that the number of sources organizations leverage, extract,
integrate and analyse data from grows. Adding additional data sources to your pool also means
increasing the volume of the total data you try to leverage. Both, the number of potential data
2
8
e.g. machine learning workloads
2.1. DEFINITION AND CHARACTERISTICS OF BIG DATA
sources as well as the amount of data they generate, are growing. Sensors in technological artifacts3
or used for scientific experiments create a lot of data that needs to be handled. There is also a trend
to ‘datafy’4 our lives. People e.g. increasingly use body sensors to guide their workout routines.
Smartphones gather data while we use them or even just carry them with us. Alex Pentland describes
some of the ways how location data from smartphones can be used to get valuable insights [177].
However, it is not only additional data sources, but it is also a change in mindset that leads to
increased data volume. Or maybe expressed better: It is that change of mindset that also leads to
the urge of even adding new data sources. Motivated by the figures and promises outlined in Chapter
1.1 and some industrial success stories, companies nowadays consider data an important asset and its
leverage a possible competitive differentiator [147]. This leads, as mentioned above, to an urge to
unlock new sources of data and to utilize them within the organization’s analytics process. Examples
are the analysis of clickstreams and logs for web page optimization and the integration of social media
data and sentiment analysis into marketing efforts.
Clickstreams from web logs were for a long time only gathered for operational issues. Now new types
of analytics allowed organisations to extract additional value from those data sets, that were already
available to them. Another examples is Google Flutrends, where Google used already available data
(stored search queries) and applied it to another problem (predicting the development of flu pandemics)
[24, 107, 122]. In a more abstract way, this means that data can have additional value beyond the
value or purpose it was first gathered and stored for. Sometimes available data can just be reused
and sometimes it provides additional inside when integrated with new data sets [165, pp. 101-110].
As a result organisations start gathering as much data as they can and stop throwing unnecessary
data away as they might need it in the future [141][11, p. 7].
Furthermore more data is simply considered to give better results, especially for more complex
analytic tasks. Halevy et al. state, that for tasks that incorporate machine learning and statistical
methods creating larger data sets is favourable to developing more sophisticated models or algorithms.
They call this ‘the unreasonable effectiveness of data’ [127]. What they claim, is that for machine
learning tasks large training sets of freely available, but noisy and not annotated web data typically
yields a better result than smaller training sets of carefully cleaned and annotated data and the
use of complicated models. They exemplify that with data-driven language translation services and
state, that simple statistical models based on large memorized phrase tables extracted from prior
translations do a better job than models based on elaborate syntactic and semantic rules. A similar
line of argumentation is followed by Jeff Jones, chief scientist at IBM’s Entity Analytics Group, and
Anand Rajamaran, vice president at WalMart Global eCommerce and teacher of a web-scale data
mining class at Stanford University [140, 183, 184, 185].
2.1.3
Data Velocity
Velocity refers to the speed of data. This can be twofold. First, it describes the rate of new data
flowing in and existing data getting updated [83]. Agrawal et al. call this the ‘acquisition rate
challenge’ [45]. Second, it corresponds to the time acceptable to analyse the data and act on it while
it is flowing in, called ‘timeliness challenge’ [45]. These are essentially two different issues, that do not
necessarily need to occur at the same time, but often they do.
The first of this problems - the acquisition rate challenge - is what Tim Kraska calls ‘big throughput’
[147]. Typically the workload is transactional5 and the challenge is to receive, maybe filter, manage
3
e.g. in airplanes or machines
the term ‘datafication’ got coined by Viktor Mayer-Schönberger and Kenneth Cukier [165, pp. 73-97]
5
OLTP-like
4
9
CHAPTER 2. PROBLEM CONTEXT
and store fast and continuously arriving data6 . So, the task is to update a persistent state in some
database and to do that very fast and very often. Stonebraker et al. also suggest, that traditional
relational database management systems are not sufficient for this task, as they inherently process too
much overhead in the sense of locking, logging, buffer pool management and latching for multi-threaded
operation [213].
An example for this problem is the inflow of data from sensors or RFID systems, which typically
create an ongoing stream and a large amount of data [83, 141]. If the measurements from several
sensors need to be stored for later use, this is an OLTP-like problem involving thousands of writeor update operations per second. Another example are massively multiplayer games in the internet,
where commands of millions of players need to be received and handled, while maintaining a consistent
state for all players [213].
The challenge here lies in processing a huge amount of often rather small write operations, while
maintaining a somehow consistent, persistent state. One way to handle the problem, is to filter the
data, dismiss unnecessary and only store important data. This, however, requires an intelligent engine
for filtering out data without missing important pieces. The filtering itself will also consume resources
and time while processing the data stream. Furthermore it is also not always possible to filter data.
Another necessity is to automatically extract and store metadata, together with the streaming data.
This is necessary to track data lineage, which data got stored and how it got measured [45].
The second problem regards the timeliness of information extraction, analysis - that is identifying
complex patterns in a stream of data [213]- and reaction to incoming data. This is often called
stream analysis or stream mining [62]. McAfee and Brynjolfsson emphasize the importance to react
to inflowing data and events in (near) real-time and state that this allows organisations to get more
agile than the competition [166]. In many situations real-time analysis is indeed necessary to act
before the information gets worthless [45]. As mentioned it is not sufficient to analyse the data and
extract information in real-time, it is also necessary to react on it and apply the insight, e.g. to the
ongoing business process. This cycle of gaining insight from data analysis and adjusting a process or
the handling of the current case is sometimes called the feedback loop and the speed of the whole
loop (not of parts of it) is the decisive issue [11].
Strong examples for this are often customer-facing processes [92]. One of them is fraud detection
in online transactions. Fraud is often conducted not by manipulating one transaction, but within a
certain order of transactions. Therefore it is not sufficient to analyse each transaction on itself, rather
it is necessary to detect fraud patterns across transactions and within a user’s history. Furthermore,
it is necessary to detect fraud while the transactions are processed to deny the transactions or at
least some of them [45]. Another example is electronic trading, where data flows get analysed to
automatically make buy or sell decisions [213].
Mining streams is, however, not only about speed. As Babcock et al. [55] and Aggarwal [42] point
out, processing data streams has certain differences to processing data at rest, both in the approach
and the algorithms used. One important characteristic is, that the data from streams evolves over
time. Aggarwal [42] calls this ‘’temporal locality’. This means that patterns found in stream change
over time and are therefore dependent of the time interval or ‘sliding window’ [55] of the streaming
data that is considered through analysis. As streams are typically unbounded, it is often infeasible to
do analysis over the whole history, but historical processing is limited up to some point in time or for
some interval. Changing that interval can have an effect on the result of the analysis. On the other
hand, recognizing changing patterns can also be an analysis goal in itself, e.g. to timely react to a
changing buying behaviour.
6
10
‘drink from the firehose’
2.1. DEFINITION AND CHARACTERISTICS OF BIG DATA
Furthermore, to be feasible, streaming algorithms should ideally with one pass over the data, that is
touching each data point just once while it flows in. Together with the above mentioned unboundedness,
but also the unpredictability and variance of the data itself and rate at which it enters the system,
this makes stream processing reliant on approximation and sketching techniques as well as on
adaptive query processing [42, 55]. Considering these differences, it can be necessary to have distinct
functionality for both, e.g. just storing the streaming data in some intermediate, transient staging
layer and process it from there with periodical batch jobs might not be enough. This might be even
more important, if the data stream is not to be stored in its entirety, but data points get filtered out,
e.g. for volume reasons or because they are noise or otherwise not necessary. While the coverage of
streaming algorithms is not part of this thesis, which focusses more on the architectural view of the
‘’big data’ environment as a whole, I refer for an overview and a more detailed description to other
literature [41, 79].
While the processing of streaming data often takes place in a distinct component, it is typically still
necessary to access stored data and join it with the data stream. Most of the time it is, however, not
feasible to do this join, all the processing and pattern recognition at run-time. It is often necessary
to develop a model7 in advance, which can be applied and get updated by the streaming-in data.
The run-time processing gets thereby reduced to a more feasible amount of incremental processing.
That also means, that it is necessary to apply and integrate analytic models, which were created by
batch-processing data at rest, into a rule engine for stream processing [45, 231].
2.1.4
Data Variety
One driver of ‘big data’ is the potential to use more diverse data sources, data sources that were hard
to leverage before and to combine and integrate data sources as a basis for analytics. There is a rapid
increase of public available, text-focussed sources due to the rise of social media several years ago.
This accompanies blog posts, community pages and messages and images from social networks, but
there is also a rather new (at least in its dimension) source of data from sensors, mobile phones and
GPS [46, 166]. Companies e.g. want to combine sentiment analysis from social media sources with
their customer master data and transactional sales data to optimize marketing efforts. Variety hereby
refers to a general diversity of data sources. This not only implies an increased amount of different
data sources but obviously also structural differences between those sources.
On a higher level this creates the requirement to integrate structured data8 , semi-structured data9
and unstructured data10 [46, 83, 141]. On a lower level this means that, even if sources are structured
or semi-structured, they can still be heterogeneous, the structure or schema of different data sources
is not necessarily compatible, different data formats can be used and the semantics of data can be
inconsistent [130, 152].
Managing and integrating this collection of multi-structured data from a wide variety of sources poses
several challenges. One of them is the actual storage and management of this data in database-like
systems. Relational database management systems (RDBMS) might not be the best fit for all types
and formats of data. Stonebraker et al. state, that they are e.g. particularly ill-suited for array
or graph data [213]. Array shaped data is often used for scientific problems, while graph data is
important due to connections in social networks being typically shaped as graphs but also due to the
Linked Open Data Project [2] use of RDF and therefore graph-shaped data.
7
8
9
10
e.g. a machine learning model
data with a fixed schema, e.g. from relational databases or HTML tables
data with some structure, but a more flexible schema, e.g. XML or JSON data
e.g. plain text
11
CHAPTER 2. PROBLEM CONTEXT
Another challenge lies in the face of semi- and unstructuredness of data. Before this kind of data can
truly be integrated and analysed to mine source-crossing patterns, it is necessary to impose some
structure onto it [45, 46]. There are technologies available to extract entitities, relationships and other
information11 out of textual data. These lie mainly in the fields of machine learning, information
extraction, natural language processing and text mining. While there are techniques available for text
mining, there is other unstructured data which is not text. Therefore, there is also a need to develop
techniques for extracting information images, videos and the like [45]. Furthermore Agrawal et al.
expect that text mining will typically not be conducted with just one general extractor, but several
specialized extractors will be applied to the same text. Therefore they identify a need for techniques
to manage and integrate different extraction results for a certain data source [46].
This is especially true, when several textual sources need to be integrated, all of them structured
by using some extractors. In the context of integrating different data sources, different data - if its
initially unstructured, semi-structured or structured - needs to be harmonized and transformed to
adhere to some structure or schema that can be used to actually draw connections between different
sources. This is a general challenge of data integration and techniques for it are available as there is
an established, long-lasting research effort about data integration [46].
Broadly speaking there are two possibilities at which time information extraction and data harmonization can take place. One option is to conduct information extraction form unstructured sources and
data harmonization as a pre-processing step and store the results as structured or semi-structured data,
e.g. in a RDBMS or in a graph store. The second option is, to conduct information extraction and
data harmonization at runtime of an analysis task. The first option obviously improves the runtime
performance, while the second option is more flexible in the sense of using specialized extractors
tailored for the analysis task at hand. It is also important to note, that in the process of transforming
unstructured to structured data only that information is stored, that the information extractors were
build for. The rest might be lost. Following the ’Never-throw-information-away’ principle mentioned
in Chapter 2.1.2 it might therefore be valuable to additionally store original text data and use a
combined solution. In that case information extraction runs as a pre-processing steps, extracted
information gets stored as structured data, but the original text data keeps available and can be
accessed at runtime, if the extracted information is not sufficient for a particular analysis task. The
obvious drawback for this combined approach is a larger growth storage space needed.
Additionally, a challenge lies in creating metadata along the extraction and transformation process to
track provenance of the data. Metadata should include which source data is from, how it got recorded
there, what its semantics are, but also how it was processed during the whole analysis process, which
information extractors where applied etc. This is necessary to give users an idea where data used for
analysis came from and how reliable the results therefore are [45].
Data Sources
As mentioned with the growing ability to leverage semi- and unstructured data, the amount and
variety of potential data sources is growing as well. This Section is intended to give an overview about
this variety.
Soares classifies typical sources for ‘big data’ into 5 categories: Web and social media, machine-tomachine data, big transaction data, biometrics and human-generated data [202, pp. 10-12,143-209]:
11
12
e.g. the underlying sentiment
2.1. DEFINITION AND CHARACTERISTICS OF BIG DATA
Web Data & Social Media
The web is a rich, but also very diverse source of data for analytics. For one, there are web sources to
directly extract content - knowledge or public opinion - from, which are initially intended for a human
audience. These human-readable sources include crawling of web pages, online articles and blogs [83].
The main part of these sources is typically unstructured, including text, videos and images. However,
most of these sources have some structure, they are e.g. related to each other through hyperlinks or
provide categorization through tag clouds.
Next, there is web content and knowledge structured to provide machine-readability. It is intended
to enable applications to access the data, understand the data due to semantics, allow them to
integrate data from different sources, set them into context and infer new knowledge. Such sources are
machine-readable metadata integrated into web pages12 , initiatives as the linked open data project [2]
using data formats from the semantic web standard13 [3], but also publicly available web services.
This type of data is often graph-shaped and therefore semi-structured.
Other web sources deliver navigational data, that provide information how users interact with the
web and how they navigate through it. This data encompasses logs and clickstreams gathered by web
applications as well as search queries. Companies can e.g. use this information to get insight how
users navigate through a web shop and optimize its design based on the buying behaviour. This data
is typically semi-structured.
A last type of web data is data from social interactions. This can be communicational data, e.g. from
instant messaging services, or status updates in social media sites. On the level of single messages this
data is typically unstructured text or images, but one can impose semi-structure on a higher level, e.g.
indicating who is communicating with whom. Furthermore social interaction also encompasses data
describing a more structural notion of social connections, often called the social graph or the social
network. An example for this kind are the ‘friendship’ relations on facebook. This data is typically
semi-structured and graph-shaped. One thing to note is, that communicational data is exactly that.
This means, the information people publish about themselves on social media is for the means of
communication and presenting themselves. It is aiming at prestige and can therefore be biased, flawed
or simply just lied. This is why Alex Pentland prefers to work with more behavioural data like
locational data from phones, which he claims to tell ‘what you’ve chosen to do’ and not ‘what you
would kike to tell’ [177]. A concrete example location check-ins people post on foursquare, as they
often contain humorous locations that are you used to tell some opinion or make some statement [192].
Therefore one should be cautious how much trust to put into and which questions can be answered
by this kind of data .
It is also worth to mention, that these different types of web data are not necessarily exclusive. There
can be several overlaps. Social media posts can be both, human-readable publication of knowledge
and communicational. The same goes for blog posts, which often include a comment function which
can be used for discussion and is communicational. Another example is the Friend of a Friend (FOAF)
project [1]. It is connected to the semantic web and linked open data initiatives and can be used
to publish machine-readable data modelled as a RDF graph, but at the same time it falls into the
category of structural social interactions.
Machine-to-machine data
Machine to machine communication describes systems communicating with technical devices that
are connected via some network. The devices are used to measure a physical phenomenon like
movement or temperature and to capture events within this phenomenon. Via the network the devices
communicate with an application that makes sense of the measurements and captured events and
12
13
e.g. through the HTML <metadata> tag or microformats
RDF, RDFS and OWL
13
CHAPTER 2. PROBLEM CONTEXT
extracts information from them. One prominent example of machine to machine communication is
the idea of the ‘internet of things’ [202, p. 11].
Devices used for measurements are typically sensors, RFID chips or GPS receiver. They are often
embedded into some other system, e.g. sensors for technical diagnosis embedded into cars or
smartmeters in the context of ambient intelligence in houses. The data created by these systems can
be hard to handle. The BMW group e.g. predicts its Connected Drive cars to produce one petabyte
per day in 2017 [168]. Another example are GPS receivers, often embedded into mobile phones but
also other mobile devices. The later is an example of a device that creates locational data, also called
spatial data [197]. Alex Pentland emphasizes the importance of this kind of data as he claims it to be
close to peoples’ actual behaviour [177]. Machine to machine data is typically semi-structured.
Big transaction data
Transactional data grew with the dimensions of the systems recording it and the massive amount
of operations they conduct [83]. Transactions can e.g. be purchase items from large web shops, call
detail records from telecommunication companies or payment transactions from credit card companies.
These typically create structured or semi-structured data. Furthermore, big transactions can also
refer to transactions that are accompanied or formed by human-generated, unstructured, mostly
textual data. Examples here are call centre records accompanied with personal notes from the service
agent, insurance claims accompanied with a description of the accident or health care transactions
accompanied with diagnosis and treatment notes written by the doctor.
Biometrics
Biometrics data in general is data describing a biological organism and is often used to identify
individuals (typically humans) by their distinctive anatomical and behavioural characteristics and traits.
Examples for anatomical characteristics are fingerprints, DNA or retinal scans, while behavioural
refers e.g. to handwriting or keystroke analysis [202]. One important example of using large amounts
of biometric data are scientific applications for genomic analysis.
Human-generated data
According to Soares human-generated data refers to all data created by humans. He mentions
emails, notes, voice recording, paper documents and surveys [202, p. 205]. This data is mostly
unstructured. It is also apparent, that there is a strong overlap with two of the other categories,
namely big transaction data and web data. Big transaction data that is categorized as such because it
is accompanied by textual data, e.g. call centre agents’ notes, have an obvious overlap. The same goes
for some web content, e.g. blog entries and social media posts. This shows, that the categorization is
not mutally exclusive, but data can be categorized in more than one category.
2.1.5
Data Veracity
According to a dictionary veracity means “conformity with truth or fact”. In the context of ‘big data’
however, the term describes rather the absence of this characteristics. Put differently veracity refers
to the trust into the data, which might be impaired by the data being uncertain or imprecise [231, pp.
14-15].
There are several reasons for uncertainty and untrustworthiness of data. For one, when incorporating
different data sources it is likely, that the schema of the data is varying. The same attribute name
or value might relate to different things or different attribute names or value might relate to the
same thing. Jeff Jones, chief scientist at IBM’s Entity Analytics Group, therefore claims that ‘there
is no such thing as a single version of the truth’ [139]. In fact, in the case of unstructured data
there is not even a schema and in the case of semi-structured data the schema of the data is not as
14
2.1. DEFINITION AND CHARACTERISTICS OF BIG DATA
exact and clearly defined as it uses to be in more traditional data warehousing approaches, where
data is carefully cleaned, structured and adhering to a relational specification [130]. In the case of
unstructured data, where information first needs to be extracted, this information is often extracted
with some probability and therefore not completely certain. In that sense, variety directly works
against veracity.
Furthermore, the data of an individual source might be fuzzy and untrustworthy as well. Boyd and
Crawford state, that in the face of ‘big data’ duplication, incompleteness and unreliability need to be
expected. This is especially true for web sources and human-generated content [73]. Humans are often
not telling the truth or withholding information, sometimes intentionally, sometimes just because
of mistakes and error. Agrawal et al. give several examples for such behaviour. Patients decide to
hold back information about risky or embarrassing behaviour and habits or just forget about a drug
they took before. Doctors might mistakenly provide a wrong diagnosis [45]. If there are humans in a
process, there might always be some error or inconsistency.
There are several possibilities to handle imprecise, unreliable, ambiguous or uncertain data. The
first approach is typically used in traditional data warehousing efforts and implies a thorough data
cleansing and harmonisation effort during the ETL process, that is at the time of extracting the data
from its sources and loading it into the analytic system. That way data quality 14 and trust is ensured
up front and the data analysis itself is based on a trusted basis. In the face of ‘big data’ this is often
not feasible, especially when hard velocity requirements are present, and sometimes simply infeasible,
as (automatic) information extraction from unstructured data is always based on probability. Given
the variety of data it is likely, that there still remains some incompleteness and errors in data, even
after data cleaning and error correction [45].
Therefore it is always necessary to handle some errors and uncertainness during the actual data
analysis task and manage ‘big data’ in context of noise, heterogeneity and uncertainness [45]. There
are again essentially two options. The first option is, to do a data cleaning and harmonization step
directly before or during the analysis task. In that case, the pre-processing can be done more specific
to the analysis task at hand and therefore often be leaner. Not every analysis task needs to be
based on completely consistent data and retrieve completely exact results. Sometimes trends and
approximated results suffice [130].
The second option to handle uncertain data during the analysis task at hand is also based on the
notion, that some business problems do not need exact results, but results ‘good enough’ - that is
with a probability above some threshold - are ‘good enough’ [130]. So, uncertain data can be analysed
without cleaning, but the results are presented with some probability or certainty value, which is also
impacted by the trust into the underlying data sources and their data quality. This allows users to get
an impression of how trustworthy the results are. For this option it is even more crucial thoroughly
track data provenance and its processing history [45].
2.1.6
Data Value
While the other four characteristics were used to describe the underlying data itself, value refers to
the processing of the data and the insights produced during analysis. Data is typically gathered with
some immediate goal. Put differently, gathered data offers some immediate value due to the first time
use the data was initially collected for. Of course, data value is not limited to a one-time use or to the
initial analysis goal. The full value of data is determined by possible future analysis tasks, how they
get realized and how the data is used over time. Data can be reused, extended and newly combined
14
e.g. consistency
15
CHAPTER 2. PROBLEM CONTEXT
with another data set [165, pp. 102-110]. This is the reason why data is more and more seen as an
asset for organisations and the trend is to collect potential data even if it is not needed immediately
and to keep everything assuming that it might offer value in the future [141].
One reason why data sets in the context of ‘big data’ offer value, is simply that some of them are
underused due to the difficulty of leveraging them due to their volume, velocity or lack of structure.
They include information and knowledge which just was not practical to extract before. Another
reason for value in ‘big data’ sources is their interconnectedness, as claimed by Boyd and Crawford.
They emphasize that data sets are often valuable because they are relational to other data sets about
a similar phenomenon or the same individuals and offer insights when combined, which both data sets
do not provide if they are analysed on their own. In that sense, value can be provided when pieces of
data about the same or a similar entity or group of entities are connected across different data sets.
Boyd and Crawford call this ‘fundamentally networked’ [73].
According to the McKinsey Global Institute there are five different ways how this data creates value.
It can create transparency, simply by being more widely available due to the new potential to leverage
and present it. This makes it accessible to more people who can get insights and draw value out of it
[163].
It enables organisations to set up experiments, e.g. for process changes, and create and analyse
large amounts of data from these experiments to identify and understand possible performance
improvements [163].
‘Big data’ sets can be used and analysed to create a more detailed segmentation of customers or other
populations to customize actions and tailor specific services. Of course, some fields are already used
to the idea of segmentation and clustering, e.g. market segmentation in marketing. They can gain
additional value by conducting this segmentation and a more detailed micro-level or by doing it in
real-time. For other industries this approach might be new and provide an additional value driver
[163].
Furthermore the insights of ‘big data’ analysis can support human decision making by pointing to
hidden correlations, potential effects to an action or some hidden risks. An example are risk or
fraud analysis engines for insurance companies. In some cases low level decision making can even be
automated to those engines [163].
Finally, according to the McKinsey Global Institute ‘big data’ can enable new business models,
products and services or improve existing ones. Data about how products or services are used can be
leveraged to develop and improve new versions of the product. Another example is the advent of
real-time location data which lead to completely new services and even business models [163].
To create this value the focus of ‘big data’ gets focussed on more complex, ‘deep’ analysis [83].
Stonebraker et al. also claim, that conventional, SQL-driven analytics on massive data sets are
available and well-solved by the data warehouse community, but that it is more complex analytics
tasks on massive data sets, that needs attention in ‘big data’ research. They name predictive modelling
of medical events or complex analysis tasks on very large graphs as examples [213]
In that sense, ‘big data’ is also connected with a shift to more sophisticated analysis methods
compared to simple reports or OLAP exploration in traditional data warehouse approaches. This
includes semantic exploration of semi- or unstructured data, machine learning and data mining
methods, multivariate statistical analysis and multi-scenario analysis and simulation. It also includes
visualization of the entire or parts of the data set and of the results and insights gained by the above
mentioned advanced analysis methods [62].
16
2.2. REFERENCE ARCHITECTURES
2.2
Reference Architectures
2.2.1
Definition of the term ‘Reference Architecture’
Before defining the term ‘reference architecture’, we must first establish an understanding of the term
‘architecture’. Literature offers several definition to describe this later term. Some of the most widely
adopted are the following:
Garlan & Perry 1995: The structure of the components of a program/system, their
interrelationships, and principles and guidelines governing their design and evolution over
time. [116]
iEEE Standard 1471-2000: Architecture is the fundamental organization of a system
embodied in its components, their relationships to each other and to the environment and
the principles guiding its design and evolution. [4]
Bass et al. 2012: The software architecture of a system is the set of structures needed to
reason about the system, which comprise software elements, relations among them, and
properties of both. [60, p. 4]
All these definitions have in common, that they describe architecture to be about structure and that
this structure is formed by components or elements and the relations or connectors between them.
Indeed this is the common ground that is accepted in almost all publications [59, 123, 151, 193]. The
term ‘structure’ points to the fact, that an architecture is an abstraction of the system described in
a set of models. It typically describes the externally visible behaviour and properties of a system
and its components [59], that is the general function of the components, the functional interaction
between them by the mean of interfaces and between the system and its environment as well as
the non-functional properties of the elements and the resulting system 15 [193]. In other words, the
architecture abstracts away from the internal behaviour of its components and only shows the public
properties and behaviour visible due to interfaces.
However, an architecture typically has not only one, but several ‘structures’. Most more current
definitions support this pluralism [59, 60, 123]. Different structures represent different views onto the
system. These describe the system along different levels of abstraction and component aggregation,
describe different aspects of the system or decompose the system and focus on subsystems add citation.
A view is materialized in one or several models.
As mentioned, an architecture is abstract in terms of the system it describes, but it is concrete in the
sense of it describing a concrete system. It is designed for a specific problem context and describes
system components, their interaction, functionality and properties with concrete business goals and
stakeholder requirements in mind. A reference architecture abstracts away from a concrete system,
describes a class of systems and can be used to design concrete architectures within this class. Put
differently a reference architecture is an ‘abstraction of concrete software architectures in a certain
domain’ and shows the essence of system architectures within this domain [52, 114, 172, 173].
A reference architecture shows which functionality is generally needed in a certain domain or the solve
a certain class of problems, how this functionality is divided and how information flows between the
pieces (called the reference model). It then maps this functionality onto software elements and the data
flows between them [59, pp. 24-26][222, pp. 231-239]. Within this approach reference architectures
incorporate knowledge about a certain domain, requirements, necessary functionalities and their
interaction for that domain together with architectural knowledge how to design software systems,
15
e.g. security and scalability
17
CHAPTER 2. PROBLEM CONTEXT
their structures, components and internal as well as external interactions for this domain which fulfil
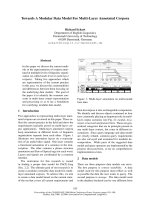
the requirements and provide the functionalities (see Figure 2.1) [52, 173][222, pp. 231-239].
Figure 2.1: Elements of a Reference Architecture [222, p. 232]
The goal of bundling this kind of knowledge into a reference architecture is to facilitate and guide
future design of concrete system architectures in the respective domain. As a reference architecture is
abstract and designed with generality in mind, it is applicable in different contexts, where the concrete
requirements of each context guide the adoption into a concrete architecture [52, 85, 172]. The level
of abstraction can however differ between reference architectures and with it the concreteness of
guidance a reference architecture can offer [114].
2.2.2
Reference Architecture Methodology
While developing a reference architecture, it is important to keep some of the points mentioned in
Section 2.2.1 in mind. The result should be relevant to a specific domain, that is incorporate domain
knowledge and fulfil domain requirements, while still being general enough to be applicable in different
contexts. This means that the level of abstraction of the reference architecture and its concreteness of
guidance need to be carefully balanced. Following a design method for reference architectures helps
accomplishing that and the basis for the reference architecture to be well-grounded and valid as well
as to provide rigour and relevance.
However, the research about reference architectures and respective methodology is significantly more
rare than that about concrete architectures. The choice of design methods in that space is therefore
rather limited and the one proposed by Galster and Avgeriou [114] is to the best of my knowledge
the most extensive and best grounded of those. Therefore I decided to loosely follow the proposed
development process, which consists of the following 6 steps, which are distributed across this thesis.
Step 1: Decide on the reference architecture type
Deciding about a particular type of reference architecture helps to fix its purpose and the context to
place it in. The characterisation of the reference architecture and its type will be described in Section
2.2.3. This guides the design and some overarching design decisions as described in the same Section.
Step 2: Select the design strategy
The second step is to decide, if the reference architecture will be designed from scratch (researchdriven) or designed based on existing architecture artifacts within the domain (practice-driven). As
Galster and Avgeriou [114] point out, the design strategy should be synchronized with the reference
architecture type chosen in step 1. Therefore, the selection of the design decision will be made at the
end of Section 2.2.3.
18
2.2. REFERENCE ARCHITECTURES
Step 3: Empirical acquisition of data
The third step is about identifying and collecting data and information from several sources. It
is generally proposed to gather data from people (customers, stakeholders, architects of concrete
architectures), systems (documentations) and literature [114]. As the scope of this thesis does not
allow to use comprehensive interviews or questionnaires, the reference architecture will mainly be
based on the later two. It will involve document study and content analysis of literature about ‘big
data’ including industrial case studies, white papers, existing architecture descriptions and academic
research papers. A first result of the literature study is the establishment of requirements the resulting
reference architecture will be based on. These requirements will be presented in Chapter 3.
Step 4: Construction of the reference architecture
After the data acquisition, the next step is to construct the reference architecture, which will be
described in Chapter 4. As pointed out in Section 2.2.1, an architecture consists of a set of models.
Constructing the reference architecture therefore means to develop these models. To structure the set
of models Galster and Avgeriou [114] agree with the general recommendation within the software
architecture literature to use the notion of views [60, pp. 9-18,331-344][193, pp. 27-37][222, pp. 76-92].
According to the respective iEEE and ISO standards for the design of software architectures[4, 7], a
view consists of one or several models that represent one or more aspects of the system particular set
of stakeholder concerns. In that sense a view targets a specific group of stakeholders and allows them
to understand and analyse the system from their perspective filtering out elements of the architecture
which are of no concern for that specific group. This enhances comprehensibility by providing a set
concise, focussed and manageable models instead of putting every aspect of the system into one big,
complex model which would be hard or impossible to understand. All views together describe the
system in its entity, the different views are related and should of course not be inconsistent.
Step 5: Enabling reference architecture with variability
I will omit this step and I will not add specific annotations, variability models or variability views.
I consider the variability to be inherit in the abstractness of the reference architecture. I aim for
completeness regarding the functional components, so variability can be implemented by choosing the
functionality required for a concrete architecture based on its requirements, while leaving unwanted
functionality out. Furthermore the last step, the mapping to technology and software platforms will
not be a fixed 1:1 mapping, but more loosely discuss several options and choices of technology and
software to implement a functional component. It will also not be fixed towards specific industrial
products. This provides the freedom to make this choice based on the concrete situation. This freedom
is also necessary, considering the whole ‘big data’ space is not completely mature yet, under steady
development and new technologies will still arise during the next couple of years.
Step 6: Evaluation of the reference architecture
Unfortunately it will not be possible to evaluate the reference architecture within a concrete project
situation due to the scope of this work, but also due to the lack of access to such a project situation.
The evaluation and verification will therefore rely on mapping the reference architecture to concrete
‘big data’ architectures described in research papers and industrial whitepapers and reports. This will
be done in Chapter 5 and allows to evaluate the completeness, correctness, compliance and validity of
the reference architecture [114].
19
CHAPTER 2. PROBLEM CONTEXT
2.2.3
Classification of the Reference Architecture and general Design Strategy
As mentioned in Section 2.2.1, reference architectures can have different levels of abstraction. However,
this is not the only major characteristic they can differ in. To design a reference architecture it is
important to first decide its type, mainly driven by the purpose of the reference architecture. Galster
and Avgeriou [114] mention the decision on the type of the reference architecture as the first step in
its design and propose a classification method by Angelov et al. [51].
I will follow this proposition but will use a more recent publication of the same authors, in which
they extend their initial work [52] to determine the type of a reference architecture. They base their
framework on the three dimensions context, goals and design and describe complex interrelations
between these dimensions (see Figure 2.2). The architecture goals limit the possible context of the
architecture definition and impact its design. The other way round, architecture design and context
dictate if the goals can be achieved. Furthermore design choices are made within a certain context
and therefore influenced by it. A design choice might also imply a certain context, while it would not
be valid in another.
Figure 2.2: Interrelation between architecture goals, context and design [52]
All these dimensions have a couple of sub-dimensions. However, as hinted on above, not every
combination of these dimensions is valid. Angelov et al. call a reference architecture ‘congruent’,
if the goals fit into the context and both are adequately represented within the design. Reference
architecture types are then valid, specific value combinations within this dimensional space [52].
Reference Architecture Goals
This dimension classifies the general goal of a reference architecture and typically drives decisions
about the other two dimensions. While goals in practice are quite diverse and could be classified
in more detail, Angelov et al. postulate, that a coarse-granular classification between reference
architectures aimed at standardization of concrete architectures and those aimed at facilitation of
concrete architectures is sufficient to describe the interplay with the context and design dimension
[52].
Reference Architecture Context
The context of a reference architecture classifies the situation in which it gets designed and possible
situations in which it can get applied. First, it classifies the scope of its design and application,
that is if it is designed and intended to be used within a single organization16 or in multiple
organizations [52].
Second, it classifies the stakeholders that participate in either requirements definition or
design of the reference architecture. These can be software organizations that intend to develop
16
20
In this case a reference architecture is sometimes also called a standard architecture for the respective organization
2.2. REFERENCE ARCHITECTURES
software based on the reference architecture, user organizations that apply software based on the
reference architecture or independent organizations17 [52].
Third, the context defines also the time a reference architecture gets developed compared
to the existence of relevant concrete systems and architectures. It is necessary to decide if the
reference architecture gets developed before any systems implemented the architecture and their
entire functionality in practice (preliminary) or as a accumulation of experience from existing systems
(classical). Typically reference architectures were based on knowledge from existing systems and their
architecture and therefore on concepts proven in practice [85, 171]. That is, they are often classical
reference architectures. However, a reference architecture can also be developed before respective
technology or software systems actually exist or they might enhance and innovate beyond the existing,
concrete architectures in the domain. In that case, they are preliminary [52].
Reference Architecture Design
The design of a reference architecture can be faced with a lot of design decisions and they way it is
designed can therefore differ in multiple ways. This dimensions helps to classify some of the general
design decisions. First, it can be classified by the element types it defines. As stated in most of the
definitions of the term ‘software architecture’ in Chapter 2.2.1, an architecture typically incorporates
components, connectors between components and the interfaces used for communication. Another
mentioned element type are policies and guidelines. Furthermore a reference architecture can possibly
also include descriptions of protocols and algorithms used [52].
Second, there needs to be a decision on which level of detail the reference architecture should be
designed. Angelov et al. propose a broad classification into detailed, semi-detailed and aggregated
elements and the classification can be done individually for each element type mentioned above [52].
The level of detail refers to the number of different elements. While in a more detailed reference
architecture different sub-systems are modelled as individual element, in a more aggregated reference
architecture sub-systems are not explicitly modelled. It is however difficult to provide a formal
measure to distinguish between detailed, semi-detailed and aggregated reference architectures based
on the number of elements. In a complex domain an aggregated reference architecture can still
contain a lot of elements. The classification is therefore more a imprecise guideline, but Angelov et al.
consider this sufficient for the purpose of their framework. It should also be noted, that reference
architectures can comprise different aggregation levels to support different phases of the design or for
communication with different stakeholders.
Third, the level of abstraction of the reference architecture can be classified. It is important to
distinguish between abstraction and aggregation as described in the previous sub-dimension. While
aggregation refers to how detailed sub-elements are modelled, abstraction refers to how concrete
decisions about functionality and used technology are. The sub-dimension differentiates between
abstract, semi-concrete and concrete reference architectures. While an abstract reference architecture
specifies the nature of the elements in a very general way, e.g. general functionality, a concrete
architecture describes very specific choices for each element, e.g. a concrete vendor and software
product. A semi-concrete reference architecture lies in between and couples elements to a class of
products or technology [52].
Fourth, reference architectures are classified according to the level of formalization of the specification. Informal reference architectures are specified in natural language or some graphical ad-hoc
notation. Semi-formal specifications use an established modelling language with clearly defined
semantics, but one that has no formal or mathematical foundation, e.g. UML. A formal specification
uses a formal architecture language, e.g. C2 or Rapide, that has a thorough mathematical foundation
and strictly defined semantics [52].
17
Independent organizations can e.g. be research, standardization, non-profit or governmental organizations
21
CHAPTER 2. PROBLEM CONTEXT
Dimension
G1: Goal
C1: Scope
C2: Timing
C3: Stakeholders
D1: Element Types
D2: Level of Detail
D3: Level of Abstraction
D4: Level of Formalization
Classification
Facilitation
Multiple Organizations
Classical
Independent Organization (Design)
Software Organizations (Requirements)
User Organizations (Requirements)
Components
Interfaces
Policies / Guidelines
Semi-detailed components and policies / guidelines
Aggregated or semi-detailed interfaces
Abstract or semi-concrete elements
Semi-formal element specifications
Table 2.1: Characteristics of Reference Architectures Type 3 [52]
Application of the Reference Architecture Framework
The framework described above can be applied to guide the design of reference architectures. It can
do so, by providing five architecture types placed in the classification space, that the authors claim
to be valid and congruent. Reference architectures that cannot be mapped to one of these types
are considered incongruent. When designing a new reference architecture these predefined types can
be used as guidance for the general design decisions. The application of the framework starts with
assessing the general goal and the contextual scope and timing of the planned reference architecture.
The result of these decisions can then be mapped against the framework to determine the fitting
reference architecture type. If no type fits to the respective choices for goals and context it is a strong
indication, that these choices should be revised. Otherwise, the next step after mapping the type, is
to ensure, that input from the stakeholders specified in the chosen type is available. If this is not
possible, the goals and context should again be revised to fit to the available stakeholder input or the
design effort should be stopped. If a match is found, the general design decisions can be taken as
guidelines from the identified type [52].
As described in the problem statement (Chapter 1.2), this thesis aims to give an overview of existing
technology within the ‘big data’ space, put it into context and help architects designing concrete
system architectures. Therefore, the general goal according to the framework is clearly facilitation.
This rules out the choice of classical reference architectures aimed at standardization for both, multiple
organizations (type 1) and within a single organization (type 2). The scope of the reference architecture
will not be focussed onto one organization, but it is intended to be general enough to be applicable
in multiple organizations, making a classical, facilitation architecture to be used within a single
organization (type 4) a poor choice. Furthermore, there already exist multiple system in the ‘big
data’ space and much of the underlying technology is available and proven. According to the timing
sub-dimensions the reference architecture can thus be classified as classical. Mapped against the
framework, a classical, facilitation reference architecture to be used in multiple organizations (type 3)
is therefore the fitting choice (see Table 2.1) and not a preliminary, facilitation architecture (type 5),
which aims to guide and move the design of future systems forward.
A type 3 reference architecture is a ‘classical, facilitation architecture designed for multiple organizations by an independent organization’ [52]. This kind of reference architecture is developed by an
independent organization, typically a research center, based on existing knowledge and experience
about respective architectures in research and industry. One critical point and possible weakness of
22