The Use Of Management Accounting Practices In Malaysian Smes
Bạn đang xem bản rút gọn của tài liệu. Xem và tải ngay bản đầy đủ của tài liệu tại đây (2.68 MB, 365 trang )
THE USE OF MANAGEMENT ACCOUNTING PRACTICES IN
MALAYSIAN SMES
Submitted by
Kamilah Ahmad
to the
University of Exeter
as a thesis for the degree of
Doctor of Philosophy in Accountancy
May 2012
1
Declaration
This thesis is available for Library use on the understanding that it is copyright material
and that no quotation from the thesis may be published without proper
acknowledgement.
I certify that all material in this thesis which is not my own work has been identified and
that no material has previously been submitted and approved for the award of a degree
by this or any other University.
(signature).........................................................................................
2
ABSTRACT
There have been the recent calls for additional research in order to enhance the
understanding of the adoption of management accounting practices (MAPs) in small
and medium sized enterprises (SMEs). This, allied to an increasing importance of SMEs
around the world especially in developing countries, is the motivation for this research.
This research explores the uptake of a broad range of MAPs in Malaysian SMEs;
identifies the roles of MAPs in the management of SMEs; determines factors that affect
the extent of use of MAPs in SMEs and lastly examines the relationship between the use
of MAPs and organizational performance of SMEs. A postal questionnaire was
conducted to 1,000 Malaysian SMEs in manufacturing sector which elicited 160 useable
responses.
The results show that the majority of respondents have used the five management
accounting areas identified. Use of the costing system, budgeting system and
performance evaluation system are significantly higher than for the decision support
system and strategic management accounting, which indicates that the uptake of
traditional MAPs is greater than for sophisticated MAPs. The results indicate that
medium sized firms make greater use of all MAPs as opposed to small sized enterprises.
The most significant differences relate to the use of decision support system and
strategic management accounting. The increased uptake of sophisticated MAPs by
larger firms is in line with size being a contingent variable explaining the use of such
practices.
The results also suggest that MAPs were perceived as playing very important roles in
the management of Malaysian SMEs. Performance evaluation and controlling activities
were the major roles of MAPs in the management of SMEs. Overall the study suggests
3
that MAPs are perceived by SMEs as relevant and useful in their management
processes.
Further, the study found that four out of five contingent factors; size of the firm,
intensity of market competition; participation of the owner/manager in the development
of MAPs in firm and advanced manufacturing technology have a positive and
statistically significant relationship with the use of certain MAPs.
The research
however found weak support for the positive relationship between the use of MAPs and
organizational performance of SMEs.
This study enriches the existing body of knowledge of management accounting by
providing information as to the use of MAPs in SMEs in Malaysia. The findings can be
specifically informative for policy makers intent on developing management accounting
skills among Malaysian SMEs. This research will provide valuable insights into the
nature of MAPs in SMEs in a developing country and will promote interest among
Malaysian researchers as well as researchers of other countries to make the SME sector
a focus of interest in management accounting research.
4
LIST OF CONTENTS
Declaration
2
Abstract
3
List of Contents
5
List of Tables
9
List of Figures
12
List of Abbreviations
13
Acknowledgment
15
Chapter 1: Introduction
1.1
1.2
1.3
1.4
1.5
1.6
1.7
1.8
Introduction
Background
Problem statement
Research objectives
Research questions
Hypotheses
Importance of the study
Research methodology
1.8.1 Research process
1.9 Organisation of the thesis
1.10 Summary
16
16
18
21
22
22
22
23
24
25
28
Chapter 2: Management accounting overview
2.1 Introduction
2.2 History and development of management accounting
2.2.1 The changing focus and innovation of management accounting
2.2.2 The changing roles of the management accountant
2.2.3 Definition of management accounting
2.2.3.1 Institute of Management Accountant (IMA)
2.2.3.2 Chartered Institute of Management Accounting (CIMA)
2.2.3.3 International Federation of Accountants (IFACs)
2.2.3.4 Summary
2.3 Drivers of change in management accounting
2.4 Summary
29
29
33
37
38
38
39
40
41
41
43
Chapter 3: Small and medium-sized enterprises (SMEs) in Malaysia
3.1 Introduction
3.2 The importance of SMEs
3.2.1 The contribution of Malaysian SMEs
3.3 The development of SMEs
3.3.1 The Malaysian economy
3.3.2 The role of the Malaysian government
3.3.3 Opportunities and challenges for SMEs
3.4 Definition of SMEs
3.5 An overview of SMEs and their key sectors
3.5.1 Number of establishments
3.5.2 SMEs by sector
3.5.3 Size of SMEs
3.5.4 Size and sectors of SMEs
5
44
44
45
47
47
49
51
54
55
55
56
56
57
3.5.5 SMEs activities
3.5.5.1 Activities of the service sector
3.5.5.2 Activities of the agriculture sector
3.5.5.3 Activities of the manufacturing sector
3.5.6 Contribution of SMEs to the Malaysian SMEs
3.5.6.1 Performance of the SMEs sector in term of total output, value
added and employment
3.6 Research relating to Malaysian SMEs
3.7 Summary
58
58
59
59
60
61
64
68
Chapter 4: Literature review, key research areas and development of hypotheses
4.1 Introduction
4.2 Research into management accounting practices
4.2.1 Management accounting practices in developed countries
4.2.1.1 European research
4.2.1.2 US research
4.2.1.3 Asia-Pacific research
4.2.2 Management accounting practices in developing countries
4.2.2.1 China
4.2.2.2 Middle East
4.2.2.3 South East Asia
4.2.2.4 Other developing countries
4.2.3 Research into specific area of management accounting practices
4.2.3.1 Costing
4.2.3.2 Budgeting
4.2.3.3 Performance evaluation
4.2.3.4 Decision support system
4.2.3.5 Strategic management accounting
4.2.4 Management accounting in SMEs
4.2.5 Summary
4.3 The role of management accounting in the management of an organization
4.3.1 Summary
4.4 Management accounting within a contingency framework
4.4.1 Early contingency studies
4.4.2 An organizational framework for contingency-based management control
system (MCS) research
4.4.2.1 Evidence from SMEs
4.4.3 An organizational framework for contingency-based management
accounting practices (MAPs) research
4.4.3.1 Evidence from SMEs
4.4.4 Summary
4.5 Management accounting practices and organizational performance
4.5.1 Positive results
4.5.2 Negative results
4.5.3 Types of performance measures used in the literature
4.5.4 Summary
4.6 Overall summary
69
70
71
72
73
75
75
76
76
78
78
79
81
84
87
88
90
90
95
99
100
101
104
111
112
116
117
125
126
131
132
133
135
Chapter 5: Research design and methodology
5.1 Introduction
5.2 Research design
5.3 Sample selection method
5.3.1 Target population
5.3.2 Sampling method
5.3.3 Sample size
5.4 The method of data collection
138
139
140
140
142
145
149
6
5.5 Measurement and scaling
5.5.1 Questionnaire design
5.5.2 Reliability and validity
5.6 Method of data analysis
5.7 Summary
150
152
160
161
162
Chapter 6: Management accounting practices in Malaysian SMEs: Descriptive results
6.1 Introduction
6.2 Response rate
6.2.1 Non-response bias
6.2.1.1 Comparisons between the sample frame and the responding
companies based on number of employees and type of manufacturing
activities
6.2.1.2 Comparison of the characteristics of the profiles of ‗early‘ and
‗late‘ respondents
6.3 Profile of respondents
6.4 Extent of the use of management accounting practices
6.4.1 The use of management accounting practices
6.4.2 The extent of the use of management accounting practices
6.4.2.1 Part A: Costing system
6.4.2.2 Part B: Budgeting system
6.4.2.3 Part C: Performance evaluation system
6.4.2.4 Part D: Decision support system
6.4.2.5 Part E: Strategic management accounting
6.5 Factors which affect of the extent of the use of MAPS
6.5.1 Part A: Intensity of market competition
6.5.2 Part B: Accounting staff employment
6.5.3 Part C: Participation of owner/manager of firms
6.5.4 Part D: Use of advanced manufacturing technology
6.6 Performance of the firm
6.7 The roles of management accounting
6.8 Summary
163
163
165
166
168
169
171
171
174
174
178
182
186
189
192
192
193
194
195
196
197
198
Chapter 7: Bivariate analysis
7.1 Introduction
7.2 Bivariate association analysis
7.3 Tests for an association between management accounting practices and selected
contingent factors
7.3.1 Size of the firm (Annual sales turnover)
7.3.2 Intensity of market competition
7.3.3 Participation of owner/manager
7.3.4 Advanced manufacturing technology (AMT)
7.3.5 The level of qualification of accounting staff
7.3.6 Tests for an association between the use of management accounting
practices and industry type
7.4 Additional analysis: Tests for an association between the selected contingent
factors and frequency of use of management accounting techniques
7.4.1 Contingent variables and costing techniques
7.4.2 Contingent variables and budgeting techniques
7.4.3 Contingent variables and performance evaluation techniques
7.4.4 Contingent variables and decision support techniques
7.4.5 Contingent variables and strategic management accounting techniques
7.5 Association analysis of management accounting practices and perceptions of
firm performance
7.5.1 Costing system and perceptions of firm performance
7.5.2 Budgeting system and perceptions of firm performance
7
205
206
206
209
211
213
214
217
219
222
223
224
225
226
227
231
233
234
7.5.3 Performance evaluation system and perceptions of firm performance
7.5.4 Decision support system and perceptions of firm performance
7.5.5 Strategic management accounting and perceptions of firm performance
7.5.6 Association analysis of industry type and perceptions of firm performance
7.6 Additional analysis: Test for an association of the frequency of use of
management accounting techniques and perceptions of firm performance
7.6.1 Costing techniques and perceptions of firm performance
7.6.2 Budgeting techniques and perceptions of firm performance
7.6.3 Performance evaluation techniques and perceptions of firm performance
7.6.4 Decision support techniques and perceptions of firm performance
7.6.5 Strategic management accounting techniques and perceptions of firm
performance
7.7 Summary
236
238
239
241
243
244
246
247
248
250
252
Chapter 8: The multivariate analysis
8.1 Introduction
8.2 Logistic regression analysis
8.2.1 Logit regression: Model and underlying assumption
8.2.2 Multicollinearity between independent variables
8.3 Important statistics in the logit regression analysis
8.4 Binary logistic regression analysis testing for a relationship between the use of
management accounting practices and a range of contingent factors which affect
the extent of the use of MAPS
8.4.1 Binary logit regression model
8.4.2 Factors that affect the use of a costing system
8.4.3 Factors that affect the use of a budgeting system
8.4.4 Factors that affect the use of a performance evaluation system
8.4.5 Factors that affect the use of a decision support system
8.4.6 Factors that affect the use of strategic management accounting
8.4.7 Additional analysis: Binary logistic regression analysis in factors related
to the use of management accounting practices (with level of qualification of
accounting staff)
8.5 Ordinal logistic regression analysis testing for a relationship between the use of
management accounting practices and perceptions on the level of firm performance.
8.5.1 Background of ordinal logistic regression
8.5.2 The ordinal regression model (Cumulative odds (CO) logit models)
8.6 The ordinal regression between the use of management accounting practices and
perception of firm performance.
8.6.1 Management accounting techniques and perceptions of performance in
the level of productivity
8.6.2 Management accounting techniques and perceptions of performance in
product quality
8.6.3 Management accounting techniques and perceptions of performance in
the number of deliveries on time
8.6.4 Management accounting techniques and perceptions of performance in
sales growth rate
8.6.5 Management accounting techniques and perceptions of performance in
operating profit growth rate
8.6.6 Management accounting techniques and perceptions of performance in
cash flow growth rate
8.7 Summary
8.7.1 Possible relationship between the use of management accounting
practices and contingent factors
8.7.2 Comparison of results with previous research.
8.7.3 Possible relationship between perceptions of firm performance and the
use of management accounting practices
8
259
259
261
267
270
272
273
274
275
276
277
278
279
282
282
283
285
289
290
292
293
294
296
297
297
300
303
8.7.4 Comparison of results with previous research.
304
Chapter 9: Conclusions, limitations and suggestions for further research
9.1
9.2
9.3
9.4
9.5
Introduction
The research problems and conclusions
Limitations of the study
Suggestions for future research
Summary
306
306
312
314
316
References
320
Glossary
345
Appendices
349
LIST OF TABLES
Chapter 3:
Table 3.1: Summary of the SME definition
Table 3.2: Number of SME establishments, 2003
Table 3.3: SMEs by sector, 2003
Table 3.4: SMEs by size, 2003
Table 3.5: Proportion of sizes within the sectors of SMEs
Table 3.6: SMEs by service sub-sector, 2003
Table 3.7: SMEs by agriculture sub-sectors, 2003
Table 3.8: Selected manufacturing sub-sectors of SMEs, 2003
Table 3.9: Total output, value added and employment per establishment, 2003
Table 3.10: Total output, value added and employment of SMEs by size, 2003
Table 3.11: Value of assets in the manufacturing sector by size, 2003
Chapter 4:
Table 4.1: List of contingency variables and the types of literature where they have appeared
Table 4.2: Organizational performance indicators used by a study by Jusoh et al. (2008).
Chapter 5:
Table 5.1: The proportion of establishments in the small and medium category based on number
of establishments.
Table 5.2: The proportion of establishments in the small and medium category based on
contribution in economic value-added, output and employment and salaries.
Table 5.3: Response rate from selected studies in Malaysian companies
Table 5.4: Sample size for each subgroup and the target number of responses
Chapter 6:
Table 6.1: Summary of survey response
Table 6.2: Analysis of the population and usable responses by number of employees
Table 6.3: Pearson chi-square based on number of employees and manufacturing activities
Table 6.4: Test of representativeness of response rate for small and medium firms (based on
number of employees)
Table 6.5: Profile of the responding firms
Table 6.6: The results relating to the use of management accounting practices and the ranking of
practices
Table 6.7: Descriptive statistics for the use of costing systems and the ranking of techniques
9
Table 6.8: Descriptive statistics for the use of budgeting systems and the ranking of techniques
Table 6.9: Pair usage of type of budget and their timing
Table 6.10: Descriptive statistics for the use of performance evaluation systems and the ranking
of techniques
Table 6.11: Descriptive statistics for the use of decision support systems and the ranking of
techniques
Table 6.12: Descriptive statistics for the use of strategic management accounting and the ranking
of techniques
Table 6.13: Assessment of market competition by percentage of respondents
Table 6.14: Accounting staff employment by percentage of respondents
Table 6.15: Qualification of accounting staff by percentage of respondents
Table 6.16: Participation of owner/manager by percentage of respondents
Table 6.17: Use of advanced technology by percentage of respondents
Table 6.18: Performance of the firm: summary statistics shown by percentage of respondents
Table 6.19: Perceptions of the role management accounting by percentage of respondents
Chapter 7:
Table 7.1: A summary of the type of data of independent and dependent variables under the first
hypothesis.
Table 7.2: Kendall‘s tau correlation coefficient test results for the relationship between annual
sales turnover and the use of specific management accounting practices.
Table 7.3: Kendall‘s tau correlation coefficient test results for the relationship between intensity
of market competition and the use of management accounting practices.
Table 7.4: Kendall‘s tau correlation coefficient test results for the relationship between
participation of owner/manager and the use of management accounting practices.
Table 7.5: Kendall‘s tau correlation coefficient test results for the relationship between reported
use of AMT and the use of management accounting practices.
Table 7.6: Kendall‘s tau correlation coefficient test results for the relationship between
individual AMT measures and the use of management accounting practices.
Table 7.7: Kendall‘s tau correlation coefficient test results for the relationship between the level
of qualification of accounting staff and the use of management accounting practices.
Table 7.8: Pearson chi-square and Cramer‘s V correlation coefficient test results for a
relationship between industry type and the use of management accounting practices.
Table 7.9: A summary of the type of data for the new dependent variables under the first
hypothesis.
Table 7.10: Kendall‘s tau correlation coefficient test results for a relationship between
contingent variables and the frequency of use of costing techniques
Table 7.11: Kendall‘s tau correlation coefficient test results for a relationship between
contingent variables and the frequency of use of budgeting techniques
Table 7.12: Kendall‘s tau correlation coefficient test results for a relationship between
contingent variables and the frequency of use of performance evaluation techniques.
Table 7.13: Kendall‘s tau correlation coefficient test results for a relationship between
contingent variables and the frequency of use of decision support techniques.
Table 7.14: Kendall‘s tau correlation coefficient test results for a relationship between
contingent variables and the frequency of use of strategic management accounting techniques
Table 7.15: A summary of the type of data of independent and dependent variables under the
second hypothesis
Table 7.16: Kendall‘s tau correlation coefficient test results for the relationship between the use
of costing system and the perceptions of firm performance.
Table 7.17: Kendall‘s tau correlation coefficient test results for the relationship between the use
of budgeting system and the perceptions of firm performance.
Table 7.18: Kendall‘s tau correlation coefficient test results for the relationship between the use
of performance evaluation system and the perceptions of firm performance.
Table 7.19: Kendall‘s tau correlation coefficient test results for the relationship between the use
of decision support system and the perceptions of firm performance.
10
Table 7.20: Kendall‘s tau correlation coefficient test results for the relationship between the use
of strategic management accounting and the perceptions of firm performance.
Table 7.21: Pearson chi-square and Cramer‘s V correlation coefficient test results for a
relationship between the type of manufacturing activities and the perceptions of firm
performance.
Table 7.22: A summary of the type of data for the new independent variables
Table 7.23: Kendall‘s tau correlation coefficient test results for a relationship between the
frequency of use of costing techniques and the perceptions of firm performance measured in
seven ways.
Table 7.24: Kendall‘s tau correlation coefficient test results for a relationship between the
frequency of use of budgeting techniques and the perceptions of firm performance measured in
seven ways.
Table 7.25: Kendall‘s tau correlation coefficient test results for a relationship between the
frequency of use of performance evaluation techniques and the perceptions of firm performance
measured in seven ways.
Table 7.26: Kendall‘s tau correlation coefficient test results for a relationship between the
frequency of use of decision support techniques and the perceptions of firm performance
measured in seven ways.
Table 7.27: Kendall‘s tau correlation coefficient test results for a relationship between the
frequency of use of strategic management accounting techniques and the perceptions of firm
performance measured in seven ways.
Table 7.28: Positive results of a test for a statistically significant relationship between contingent
variables and the use of management accounting practices
Table 7.29: Positive results of a test for a statistically significant relationship between the use of
management accounting practices and the perceptions of firm performance.
Chapter 8:
Table 8.1: Correlation matrix between five contingent variables.
Table 8.2: Correlation matrix between five main areas of management accounting practices.
Table 8.3 Collinearity statistics
Table 8.4: A summary of the type of data of independent and dependent variables for testing the
first hypothesis
Table 8.5: Logistic regression analysis relating to the factors that affect the use of a costing
system
Table 8.6: Logistic regression analysis relating to the factors that affect the use of a budgeting
system
Table 8.7: Logistic regression analysis relating to the factors that affect the use of a performance
evaluation system
Table 8.8: Logistic regression analysis relating to the factors that affect the use of a decision
support system
Table 8.9: Logistic regression analysis relating to the factors that affect the use of strategic
management accounting
Table 8.10: Comparisons of models fitting and R squares with and without qualified accounting
staff
Table 8.11: Comparisons of significance value of predictors with and without qualified
accounting staff
Table 8.12 Results summary of ordinal regression analysis between the use management
accounting practices and perceptions of firm performance.
Table 8.13: Details of independent variables developed from specific management accounting
techniques.
Table 8.14 Ordinal logistic regression analysis relating to the level of use of management
accounting techniques within nine categories and perceptions of performance measured by the
level of productivity
Table 8.15: Ordinal logistic regression analysis relating to the level of use of management
accounting techniques and the perceptions of performance measured by product quality
11
Table 8.16: Ordinal logistic regression analysis relating to the level of use of management
accounting techniques and the perceptions of performance measured by the number of deliveries
on time
Table 8.17: Ordinal logistic regression analysis relating to the level of use of management
accounting techniques and the perceptions of performance measured by sales growth rate
Table 8.18: Ordinal logistic regression analysis relating to the level of use of management
accounting techniques and the perceptions of performance measured by operating profit growth
rate
Table 8.19: Ordinal logistic regression analysis relating to the level of use of management
accounting techniques and the perceptions of performance measured by cash flow growth rate
Table: 8.20: Summary of statistically significant results from binary logistic regression tests
Table: 8.21: Summary of statistically significant results from ordinal regression tests for an
association between nine accounting techniques and perceptions of firm performance
Chapter 9:
Table 9.1: Summary of the results of bivariate and multivariate analyses regarding factors
affecting the use of MAPs
LIST OF FIGURES
Chapter 1:
Figure 1.1 Overview of research process
Chapter 2:
Figure 2.1: Evolution of Management Accounting.
Chapter 3:
Figure: 3.1: SME contribution to GDP in selected countries (% share)
LIST OF APPENDICES
Appendix 1: List of literature in management accounting
Table A1: Major studies in management accounting practices
Table A2: Costing
Table A3: Budgeting
Table A4: Performance evaluation system
Table A5: Decision support system
Table A6: Strategic management accounting
Appendix 2: List of performance measures in management accounting
Table A7: Performance measures used by previous research
Appendix 3: Non-response bias test
Table A8: Pearson chi-square result of early and late responses test
Table A9: Mann-Whitney U test result of early and late responses test
12
Appendix 4: Ordinal regression analysis
Table A10: Results summary of ordinal regression analysis between the use of management
accounting practices and perceptions of firm performance using complementary log-log link
Appendix 5: Questionnaire
Appendix 6: Covering letter to target respondent
Appendix 7: Covering letter: 1st Follow-up
Appendix 8: Covering letter: 2nd Follow-up
ABBREVIATIONS
ABC
ABCMA
ABMA
AIS
AMT
ARR
BBRT
BSC
CAM-I
CBM
CIMA
CSFs
CVP
DOS
DSS
FDI
FMAC
GDP
IRR
IFAC
IMA
IMP
IT
JIT
KM
KPIs
MA
MAP
MAS
MAT
MCS
MOA
MP
NPC
NPV
NSDC
NZ
OC
PMS
ROI
ROE
Activity-based Costing
Activity-based Costing and Management
Activity-based Management Accounting
Accounting Information System
Advanced Manufacturing Technology
Accounting Rate of Return
Beyond Budgeting Round Table
Balanced Scorecard
Consortium for Advanced Manufacturing International
Central Bank of Malaysia
The Chartered Institute of Management Accountants
Critical Success Factors
Cost-Volume-Profit
The Department of Statistics
Decision Support System
Foreign Direct Investment
Financial Management and Management Accounting Committee
Gross Domestic Product
Internal Rate of Return
International Federation of Accountants
Institute of Management Accountants
Industrial Master Plan
Information Technology
Just-In-Time
Knowledge Management
Key Performance Indicators
Management Accounting
Management Accounting Practice
Management Accounting Systems
Management Accounting Technique
Management Control System
Ministry of Agriculture and Agro-based Industries
Malaysia Plan
National Productivity Corporation (Malaysia)
Net Present Value
Malaysian National SMEs Development Council
New Zealand
Organizational Controls
Performance Measurement System
Return on Investment
Return on Equity
13
ROA
ROS
SMEs
SMIDEC
SMA
TQC
TPM
TQM
UNDP
UK
US
VBM
VE
ZBB
Return on Asset
Return on Sales
Small and Medium sized Enterprises
Small and Medium Industries Development Corporation
Strategic Management Accounting
Total Quality Control
Total Productive Maintenance
Total Quality Management
The United Nations Development Program
United Kingdom
United Stated
Value-based Management
Value Engineering
Zero-Based Budgeting
14
Acknowledgement
This thesis would not have been possible without the support and guidance of my
supervisors, Professors Paul Collier and David Gwilliam of University of Exeter. To
them goes my greatest thanks. I would also like to acknowledge my examiners
Professor John Burns and Professor Robert Luther for their constructive feedback and
opinion.
I am also grateful to all the many other members of staff at Exeter Business School who
have helped me in various ways over the past three years. Special thanks to Helen Bell,
the postgraduate administrator of University of Exeter Business School for her
professional advice towards completing my study. Finally, I wish to thank my beloved
husband, Shafie, my children Irshad and Safia Zarin, the rest of the family and friends
for their continued love, support and companionship.
15
Chapter 1
Introduction
1.1
Introduction
This chapter is organized into five sections. The first section describes briefly the
background to small and medium sized enterprises (SMEs) and the role of management
accounting practices (MAPs) in the management of all organizations. Section two
discusses the problem statement followed by the identification of research objectives,
research questions, and hypotheses. Next the rationale and importance of this study is
explained. The section ends with the development of a methodology and the
specification of the organisation of the thesis.
1.2
Background
Small and medium-sized enterprises (SMEs) make up the vast majority of the business
population in most countries in the world therefore they constitute a vital force in
modern information-based economies (Mitchell and Reid, 2000). In Malaysia the SMEs
population comprises approximately 99 per cent of all Malaysian businesses (The
Department of Statistics, 2005). Therefore this sector plays a crucial role in the
economy as an engine to generate economic growth in Malaysia. SMEs also contribute
to the economy in other ways. Cook (2001) highlighted some of those which includes;
the encouragement of entrepreneurship;
the greater likelihood that SMEs will utilize labor intensive technologies and thus
have immediate impact on employment generation;
the fact that they can usually be established rapidly and put into operation to produce
quick returns;
16
the ability of SME development to encourage the process of both inter-and intraregional decentralization; and
the notion that they may become a countervailing force against the economic power
of larger enterprises. More generally, the development of SMEs is seen as
accelerating the achievement of wider economic and socio-objectives, including
poverty alleviation.
In addition to the advantages stated above, Mitchell and Reid (2000) argued that part of
the reason for stressing the importance of small firms or SMEs is that their flexibility
makes them well suited to the niche opportunities which are so characteristic of the
‘new‘ economy. Thus SMEs play a key role in stimulating economic expansion. In light
of both their significant contributions and potentials, there is a growing focus on this
sector by policy makers in most countries. In Malaysia, the role of SMEs became more
important after the 1990s especially after the Asian Crisis in 1997-1998. The country
learnt not to be overly dependent on foreign direct investment (FDI) in stimulating its
economy and used SMEs as a new mechanism for generating the growth of its economy
(Aris, 2007). The government has been called upon to put up clear policies, strategies
and implementation matrixes to develop this sector through an integrated approach
(Aris, 2007). For example in the 9th Malaysia Plan (2006 – 2010), the principal SMEs
policy strives for the development of a competitive, innovative and technologically
strong SME sector, capable of meeting the increasing demands of globalization and
intensifying competition (NSDC, 2007). In consequence various initiatives have been
set in motion to build the capacity and capability of SMEs. For example, there have
been efforts to improve the management and business methods in production, quality
improvement, marketing and accounting skill (SME Annual Report, 2007). However
there is concern about a lack of exposure to management accounting among Malaysian
SMEs since there is no specific reference to the use of MAPs. Previous research has
17
suggested that MAPs are an important tool through which management can promote
efficiency, and potentially have an important influence on performance (see Ghosh and
Chan, 1997; Lybaert, 1998; and Mitchell and Reid, 2000). In particular, within small
firms, MAPs act as the key information system that plays a vital role as an efficient
information-processing (Reid and Smith, 2002). Apart from that, the availability of
financial and non-financial information provided by MAPs permits firms to effectively
face competition in the market, coping with change, surviving and thereby improves
performance (Mia and Clarke 1999 and Reid and Smith, 2002). Although good MAPs
may not by themselves guarantee success, an absence of them or poorly implemented
practices may significantly reduce the firm's competitive advantages (Folk et al., 2002).
Therefore, given these advantages from MAP use, it is important to promote knowledge
and awareness of MAPs among small business in Malaysia so that the firms may benefit
advantages that have been highlighted above.
1.3 Problem statement
Much has been written about small business and in particular about small business
failure rates (Watson and Everett, 1996). Richard (2000) stated that there are many
reasons for the failure rate of start-up businesses, including lack of adequate working
capital, poor market selection, and rapidly changing external market conditions.
However, the most significant reason for this high failure rate is the inability of SMEs
to make adequate use of essential business and management practices. Many small
firms fail to develop an initial plan, and those that do establish a plan fail to continually
adjust and use it as a benchmarking tool. Similarly, Wichmann (1983) argued that one
of the reasons for business failure is poor management ability which includes
accounting problem-solving. Further, Hopper et al. (1999) using data based on the
results from Japanese companies‘ concluded that a failure to adopt MAPs (i.e. cost
18
management systems) in a similar way to their larger counterparts and, at the margins,
to experiment with new forms of control that are more profit oriented may be a factor in
the currently high failure rate of SMEs. Based on these argument it can be suggested
that MAPs are important for SMEs if they are to avoid failing.
Another driver of this thesis is the paucity of research into the use of MAPs among
SMEs. Despite the increasing amount of research in management accounting in the past
decade, little is known of its form and effectiveness within SMEs (McChlery et al.,
2004). This lack of research based knowledge may have been based on a belief that the
discipline in management accounting is best served by studying the most innovative and
successful examples of practice that can be found in the leading western and Japanese
firms (Mitchell et al., 1998).Consequently larger enterprises have been preferred for
empirical management accounting research as expertise and a capacity to innovate and
develop management accounting is more likely to exist in such enterprises (Mitchell
and Reid, 2000). This situation creates a challenge into the study of MAPs in SMEs.
However, Mitchell et al. (1998) contended that research into management accounting in
SMEs provides possibilities of a different type which are nonetheless of great
importance to the fundamental explanation and understanding of the discipline. Indeed,
many of the research opportunities inherent in SMEs derive directly from the contrasts
which they provide with large organisations. Mitchell et al. (1998) added that in the
SME research setting all of the following advantages accrue.
1. The small size of the SME provides a less complex research setting than that
provided by a large scale organisation. In the SME the nature, role and development
of management accounting are more visible to the researcher and due to their
smaller scale, more accessible. This enhanced visibility, combined with the
19
susceptibility of the SME to key contingencies such as phase of the business cycle
and extreme financial and competitive pressures, provides an environment in which
the effects of fundamental forces are marked and can therefore be studied more
easily.
2. Prior research, e.g. Holmes and Nicholls (1989) in an Australian context, indicates
that management accounting information (and its absence) is associated with
success (and failure) in SMEs and is therefore potentially an important influence on
performance within this economic sector. This, in combination with the relative
importance of SMEs as generators of economic well-being reinforces the
significance of this area of research.
3. In new and young SMEs the birth and early years of management accounting
systems are observable. The existing research focusing on these formative stages
concentrates mostly on the development of management control systems (MCS) in
which only a few control systems are associated with management accounting (see
for example Sweeting, 1991; Davila, 2005; Davila and Foster, 2007; Wisbaden and
Sandino, 2007; and Hutzschenreuter, 2009). Hence there is a dearth of research
material that specifically focuses on management accounting at these stages have
been undertaken.
4. The absence, in many instances, of professional accounting support in the SMEs
results in information provision which is derived purely from managerial demand.
The 'producer' driven influence of the accountant is absent from the subject of study
and consequently the SME setting provides a unique and pure insight into
managerial information needs.
For these reasons SMEs offer a potentially rewarding location for investigating MAPs
and exploring the factors underlying their development. At present in Malaysia there is
a dearth of information on the extent of use of MAPs among SMEs. Given their small
20
size especially in the context of developing country, there is a possibility that SMEs do
not use MAPs and fail to take full advantage of the opportunities that better accounting
information might create. Also despite the claims of an association by many researchers,
there is little information on whether or not there is any association between the use or
extent of use of MAPs and the performance of firms, especially for Malaysian SMEs.
The absence of data on MAPs in SMEs has perhaps prevented the Malaysian
regulators/policy makers from taking actions that might improve the functioning of
Malaysian SMEs. Consequently, there are significant gaps in the knowledge base
relating to MAP usage in SMEs in Malaysia, which should be filled on the grounds that
the information provided may underpin government policy towards the sector.
Therefore given the significant economic importance of SMEs and the gap in the
literature, this research aims to obtain a broad overview of the use of MAPs within
Malaysian SMEs, their roles in the management of SMEs, and to examine both the
factors that lead to their use as well as their impact on performance. Following are the
research objectives, research questions and research hypotheses developed for this
study.
1.4 Research objectives
Based on the issues and problems discussed above, this study identifies four main
objectives
1. To investigate the extent to which MAPs are employed by Malaysian SMEs.
2. To identify the roles played by MAPs in Malaysian SMEs‘ management.
3. To determine the factors that affect the extent of use of MAPs among Malaysian
SMEs.
21
4. To seek to demonstrate a positive relationship between MAP use and the
performance of SMEs.
1.5 Research questions
These objectives can be expressed in the following research questions:
1. What is the extent of the use of MAPs by Malaysian SMEs?
2. What are the roles of management accounting in Malaysian SMEs‘ management?
3. What factors affect the extent of the use of MAPs by Malaysian SMEs?
4. Is there a positive relationship between the use of MAPs and the performance of
Malaysian SMEs?
1.6 Hypotheses
Research questions 3 and 4 can be expressed in terms of the following two general
hypotheses for empirical testing:
H1:
There are significant and positive relationships between selected contingent
factors and the use of MAPs.
H2:
There is a significant and positive relationship between the use of MAPs and
organizational performance.
1.7 Importance of the study
This study will have useful implications for theory and practice. Regarding the potential
implications for theory, the study will expand the existing management accounting
literature in two main ways. First the study will provide new empirical evidence on the
use of MAPs. Second, the study will contribute an additional study in the new context
of Malaysian SMEs regarding what contingent factors affect the extent of MAP use.
22
Finally, the research will test for a relationship between the use of MAPs and the
performance in the context of Malaysian SMEs. The focus on Malaysia is especially
important because research on MAPs and SMEs is very limited in this country and
developing countries more generally. Benefits for practice will include the following:
the creation of an awareness among SME managers of the importance of
management accounting as a means of improving performance and maintaining
competitiveness in the marketplace.
the provision of results that may assist policymakers, such as the level of use of
MAPs among SMEs and factors that affect the use of MAPs, that may ensure that
future policy decisions made by the Malaysian government, financial institutions,
and other groups with an interest in SMEs are evidence based.
1.8 Research methodology
The quantitative data for descriptive purposes and empirical testing will be collected by
a postal questionnaire. The questionnaire will examine and explore the state of MAPs
within Malaysian SMEs in the manufacturing sector. The research concentrates only on
one sector in order to avoid inappropriate distractions arising out of variations between
sectors. Besides that the manufacturing sector in Malaysia plays a significant role in the
Malaysian economy and therefore it is worthwhile to focus on this sector as a target
population for this study. In addition the questionnaire will also explore the roles of
MAPs as well as the factors that influence their use among SMEs. Lastly questions on
the level of performance of SMEs and details of the profile of the firms will also be
included. A postal questionnaire approach has been widely used in management
accounting research (see for example, Drury et al., 1993; Firth, 1996; Chenhall and
Langfield-Smith, 1998; Haldma and Laats, 2002; and Al-Omiri, 2003).
23
The information on the membership of the population will be derived from the directory
of the Federation of Malaysian Manufacturers (FMM). This source, although not
comprehensive, provides detailed information about SMEs in the manufacturing sector.
This directory consists of comprehensive profiles of over 2,200 manufacturers from
SMEs to large enterprises. For the sampling purposes, this research will focus on the
small and medium category as the sampling unit. Thus in order to ensure every subsample gets an appropriate representation, a stratified random sampling procedure is
used. This research will expect to receive between 120 to 150 responses from the 1,000
sample. This is based on past response rates in Malaysian studies. A detailed
specification of the methodology is provided in Chapter 5.
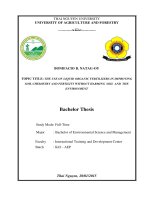
1.8.1 Research process
Figure 1.1 shows the steps that will be employed in addressing the research problems.
Figure 1.1 Overview of research process
Literature review
STEP 1
STEP 2
STEP 3
STEP 4
Identification of possible variables
Development of survey questionnaire
Pilot testing - Postal questionnaire
Approximately 2 months
Actual survey- postal questionnaire
Approximately 4 months
Data analysis
STEP 5
The first step in the research process will be a literature search to ascertain the current
state of knowledge in the field and ultimately to identify the relevant research design
24
and methodology to help address the research questions as well as to identify relevant
factors to be considered in this study. In the second step, a list of possible variables for
identifying MAPs, possible contingent factors and indicators of performance will be
drawn up based on the literature review. Next, a pilot test will be conducted to acquire
feedback from the respondents on the questionnaire as well as to test the response rate
assumption and the timing of responses. On the basis of this information, the
questionnaire form will be reviewed and enhanced and a specific approach for followup procedures will be determined. In the fourth step, the postal survey will be conducted
in order to collect descriptive data needed to answer the four research questions posed.
Finally the data collected from the survey will be analysed using the descriptive
statistics, bivariate association analysis and logit regression analysis.
1.9
Organisation of the thesis
This thesis is organized into nine chapters.
Chapter 1: Introduction
This chapter establishes the importance of SMEs in today‘s modern economy and the
importance of management accounting in the management of all organizations. The
problem statement for this research discusses the failure of the SMEs and the
importance of adopting proper MAPs to reduce the failure rate. The existence of a
research gap in the MAP literature especially in the SME context is also outlined. The
chapter also states the research objectives, research questions and hypotheses for this
study followed by a statement of the contribution generated by the study both in theory
and in practice. This chapter specifies the intended research methodology which briefly
explains how the data will be collected and the sampling method. The chapter ends with
a description of the structure of the thesis.
25