Carbon & Energy Accounting Greenhouse Gas and Energy Assessment Tool for Dutch non-ETS Companies
Bạn đang xem bản rút gọn của tài liệu. Xem và tải ngay bản đầy đủ của tài liệu tại đây (2.85 MB, 80 trang )
Carbon & Energy Accounting
Greenhouse Gas and Energy Assessment
Tool for Dutch non-ETS Companies
Master’s thesis
W.B. van Velzen
Utrecht University
July, 2012
Page | 1
Colophon
This thesis was written as part of the master’s program Sustainable Development, Track Energy &
Resources at the Utrecht University. This master’s thesis is credited for 45 ECTS.
Title:
Carbon & Energy Accounting
Greenhouse Gas and Energy Assessment tool for Dutch non-ETS companies
Author:
Willem van Velzen
Student nr: 3248941
E-mail:
University
Copernicus Institute of Sustainable Development
Utrecht University
Heidelberglaan 2
3584 CS UTRECHT
Supervisors:
Dr. Robert Harmsen (first reader)
Prof. Dr. Ernst Worrell (second reader)
Date of publication:
July, 2012
Page | 2
Summary
The Dutch government is determined to comply with the “Roadmap for moving to a competitive lowcarbon economy in 2050” set by the European Union. If The Netherlands want to reach their greenhouse
gas (GHG) emission target, all sectors within the economy have to do their utter best to reduce their
carbon footprint. There is a strong focus on heavy industries to comply with the Emission Trading
Scheme (ETS). These ETS companies are obliged to report their GHG emissions. For non-ETS companies
it is only voluntary to measure their carbon footprint and to take action to reduce it. There is a growing
trend for companies to do something about their carbon footprint either in the form of reducing or
compensating. Within this field many small green consultancy offices jumped in with free online carbon
assessment tools. They offer their knowledge to determine a strategy to reduce the carbon footprint
and offer carbon offsetting. A close look at these carbon assessment tools reveals several scientific flaws
and their methods are not very transparent. As carbon accounting can be seen as a form of (economical)
bookkeeping it is important to establish certain ground rules for any carbon accounting tool.
The World Resources Institute and the World Business Council for Sustainable Development developed
this carbon accounting standard in the form of the Greenhouse Gas (GHG) protocol. As the GHG
Protocol does not provide a carbon assessment tool and does not provide a carbon emission factor
database, this is constructed as supplement of this research in the form of a website
(www.energiescanner.com). Not only the carbon footprint can be analyzed with Energiescanner but also
the energy footprint (MJ) and variable costs (euro) related to energy use. The standard carbon and
energy factor database is developed specifically for The Netherlands since some factors are country
dependent. For example, the electricity mix of a country determines the carbon emission factor of
electricity. Some emission factors e.g. how to deal with biomass is still under debate within the scientific
community. Also this part of the GHG Protocol is not yet released. Next to the standard database also
the database used by SKAO (CO2-prestatieladder) can be chosen for determining the carbon footprint of
an organization. This database is slightly different compared to the standard database. The main
research question in this thesis is: To what extent can the developed GHG accounting tool provide
consistent insight in the carbon footprint of non-ETS companies and help steering company efforts
towards GHG emission reduction?
The main goal of the website is to offer a scientifically sound platform, which enables non-ETS
companies to scan, analyze and reduce their carbon and energy footprint by themselves (without the
use of “consultancy experts”). The analysis part consists of a feature that allows the user to have insight
through easy interpretable interactive charts and standard reports. By simple mouse clicks the user
selects the part of the organization (parent or subsidiary), scope/subject and form (CO2, energy or euro).
The main advantage is that users can easily see the main emitting subjects and the variable costs
related. This allows the user to make economically feasible decisions towards carbon and energy
reduction. This report contains information on how an easy to use greenhouse gas assessment tool
needs to be constructed based on the GHG Protocol, the justification of the database behind the tool
and how the analysis part is constructed. Also a benchmark with other (free of charge) assessment tools
is executed as well as a case study of a fictive organization.
Page | 3
Preface
Initially the plan was to write this report in an internship setting. However after the first few weeks my
supervisor (Robert Harmsen) and I decided to perform this thesis without an internship. This gave me
more freedom to do my own research according to my own vision.
A large part of this research was the development of a website. The development of a website requires
a wide range of skills. As I do not possess all these skills, multiple friends who do have these skills
offered me to help. The entire technical part and lay-out of the website is developed and programmed
by Jelmer Vernooij. The content of the website is checked by Pieter de Winter. The logo of the website is
designed by Minou Kemperman and Niels van Velzen. Some graphics that are used on the website (also
used in this report) are developed by Bart Lemcke.
Without the help of these people the website would not exist. The intention is to develop the website to
a higher level and start a (part-time) business (Jelmer and myself). The goal of this business is to get as
much users as possible for the website and therewith contribute to the development of emission
reduction strategies by companies. The work on the subject of this thesis has not yet ended.
The weekly sessions with my supervisor Robert Harmsen to discuss the progress on this thesis increased
the efficiency of the process enormously. His profound comments, tips and advice positively steered the
process in a great deal. In my entire academic career I have never met a teacher who is willing to invest
so much time in students. Also the deviations in the weekly discussions helped me to understand much
more of the - for me strange, irrational, full of paradoxes and complex - world of sustainability. Thank
you very much for all your time and effort.
I also want to thank the company Loo van Eck who was willing to cooperate by testing the website.
Finally I want to thank Bart Gombert who read the report in order to check it on grammar errors.
Willem van Velzen
Utrecht, july 2012
Page | 4
Contents
COLOPHON ............................................................................................................................................................ 2
SUMMARY ............................................................................................................................................................. 3
PREFACE ................................................................................................................................................................ 4
1. INTRODUCTION.................................................................................................................................................. 7
1.1 PROBLEM DEFINITION ......................................................................................................................................... 7
1.2 RESEARCH QUESTION.......................................................................................................................................... 9
1.2.1 Central research question ...................................................................................................................... 9
1.2.2 Sub-questions ........................................................................................................................................ 9
1.3 SYSTEM BOUNDARIES ......................................................................................................................................... 9
1.4 READING GUIDE .............................................................................................................................................. 11
2. GHG PROTOCOL ............................................................................................................................................... 12
2.1 INTRODUCTION GHG PROTOCOL ........................................................................................................................ 12
2.2 GHG PROTOCOL FRAMEWORK ........................................................................................................................... 13
2.3 GUIDING PRINCIPLES TO DEVELOP A CARBON ACCOUNTING INVENTORY ......................................................................... 17
2.4 SKAO: CO2 PRESTATIELADDER ........................................................................................................................... 18
3. METHOD .......................................................................................................................................................... 19
3.1 OPERATIONALIZATION GHG PROTOCOL ................................................................................................................ 19
3.2 CARBON AND ENERGY ACCOUNTING AND FINANCIAL INSIGHT ...................................................................................... 20
3.3 BENCHMARK AGAINST CURRENTLY AVAILABLE GHG ASSESSMENT TOOLS ....................................................................... 21
3.4 SENSITIVITY ANALYSIS, RESULTS AND STRATEGY FORMING .......................................................................................... 23
4. DEVELOPMENT ACCOUNTING TOOL: ENERGIESCANNER .................................................................................. 25
4.1 FRAMEWORK WEB-BASED ACCOUNTING TOOL......................................................................................................... 25
4.2 ENERGIESCANNER DESIGN FROM THE USER PERSPECTIVE ............................................................................................ 27
4.2.1 Interface Energiescanner ..................................................................................................................... 28
4.2.2 Function: Scan ..................................................................................................................................... 29
4.2.3 Function: Analyze ................................................................................................................................ 31
4.2.4 Function: Reduce ................................................................................................................................. 34
4.3 DEVELOPMENT CONSISTENT DATABASE ................................................................................................................. 35
4.3.1 Consistency ......................................................................................................................................... 35
4.3.2 Determining CO2 emission factors ........................................................................................................ 37
4.3.3 Determining energy factors ................................................................................................................. 40
4.3.4 Determining money factors.................................................................................................................. 40
4.3.5 Database framework ........................................................................................................................... 41
4.3.6 Main data collection sources................................................................................................................ 43
4.4 DATABASE VALUES ........................................................................................................................................... 44
4.4.1 Fuels.................................................................................................................................................... 44
4.4.2 Electricity ............................................................................................................................................ 46
4.4.3 Public transport ................................................................................................................................... 51
4.4.4 Cars..................................................................................................................................................... 52
4.4.5 Own transport ..................................................................................................................................... 53
Page | 5
4.4.6 External transport (freight) .................................................................................................................. 54
4.4.7 Refrigirants ......................................................................................................................................... 54
4.4.8 Other................................................................................................................................................... 55
4.4.9 SKAO emission factors ......................................................................................................................... 56
4.4.10 Common energy prices ...................................................................................................................... 56
5. BENCHMARK GHG ASSESSMENT TOOL............................................................................................................. 57
6. CASE STUDY 1: VIRTUCON ................................................................................................................................ 59
6.1 SCAN............................................................................................................................................................ 59
6.2 ANALYZE AND REDUCE ...................................................................................................................................... 61
7. CASE STUDY 2: REVIEW BY LOO VAN ECK ......................................................................................................... 63
8. EVALUATION GHG PROTOCOL.......................................................................................................................... 64
9. DISCUSSION ..................................................................................................................................................... 67
10. CONCLUSION.................................................................................................................................................. 69
REFERENCES......................................................................................................................................................... 72
ABBREVIATIONS .................................................................................................................................................. 76
ANNEX ................................................................................................................................................................. 77
ANNEX A – OVERVIEW SUBJECTS PER SCOPE ................................................................................................................ 78
ANNEX B – SKAO CO2 EMISSION FACTOR LIST ............................................................................................................. 79
Page | 6
1. Introduction
In accordance with the "Roadmap for moving to a competitive low-carbon economy in 2050" as set by
the European Commission, the goal of the Netherlands is to reduce 80% of the greenhouse gas (GHG)
emissions in 2050 (-20% in 2020, -40% in 2030) compared to 1990 (Atsma & Verhagen, 2011). For the
period up to 2020 this target consists of two main components that have to contribute to GHG emission
reductions. The first component is the Emission Trading Scheme target (ETS), which is covered by the
ETS directive and is applied to ETS-sectors (large GHG emitters such as heavy industries). The second
component is applied to non-ETS sectors, which is covered by the Effort Sharing Decision (ESD)
(Harmsen et al, 2011a). The ESD concern the emissions from sectors not included in the EU Emissions
Trading System (ETS) such as transport, buildings, agriculture and waste (European Commission, 2011a).
While sectors in the ETS are regulated at the Community level, it will be the responsibility of Member
States to define and implement policies and measures to limit emissions of sectors under the Effort
Sharing Decision (European Commission, 2011a). The ESD target for the Netherlands is 16% GHGemission reduction in 2020 compared to 2005 (PBL, 2011). Within the Netherlands 79% of the workforce
is employed within the tertiary sector (mostly non-ETS) (CBS, 2012) and contributes around 73% of the
total GDP. The contribution to GHG emissions per unit of GDP is relatively low but due to the size of the
sector still significant.
The pressure of the public to tackle climate change and therefore reduce emissions is increasing.
Companies find themselves under increasing regulatory and public relations pressure to record,
communicate and reduce GHG emissions of goods and services across the value chain (Lash and
Wellington, 2007) (Okereke, 2007). Recording GHG emissions is also referred to as carbon accounting.
Insight in GHG emissions means that action can be taken. “The very act of providing accounts has the
potential to change behavior.” (Buhr, N., 2007, p. 67). An insight in GHG emissions also opens the
possibility for benchmarking. The benchmarks are also very important for the achievement of a lowcarbon economy. They provide a strong signal for what is possible in terms of low-carbon production
(European Commission, 2011b).
1.1 Problem definition
For companies it is important to have a clear framework in order to define a strategy for reducing GHG
emissions. As stated by Ascui & Lovell (2011): “Framing defines the problem (and therefore also its
solutions) by structuring the terms of the debate, foregrounding certain forms of knowledge, expertise
and practice as relevant and setting limits on what action is judged to be appropriate. Framing is used to
make sense of the world, and then actively affects our response.” The development of an easy to use
assessment tool that provides insight in the GHG emissions of a company accompanied by multiple
forms of analysis tools can contribute to the Effort Sharing Decision (reducing direct emissions of
transport, build environment and small industries) target of the Netherlands. As recital 28 and 29 of the
Effort Sharing Decision - Decision No 406/2009/EC of the European Parliament and of the Council of 23
Page | 7
April 2009 on the effort of Member States to reduce their greenhouse gas emissions to meet the
Community’s greenhouse gas emission reduction commitments up to 2020 (ESD, 2009) - states:
(28) Since the reduction commitment of the Community imposes tasks not only on the central
governments of Member States but also on their local and regional governments and on other
local and regional advocacy forums and organizations, Member States should ensure
cooperation between their central authorities and local authorities at different levels.
(29) In addition to individual Member States, central governments and local and regional
organizations and authorities, market actors — together with households and individual
consumers — should be involved in contributing to the implementation of the Community’s
reduction commitment, irrespective of the level of greenhouse gas emissions which can be
attributed to them
At the moment there are multiple online carbon assessment tools that claim to be able to calculate the
carbon footprint (sum of direct and indirect emissions) of a company. However, these assessment tools
often lack transparency. A quick glance at some of those websites reveals several inconsistencies,
incompleteness and limitations in providing a deeper insight in the carbon footprint. One2Green (online
carbon accounting tool based on the GHG Protocol) for example uses a CO2 emission factor for
electricity of 387 gram CO2/kWh (compared to 560 gram CO2/kWh calculated in this report) and does
not follow the guidelines of the protocol at all (e.g. separate direct emissions from indirect emissions in
the results section) (One2Green, 2012).
According to the website of the Greenhouse Gas Protocol (GHG Protocol) the GHG Protocol is the most
widely used international accounting tool for government and business leaders. The website however
does not provide an accounting tool, but merely guidelines of the protocol on how to develop your own
accounting tool. This subject will be further elaborated in the evaluation of the GHG Protocol (Chapter
8). The International Organization for Standardization (ISO) adopted the Corporate Standard as the basis
for its ISO 14064-I in 2006; “ Specification with Guidance at the Organization Level for Quantification and
Reporting of Greenhouse Gas Emissions and Removals. This milestone highlighted the role of the GHG
Protocol’s Corporate Standard as the international standard for corporate and organizational GHG
accounting and reporting.” (GHG Protocol, 2012). The problem of the ISO certificate is that it costs a lot
of money and is a bureaucratic burden. There is also not an accounting tool available for direct use. For
most small/medium sized businesses this is therefore not an option.
In conclusion, there is a widely accepted framework available for carbon accounting in the form of the
GHG Protocol. However, this framework is not translated into an easy to use accounting tool. The GHG
Protocol merely provide guidelines on how to construct a GHG assessment tool, but does not provide
e.g. an emission factor database. The problem of guidelines is that they can be interpreted in multiple
ways, which may result in inconsistent outcomes. Also the GHG Protocol limits its guidelines to GHG
accounting whereas energy accounting is also very important. Energy use and GHG emissions are closely
related, analyzing results of the assessment tool from multiple perspectives may result in developing a
different, more effective strategy.
Page | 8
1.2 Research question
1.2.1 Central research question
The objective of this research is to develop an easy to use and transparent assessment tool which
enables non-ETS companies to get reliable and consistent insight in their Greenhouse Gas emissions
(based on the GHG Protocol) and energy use. The central research question related to this objective is:
To what extent can the developed assessment tool provide reliable and consistent insight in the carbon
and energy footprint of non-ETS companies?
1.2.2 Sub-questions
1. What are currently relevant Dutch carbon indicators and thereby carbon intensities based on
reliable and consistent calculation methods for direct and indirect emissions for non-ETS
companies?
2. What are currently relevant Dutch energy indicators and thereby energy intensities based on
reliable and consistent calculation methods for direct and indirect energy use for non-ETS
companies?
3. What type of analysis tools are needed within the assessment tool that can contribute to more
insight in the carbon and energy footprint?
4. How do the results of the developed assessment tool compare to available web-based GHG
assessment tools?
5. To what extent can the developed assessment tool help to develop a strategy in other to reduce
GHG emissions and energy use?
6. To what extent are the GHG Protocol and the website of the GHG Protocol shown useful in
developing an accounting tool?
1.3 System boundaries
The term carbon accounting can be interpreted in multiple ways. The figure below shows different
terms of specific interpretations of carbon accounting that can be defined (Milne and Grubnic, 2011).
Every intepretation has its own perspective of the accounting method en is therefore essential to define.
Table 1: Carbon accounting definitions
estimation
calculation
reporting
validation
verification
global
removals from the atmosphere
national
research
emission rights
sub-national
compliance
emission obligation
regional
reporting
emission reductions
civic
disclosure
carbon
measurement
monitoring
emissions to the atmosphere
of
carbon dioxide
Greenhouse
gas
organisational
legal or financial instruments
linked to the above
trades/transactions of any of
the above
auditing
at
corporate
level
for
mandatory
benchmarking
voluntary
auditing
project
information
installation
marketing
event
or other
product
impacts of climate change
supply chain
impacts from climate change
Source: (Milne and Grubnic, 2011)
Page | 9
purposes
This research will focus on the audit of greenhouse gas emissions to the atmosphere (and energy use) at
organisational level for voluntary information purposes (marked red in Table 1). Given that at this
moment non-ETS companies are not obliged to reduce their carbon emissions within the boundaries of
the determined scopes.
The users of the GHG Protocol can be divided into two broad categories:
1. Corporate users: Businesses using the GHG Protocol directly for their own purposes or as
participants of voluntary climate initiatives.
2. Non-Corporate users: Governments, NGOs, and others with initiatives or programs based on or
informed by the GHG Protocol Initiative.
As already mentioned the study will focus on non-ETS companies (corporate users). This will contribute
to homogeneity of the product that can be used for benchmarking purposes between non-ETS
companies. The data provided by the assessment tool can be used for more than just information
purposes, but this is up to the reporting company. The reporting company can incorporate the
information within a report that can be used in a benchmark with other companies in the same sector or
it can be used as marketing tool. The energy accounting part follows the same system boundaries as
carbon accounting. The audit is entirely voluntary and at this moment just for information purposes. The
accounting tool can also be used by non-corporate users.
Boundaries of the assessment tool
The goal is that non-experts should be able to use the assessment tool. The assessment tool should be in
balance between easy to use (non-expert) and completeness. The boundaries of the assessment tool
will be the same as the boundaries set by GHG Protocol. At this moment everybody can develop a GHG
assessment tool and put it on a website. The purpose of developing this assessment tool from a client
perspective is providing reliable and consistent insight in carbon emissions and energy use for the client.
The client can take action at a voluntary base. The client will not be rewarded in the form of a certificate
or whatsoever, but will be able to reduce energy costs. From a scientific perspective the development of
an assessment tool is valuable to see whether different methods and input values may lead to different
results. Note: The carbon and energy accounting tool will further be referred to as assessment tool or
accounting tool in this report.
Page | 10
1.4 Reading guide
The structure of the report is as follow (the green headers are the chapters that contain the results of
this thesis):
2) GHG Protocol
•Introduction
•Framework
•Guiding
principles
•CO2 Prestatieladder
3) Method
•Operationalization protocol
•Accounting
•Benchmark
•Analysis
4) Development
Energiescanner
•Framework
•User
perspective
•Development
database
•Database values
5) Benchmark
• Benchmark
Energiescanner
against other
assessment
tools
6) Virtucon
• Case study 1;
detailed
assessment of a
fictive company
First the GHG Protocol will be discussed from all its facets (chapter 2). Secondly the method on how the
GHG Protocol will be used in the development of the assessment tool and how the tool is benchmarked
and field tested will be elaborated (chapter 3). The following chapter is about the development of the
assessment tool Energiescanner, including screenshots of the website (chapter 4). The next chapter
contains the results of the developed assessment tool benchmarked against currently available
accounting tools (chapter 5); followed by the results of the case study of the fictive company Virtucon
(chapter 6).
7) Loo van Eck
•Case study 2;
Review of the
developed
assessment tool by
Loo van Eck
8) Evaluation GHG
Protocol
•Website and
protocol evaluation
•Recommendations
regarding GHG
Protocol
9) Discussion
•Database values
•GHG Protocol
10) Conclusion
•Main conclusions of
this research
The results of the second case study with a real company are not published in this report due to privacy
issues. However, Loo van Eck did write a review of the developed website (chapter 7). Also the GHG
Protocol itself will be evaluated (chapter 8). The final chapters contain the discussion (chapter 9) and
conclusion (chapter 10) of this thesis.
Please do not forget to visit the website of Energiescanner: www.energiescanner.com (Dutch).
Page | 11
2. GHG Protocol
In this chapter the GHG Protocol will be introduced (2.1) followed by the framework of the GHG
Protocol (2.2). Also the guiding principles as set by the GHG Protocol for the development of an
accounting tool will be discussed (2.3). The last section of this chapter is a small introduction of the CO2
prestatieladder. The CO2 prestatieladder is a Dutch instrument which is based on the GHG Protocol
(including emission factor database) and thereby closely related to this research (2.4).
2.1 Introduction GHG Protocol
The World Business Council for Sustainable Development (WBCSD) is a coalition of 200 international
companies which jointly convened the GHG Protocol with the World Resources Institute (WRI) in 1998.
The WRI is an environmental think tank which has a network of 150 members of advisors, collaborators,
partners, and cooperating institutions in more than 50 countries. The work of the GHG Protocol is
funded by multiple private organizations and governmental institutions.
The website of the GHG Protocol describes the GHG Protocol as follows (‘About’ tab): “The Greenhouse
Gas Protocol (GHG Protocol) is the most widely used international accounting tool for government and
business leaders to understand, quantify, and manage greenhouse gas emissions. And: The GHG Protocol
also offers developing countries an internationally accepted management tool to help their businesses to
compete in the global marketplace and their governments to make informed decisions about climate
change.” (GHG Protocol, 2011). This phrase is not entirely correct as the GHG Protocol is not an
accounting tool but a protocol with guidelines on how to develop an accounting tool. There are no
complete accounting tools available on the website of the GHG Protocol. This discussion will further be
elaborated in the evaluation of the GHG Protocol (chapter 8). The evaluation will be based on
experience acquired during this research.
The website of the GHG Protocol is regularly updated with new reports that contain guidelines for
specific sectors. The latest release (June, 2012) is: “Project Launches to Measure and Manage GHG
Emissions for Agriculture in Brazil” (17 June 2012) (GHG Protocol, 2012). Also dates for events and
trainings related to the GHG Protocol can be found on the website.
Page | 12
2.2 GHG Protocol framework
This subchapter is partly subtracted of the WRI report: HOT CLIMATE, COOL COMMERCE: A Service
Sector Guide to Greenhouse Gas Management (Putt del Pino et al, 2006), which can be downloaded free
of charge from the website of the GHG Protocol. To understand the reasoning of this research it is
needed to have a clear picture of this framework. Therefore the GHG Protocol framework for the
development of a GHG inventory is summarized.
The WRI really tries to persuade companies to start with carbon accounting: “Even if your company
recognizes that service-sector companies contribute to climate change, it still must establish a business
case to take action. Perhaps the best message to send to your company’s decision makers is that GHG
management—that is, measuring your company’s GHG emissions, setting a reduction target, and
implementing your reduction strategy—can build corporate value and earn benefits for your company.”
(Putt del Pino et al, 2006, p. 11)
DEVELOP
2. Design GHG
inventory
3. Collect data
4. Calculate
emissions
5. Set up target
MANAGE
Improvement and iteration
PLAN
1. Assign
resources
6. Reduce
emissions
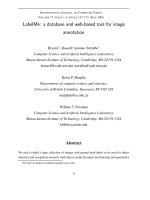
7. Report results
Plan phase
Before starting a GHG inventory it is important that the management board
supports the plan. Also the board should Assign resources (1) for the
established of a team and the development of protocols for e.g. the data
gathering process. The next step is to Design a GHG inventory (2), this
includes setting organizational boundaries and determine sources of
emissions.
Development phase
In order to Collect data (3) an efficient data management system must be
designed. Also a base year must be selected as reference to measure
progress over time. Also within this step appropriate data must be obtained
with a minimum data quality level. When all data is collected it is time to
Calculate emissions (4). Important is to guard for calculation errors.
Manage phase
To manage your GHG emissions it is important to Set a target (5). This target
must be per definition lower than current emissions, so emission reduction
opportunities can be identified. The target can be in absolute terms or in the
form of an intensity target. The next step is to Reduce emissions (6) by
implementing the emission reduction activities. The last step is to Report
the results (7) so interested stakeholders can be informed on all GHG related
activities.
Figure 1: Overview GHG Protocol framework
Source: (Putt del Pino et al, 2006, p. 15)
Page | 13
1. Assign resources (plan)
The GHG Protocol prescribes the following initiatives a company has to take for successful GHG emission
reductions. First of all it is important to develop a long term strategy and planning. Also administrative
and operational procedures need to be adapted. This means that a budget and team is needed to
implement these measures. Participation of as many colleagues as possible might help to track the use
of energy or reduce energy by implementing energy conservation measures (behavioral change). It is
critical that all these initiatives must be supported by the senior management in order to have success.
2. Design a GHG inventory (plan)
In order to design a GHG inventory the first step is to define the organizational boundaries of the
company. There are multiple authorized methods to determine the organization boundary. The equity
share method allocates the GHG emissions of subsidiaries as the percentage of shares the parent
company owns. The operational control method allocates GHG emissions based on whether or not the
parent company has the ability to introduce and implement operating policies at a specific operation
(100% allocation if yes, 0% allocation if not). The financial control method allocates GHG emissions on
whether or not there is financial control over an operation. If the parent company has influence on the
financial and operating policies in order to gain economic benefits from its activities 100% of the GHG
emissions must be allocated, if not 0%.
Next is to define the operational boundaries. There is a distinction between direct and indirect
emissions. Direct emissions are emissions that are directly controlled or owned by the organization. For
service sector companies it applies mostly to boilers and company cars. These direct emissions are
subjected to scope 1. Indirect emissions result from activities within the organization but from sources
owned or controlled by another company. The most prominent example as source for indirect emissions
is electricity use. Every organization uses electricity and most likely this is purchased from an external
supplier. The GHG Protocol makes a distinction within indirect emission. As electricity use often makes
up a significant percentage of the total emissions it is obligatory to report it under scope 2. All other
indirect emission should be reported in scope 3 but are not mandatory.
Table 2 - Overview Scopes
Emissions type
Direct emissions
Scope
Scope 1
Definition
Emissions from operations that are
owned or controlled by the reporting
company
Examples
Emissions from combustion in owned or
controlled CHP’s, boilers, furnaces, vehicles,
etc.;
Indirect emissions
Scope 2
Emissions from the generation of
purchased or acquired electricity,
steam, heating, or cooling
consumed by the reporting company
All indirect emissions (not included
in scope 2) that occur in the value
chain of the reporting company,
including both upstream and
downstream emissions
Use of purchased electricity, steam, heating, or
cooling
Scope 3
Employee commuting in vehicles not owned or
controlled by the reporting company.
Production of purchased products,
transportation of purchased products, or use of
sold products
Source: (Bhatia et al, 2011, p. 28)
Page | 14
Figure 2 provides a schematic overview of all relevant subjects per scope. For a complete list of the
defined subjects that cause emissions, see Annex A.
Figure 2: Overview subjects per scope
Source: (Putt del Pino et al, 2006, p. 23)
3. Collect data (develop)
The most important and difficult part is to collect all relevant data. The website of the GHG Protocol
provides calculation tools that can assist (tips and tricks) for the collection of data, but as already
mentioned these are difficult to understand. First activity data must be collected of all subjects within
the scopes, e.g. liters of fuel used by the company car fleet or total electricity use in kWh. To convert the
activity data into GHG emissions it is needed to have reliable emission values such as grams CO2 per Liter
[g CO2/L] of fuel.
4. Calculate emissions (develop)
There are multiple ways to calculate GHG emissions. If data regarding fuel use of company cars is
unavailable it is also possible to calculate GHG emissions by combining distance traveled (kilometers)
and emission factors expressed in vehicle kilometers (taken into account the size and efficiency of the
car). The GHG Protocol mentions a hierarchy in preferred methods for calculating GHG emissions per
subject. The higher the accuracy in activity data the higher the quality of the GHG inventory (liters of
fuel preferred above distance traveled).
5. Set up target (manage)
To measure the performance of reducing GHG emissions over time it is useful to have a base year as
reference. This can be complicated, because you need reliable historical data of the selected base year.
When structural changes occur due to acquisition or mergers it is relevant to recalculate the emissions
of the base year to reflect structural changes. Also recalculation of historical emission years should be
done when significant errors are found in the activity data or used emission factors. The target itself
could be in absolute targets (e.g. 25% reduction in 2020) or intensity targets (e.g. 20% reduction per
euro turnover). Both absolute targets as intensity targets have advantages and disadvantages.
Page | 15
6. Reduce emissions (manage)
There are multiple ways to reduce GHG emissions for service-sector companies. It is likely that most
emissions occur due to heating the building, electricity use and transportation (business travel,
commuting). Reducing these emissions can be accomplished by switching from electricity supplier (grey
to green) and by e.g. increasing the efficiency of the car park. It is also possible to offset GHG emissions
to reach your goal.
7. Report the results (manage)
The following information is required reporting under the framework of the GHG Protocol (Putt del Pino
et al, 2006, p. 59, 60):
Emissions in metric tons and in tons of CO2-equivalent.
Total scope 1 and scope 2 emissions.
Separate emissions from each scope plus the total emissions from each scope, showing the sum
of your company’s emissions.
The chosen base year and your company’s emissions performance over time compared with
that of your base year and reduction target.
Methodologies used to calculate emissions, including emission factors and their sources, or a
reference or link to the calculation tools used, with the same information.
Appropriate context for any significant emission changes such as acquisitions or divestitures,
outsourcing or insourcing, changes in reporting boundaries, and base-year recalculations.
If applicable, leased electricity that must be reported in scope 3.
The following information is optional reporting:
All other scope 3 emissions. A description of any emission reduction activities.
A description of offset projects invested in and information about the offsets’ credibility, as well
as how much of the reduction target was achieved using offsets.
A description of inventory-related activities planned for the coming year.
Development accounting tool based on GHG Protocol framework
The objective of this research is to develop an assessment tool based on the described GHG Protocol
framework. The goal is that the developed assessment tool lowers the entry barrier for organizations to
start with accounting of their carbon emissions and energy use. Chapter 4 of this report is reserved to
the development of the accounting tool and how the GHG framework (seven steps) is implemented.
Page | 16
2.3 Guiding Principles to develop a carbon accounting inventory
The GHG Protocol defines five guiding principles which must be incorporated within a carbon accounting
inventory. The report ‘Designing a Customized Greenhouse Gas Calculation Tool’ published by the WRI
states: “Principles are the general guidance for the “spirit” to be followed in developing an inventory
when the exact “letter” is unclear.” (Daviet, F., 2006, p. 15). These guiding principles are essential in this
research as the guide the process of the objective to develop an assessment tool that provides
consistent insight in carbon emissions and energy use. The definition used in the objective covers the
five guiding principles defined by the GHG Protocol.
Relevance
Accuracy
Completeness
Consistent
Transparency
Consistency
Figure 3: Guiding principles of the GHG Protocol
Source: Figure own design
Relevance: “Define boundaries that reflect the GHG emissions of your business and the decision-making
needs of the inventory users.” (Putt del Pino et al, 2006, p. 19)
Completeness: “Account for all emissions sources and activities within your chosen organizational and
operational boundaries. Justify specific exclusions.” (Putt del Pino et al, 2006, p. 19)
Consistency: “Allow a comparison of emissions performance over time. State any changes in the basis of
reporting to make sure the comparison remains valid.” (Putt del Pino et al, 2006, p. 19)
Transparency: “Address all relevant issues, based on a clearly marked audit trail. Disclose any important
assumptions, and cite the calculation methodologies used.” (Putt del Pino et al, 2006, p. 19)
Accuracy: ”Ensure that your GHG calculations are accurate, and provide reasonable assurance of the
GHG information’s integrity.” (Putt del Pino et al, 2006, p. 19)
Page | 17
2.4 SKAO: CO2 prestatieladder
Within the Netherlands Prorail took the first initiative to develop an instrument based on the GHG
Protocol which measures the CO2 performance of their suppliers (SKAO, 2012). The instrument
represents the inventory of GHG emissions of an organization linked to a certification scheme. Initially
this instrument was only in use by ProRail, but soon it became apparent that other contractors (of other
sectors) saw the potential of the instrument. Suppliers which act on their performance regarding CO2
emissions receive a competitive advantage in the form of a discount on the assessment of the tender;
the tender amount is lowered by a percentage (determined by the client) and thereby more attractive
(e.g. tender amount is Euro 100.000, due to a level 4 rating the client assess the amount as Euro 95.000).
This instrument is called the CO2 prestatieladder and is now available for all contactors (not limited to
Prorail) who are interested in working with suppliers who are aware of their emissions. The ownership
of the instrument is since 16 march 2011 held by Stichting Klimaat-vriendelijk Aanbesteden &
Ondernemen (SKAO). SKAO does not use an online calculation tool but has its own emission factor
database, which can be used to calculate the total emissions of a company. Only a certified auditor
(registered by SKAO) is authorized to asses an organization that wants to be certified. SKAO does not
follow the GHG Protocol completely but made some adjustments of their own. For more information it
is possible to download the manual free of charge from their website: “handbook CO2 prestatieladder”.
Main differences CO2 Prestatieladder versus GHG Protocol
As shown in Figure 4 the CO2 prestatieladder
Commuter
Waste
counts ‘business travel‘ and ‘personal cars for
travel
Disposal
Electricity
Business
business travel’ in scope 2, while according to
travel via
purchased
Paper
the GHG Protocol it should be counted in scope
public
Used
transport
3. A second large difference is that the CO2
Fuel used Airco
Electricity
prestatieladder calculates emissions with wrong
refrigirants
used at
Personal
emission factors; they include indirect emissions
Business
client
sites
cars for
travel
for
the
extraction,
production
and
business
travel
Suppliers/
transportation of fuels in scope 1, while it
Business
Outsourced
air travel
should be reported in scope 3 (further explained
emissions
Other
in chapter 3.2). Also the emission factor of
consumables
electricity (important source of emissions in
SKAO counts
service sector companies) is likely to be too low
Business travel and personal cars
(455 gram CO2 per kWh).
for business travel in scope 2
Figure 4: CO2 prestatieladder (partly translated from Dutch)
Source: (SKAO, 2011, p. 51)
Page | 18
3. Method
This research can be seen as an operationalization and extension of the GHG Protocol framework (3.1).
An important aspect of the research is the accounting method (3.2). Also the developed tool will be
benchmarked against already available tools (3.3). Finally the developed accounting tool will be tested in
the form of a case study (3.4).
3.1 Operationalization GHG Protocol
The main part of this research is the construction of a carbon and energy assessment tool. According to
Bown and Wittneben (2011) Carbon accounting systems has to evolve on three levels:
1. Scientific knowledge of how to recognize and count GHG emissions;
2. Accounting effort to collect and record this information;
3. Accountability systems to compare this data.
Chapter 4 of this research will be used to elaborate the objective of this research: the development of
an easy to use and transparent assessment tool which enables non-ETS companies to get reliable and
consistent insight in their Greenhouse Gas emissions (based on the GHG Protocol) and energy use.
User perspective
Framework
development website
Development database
Figure 5: Development of an easy to use and transparent assessment tool
Source: Figure own design
First a framework will be developed to build a web-based accounting tool linked to the framework of the
GHG Protocol (2.2) and the guiding principles (2.3). The next step is to translate the framework into an
easy to use assessment tool from a user perspective. A large part of this research is dedicated to the
development of a database with values that are needed to calculate the carbon and energy footprint.
This database is for a large part responsible to get reliable and consistent insight in the carbon and
energy footprint.
Page | 19
3.2 Carbon and Energy accounting and financial insight
Calculating Carbon emissions and Energy use
In order to calculate GHG emissions multiple factors should be recognized. The most general equation to
calculate GHG emissions is:
Equation 1: General equation GHG emissions
activity data (a) * emission factor (b) = GHG emissions
a) Activity data: “Activity data quantify an activity, such as employee business trips, in units that will help
you calculate the emissions generated” (Putt del Pino et al, 2006, p. 33). The user of the calculation tool
is responsible for collecting the activity data, but will be supported by the tool. In most events there are
multiple methods to calculate the activity data. The accuracy of these methods differs; the tool provides
a ranking in guiding methods to calculate the activity data. The most accurate method will be used first,
if data this is not sufficient other (less accurate) methods will be provided. E.g. most accurate entry:
usage of gasoline per year [litergasoline/year]; less accurate entry: kilometers driven by car per year
[km/year].
b) Emission factor: “Emission factors convert activity data to emission values” (Putt del Pino et al, 2006,
p. 33). The emission factors are embedded within the calculation tool. All emission factors are based on
the Dutch situation. As energy must be extracted, converted into useful energy, transported, stored and
distributed losses occur within the energy supply side. The GHG Protocol makes a distinction between
direct and indirect emissions. This means that different emission factors must be used within the
different scopes. Example of emission factor [gram CO2/Liter]. GHG emissions are presented in [Ton
CO2/year]. In most reports like the IPCC report carbon emission factors of fuels are provided in kg/GJ. As
most activity data will be provided in liters it is useful to recalculate the emission factors of fuels by the
energy density of the fossil fuel resulting in g/L: Emission factor [g/MJ)] * Energy density [MJ/L] =
Emission factor per Liter [g/L].
Important to notice is that the GHG Protocol only provides guidance on collecting activity data and
selecting appropriate emission factors. In order to calculate energy use the same method is applicable as
for carbon accounting. The most general equation to calculate energy use is:
Equation 2: General equation energy use
activity data (a) * energy factor (b) = Energy use
The same activity data can be used for energy accounting as for carbon accounting. The energy factor
however is calculated in [MJ/L]. All calculations are made per year so this equation results in energy use
in [MJ/year].
Page | 20
Financial insight
During the inventory it is a small step to also account for the variable costs regarding the activity data.
Detailed information about the carbon emissions, energy use and variable costs involved opens
opportunities in the form of financial analysis. As for carbon and energy accounting the method behind
the general equation has similarities:
Equation 3: General equation energy use
activity data (a) * money factor (b) = Money spent
Again the activity data is similar as for carbon and energy accounting. The money factor is calculated in
[Euro/L]. This finally results in money spent in [Euro/year].
Exemptions in determining emission factors
Not all emission and energy factors are constants. For example the emission and energy factor of
electricity [gram CO2/kWh], [MJ/kWh] is not equal every year. This is due to changes in the power mix of
the Netherlands (e.g. different shares of use of fossil fuels, more installed capacity of renewables). A
different emission factor with unchanged activity changes the total GHG emissions and energy use (see
Equation 1). Also the emission factor itself is not a fixed number but can differ based on the used
database; there is not always consensus in literature (Harmsen and Graus, 2012). The GHG Protocol
states in this case that the guiding principles should be used leading in the determination of the values.
This research will result in two emission factor databases. The first database will be based on own
literature research and the second database will be on factors provided by SKAO.
3.3 Benchmark against currently available GHG assessment tools
At the moment there are already multiple online GHG assessment tools. This chapter defines a method
to investigate to what extend the developed GHG assessment tool relates to currently available GHG
assessment tools. The calculation tools mentioned in Table 3 will be used as benchmark against the
developed tool (Energiescanner). Due to the focus on Dutch companies in this study and the fact that
some emission factors are country specific (e.g. electricity) the calculation tool must be developed for
the Dutch market.
Table 3: Used calculation tools to benchmark against Energiescanner
Name calculation tool
1 One2green
Website
/>
2 Fairclimatefund
/>
3 Climate Neutral Group
/>
4 Zeeuwsklimaatfonds
/>
Page | 21
In February 2012 TNO published a study regarding the comparison of online carbon calculation tools
focused on transport activities (TNO, 2012). The method used in this research to benchmark currently
available GHG calculation tools is partly derived from the research of TNO, supplemented with the five
guiding principles of the GHG Protocol (chapter 2.3).
As shown in Table 4 the method consists of five major comparison criteria with subcriteria. There are
multiple methods (1) available for the calculation of GHG emissions. Therefore it is important that the
tool is transparent on which method is used. Not every calculation tool provides enough options to
enter the activity data (2. Input) or lacks subjects that cause emissions in the reporting company. The
calculation (3) part is from a technical point of view not very difficult but major flaws can be made when
the emission factor database is not accurate. A good calculation tool is transparent on the used
database. The presentation of the results (4) is important for the reporting company as they want
insight in their emissions and not just the opportunity to offset their emissions by using their credit card.
At last the usability of the tool (5) will be benchmarked in the form of the availability of an instruction
manual, costs involvement, accessibility, download opportunities and language.
Table 4: Carbon calculation tool benchmark framework
Data
Name
Content
Name of the paper/calculator
Country
Country of origin
1. Method
What is the used calculation method?
2. Input
Input asked on fuels and distance traveled, number of
available fuels
Method/Protocol
Reliability activity
data options
Completeness
Transparency
emission factors
Source
Verifiable
Absolute numbers
Relative numbers
Graphs
Monitoring
Other
Availability subjects (related to subjects in scopes GHG
Protocol)
3. Calculation
Emission factors are directly visible within the tool
Principle GHG
Transparancy
Relevance,
accuracy
Completeness
Transparancy
Internal source (own resource/model) or external source Transparancy,
(including reference)
accuracy,
consistency
Whether the exact source (including the exact data) of the Transparancy
emission factor can be retrieved
4. Results
Distribution of results (aggregation, per subject)
Results shown per relative unit (e.g. turnover)
Results presented using graphs
Attention to monitoring and reduction goals
Other available tools?
Consistency
Relevance
Completeness
Completeness
Completeness
Page | 22
Manual
Cost
Access
Reporting
Language
5. Usability tool
Available instruction manual?
Costs involvement
How to gain access (login, etc.)
Download opportunities
Available languages for the tool
Completeness
Completeness
3.4 Sensitivity analysis, results and strategy forming
The main goal of the developed assessment tool is that insight in carbon emissions and energy use lead
to action in the form of implementing a reduction strategy. The three-step approach of the website is 1.
Scan (inventory), 2. Analyze (use analysis tool) and 3. Reduce (further elaborated in chapter 4.2).
To measure whether the developed assessment tool is fulfilling this goal, two case studies will be
performed. The first case study is the assessment of a fictive company called Virtucon which has
multiple opportunities to lower their carbon emissions, but they do not have insight which opportunity
is the most effective. The activity data of Virtucon will be used as input for the developed assessment
tool as for assessment tools that are already on the market (same tools as used for benchmark, Table 3).
By benchmarking the results of the assessment it is possible to analyze whether or not the developed
assessment tool has an added value compared to the already available (free) assessment tools. Due to
privacy issues fictive activity data will be used in the case study. The second case study is of a real
company. The company Loo van Eck is willing to use the developed assessment tool and provide
feedback in the form a written review (the results of the assessment are not published due to privacy
issues).
Case study 1) Fictive company Virtucon
Virtucon is a company that is specialized in product design. There core activities are making online 3D
models and play an advisory role for their customers. The office is located in Utrecht and has a surface
area of 600 m2. The electricity (grey) use is 45,000 kWh and gas use 8,500 m3 per year. In total 15
employees use lease cars (financial lease) in which they travel in total 300,000 kilometers per year (of
which approximately 75% is commuting and 25% business travel). According to the fuel cards they used
12,000 liters of diesel and 6,500 liters of gasoline. Also five employees commute by bike and five
employees use the train and bus (in total 57,500 passenger kilometers by train and 2,300 passenger
kilometers by bus).
The company owns 2 cars which are used for business travel (total distance traveled: 60,000 km using
4,000 liters of diesel). Also they made 10 business trips by airplane (10 short trips of single 1,500
passenger kilometers, 8 medium trips of single 3,500 passenger kilometers and 2 long trips of single
8,500 passenger kilometers) and 6 trips by international train (average 900 passenger kilometers per
trip). The investment opportunities as defined by Virtucon are:
Page | 23
Project A – Replacement of an old air-conditioning unit
In order to replace an old air-conditioning unit with a more energy efficient unit will require a netinvestment of EUR 15,000. It is expected that the yearly electricity savings are 5.000 kWh.
Project B – Replacement of 2 company cars
The net-investment costs of the replacement of two company cars will be EUR 60,000. The current cars
have an efficiency of 6.7 liters of diesel per 100 km. The replacement cars have an efficiency of 5 liters of
diesel per 100 km, saving 1,020 liter of diesel per year.
Project C – Placing solar panels
The installation of solar panels with a power output of 10 kWpeak will have net-investment costs of EUR
25,000. On average the solar panels are expected to deliver 9,000 kWh per year.
CO2 abatement cost curve
The projects will be compared and analyzed using a CO2 abatement cost curve. To determine the specific
CO2 mitigation costs the following equation (Blok, K., 2007) is used:
Equation 4: Specific CO2 mitigation costs
Where,
Equation 5: Determining α
Legend
α*I
= annual capital costs (based on net…investment* costs)
C
= annual operation and maintenance costs
B
= annual benefits
ΔMco2 = annual amount of avoided amount CO2
emissions
r
= discount rate
L
= Lifetime of the project
Within this research the discount rate (r) is determined on 5%.
* Net-investments are the investments costs of the project (e.g. more efficient technology) minus the
residual value of the technology that is currently in service. Assuming that the technology that is
currently in use is sold in thereby fully depreciated.
Net-investment(project) = investment costs(project) - residual value (technology currently in service)
Case study 2) Loo van Eck
Loo van Eck is a consultancy office focused on training and advice in the field of communication. They
will use Energiescanner to determine their carbon and energy footprint. Due to the privacy-sensitive
information that is associated with carbon and energy accounting feedback will only provided in the
form of a review of Energiescanner. This review will evaluate all aspects regarding the use of
Energiescanner and the results provided by Energiescanner.
Page | 24
4. Development accounting tool: Energiescanner
First the framework on which the accounting tool is based will be described (4.1). The next chapter
elaborates on the constructed accounting tool from a user perspective (4.2). In the following chapter the
development of a consistent database with carbon and energy factors will be described (4.3), followed
by the values of the carbon and energy factors (4.4).
4.1 Framework web-based accounting tool
The objective of this research is to develop an easy to use and transparent (web-based) assessment tool
which enables non-ETS companies to get reliable and consistent insight in their GHG emissions and
energy use. As described in chapter 2.2 it takes seven steps to create a carbon accounting inventory.
During the development of the inventory it is important to keep in mind the five guiding principles
(chapter 2.3). The importance of these guiding principles are also recognized in scientific literature such
as Bown & Wittneben (2011) who mention three main pillars for carbon accounting are accuracy,
consistency and certainty.
Framing the objective
The easy to use part means that not every company has to re-invent the wheel in the form of building an
accounting inventory from scratch. Users should not have to become an expert in the field of carbon
accounting in order to calculate a carbon footprint. The table below provides an overview who is in
control or responsible of a specific step of the GHG Protocol framework.
Table 5: Development of a reliable and consistent accounting tool
GHG Framework
Step 1) Assign resources
Step 2) Design GHG inventory
Step 3) Collect data
Step 4) Calculate emissions
Control/responsible
Reporting company
Energiescanner
Reporting company
Energiescanner
Step 5) Set up target
Step 6) Reduce emissions
Reporting company
Reporting company/
Energiescanner
Reporting company/
Energiescanner
Step 7) Report results
Guiding principle
Relevance
Relevance, Completeness
Accuracy (activity data)
Consistency, Transparency, Accuracy,
(database)
Relevance, Transparency
Relevance, Completeness, Consistency,
Transparency
Relevance, Completeness, Consistency,
Transparency, Accuracy
Step 1) Assign resources
The reporting company has to form a project team who are responsible for setting the boundaries of the
company and adapt some of the administrative and operational procedures in order to gather relevant
activity data. This team will stay responsible for the whole project and need to have the support of the
senior-management.
Page | 25