CHALLENGES OF HPLC METHOD DEVELOPMENT AND VALIDATION FOR THE ASSAY OF COMBINED DRUG PRODUCTS
Bạn đang xem bản rút gọn của tài liệu. Xem và tải ngay bản đầy đủ của tài liệu tại đây (7.2 MB, 104 trang )
Ph.D. Thesis
CHALLENGES OF HPLC METHOD
DEVELOPMENT AND VALIDATION FOR THE
ASSAY OF COMBINED DRUG PRODUCTS
Éva Kalmár, Pharm.D.
Szeged
2014
Ph.D. Thesis
CHALLENGES OF HPLC METHOD
DEVELOPMENT AND VALIDATION FOR THE
ASSAY OF COMBINED DRUG PRODUCTS
Éva Kalmár, Pharm.D.
Supervisors
Prof. György Dombi, Ph.D., C.Sc.
Gerda Szakonyi, Ph.D., Pharm.D.
University of Szeged
Faculty of Pharmacy
Institute of Pharmaceutical Analysis
Szeged
2014
TABLE OF CONTENTS
TABLE OF CONTENTS
Abbreviations ............................................................................................................................iii
List of figures ............................................................................................................................ iv
List of tables ............................................................................................................................... v
List of publications and lectures ................................................................................................ vi
Full papers related to the thesis .......................................................................................... vi
Scientific lectures related to the thesis ............................................................................... vi
Other publications, lectures .............................................................................................. vii
1.
Introduction and aims ......................................................................................................... 1
2.
Literature ............................................................................................................................. 2
2.1. Tested pharmaceutical dosage forms......................................................................... 2
2.1.1. Oral powders .................................................................................................. 2
2.1.2. Suppositories .................................................................................................. 2
2.2. Analysed drug substances.......................................................................................... 5
2.2.1. Aminophenazone............................................................................................ 5
2.2.2. Paracetamol .................................................................................................... 6
2.2.3. Acetylsalicylic acid ........................................................................................ 6
2.2.4. Papaverine ...................................................................................................... 7
2.3. Analytical methods .................................................................................................... 7
2.3.1. Development of HPLC assay ......................................................................... 7
2.3.2. The CMC and its determination ..................................................................... 9
2.3.3. Cerimetric titration of AMFZ....................................................................... 10
3.
Materials and methods ...................................................................................................... 11
3.1. Materials .................................................................................................................. 11
3.2. Methods ................................................................................................................... 12
3.2.1. Preparation of reference solutions and establishment of system suitability 12
3.2.2. Titrimetric analysis of suppositories with AMFZ ........................................ 13
3.3. Instruments and other equipment ............................................................................ 13
4.
Results ............................................................................................................................... 15
4.1. Part I. Development and validation of HPLC assays .............................................. 15
4.1.1. Chromatographic separation problems of drugs with different polarities.... 15
4.1.2. Chromatographic assay of AMFZ and paracetamol for suppository study . 23
4.2. Part II. Challenges in the development of sample preparation for suppositories .... 30
i
TABLE OF CONTENTS
4.2.1. Suppositories without surfactants ................................................................ 30
4.2.2. Surfactant-containing suppositories ............................................................. 31
4.2.3. CMC determination: CMCs of TWEEN 20 and TWEEN 60 ...................... 34
4.2.4. Stability verification of the drugs by NMR spectroscopy during sample
preparation.................................................................................................... 37
4.2.5. Dissolution tests of hard fat and W35TT suppositories ............................... 39
4.2.6. Extension of the validation study with matrix-dependent performance
characteristics ............................................................................................... 40
4.3. Part III. Quantitative analysis of magistrally produced suppositories ..................... 42
4.3.1. Comparison of the assay results obtained with cerimetric titration
and HPLC..................................................................................................... 42
4.3.2. Dosage uniformity study of magistrally produced suppositories ................. 43
4.3.3. Effects of f on the assay results .................................................................... 44
4.3.4. Effects of stirring on the homogeneity and total assay of the samples ........ 45
5.
Final conclusions .............................................................................................................. 46
5.1. Conclusions of Part I ............................................................................................... 46
5.2. Conclusions of Part II .............................................................................................. 46
5.3. Conclusions of Part III............................................................................................. 47
Summary................................................................................................................................... 48
Acknowledgements .................................................................................................................. 50
References ................................................................................................................................ 51
Supplement ............................................................................................................................... 59
Appendix .................................................................................................................................. 65
ii
ABBREVIATIONS
Abbreviations
ACN:
acetonitrile
AMFZ:
4-(dimethylamino)antipyrine
API:
active pharmaceutical ingredient or active substance
ASA:
acetylsalicylic acid
CMC:
critical micelle formation concentration
EP:
see Ph Eur
f:
displacement factor
HPLC:
high-performance liquid chromatography
MeOH:
methanol
NIR:
near infrared spectroscopy
NMR:
nuclear magnetic resonance
OTC:
over-the-counter
Ph Eur:
European Pharmacopoeia
RP-HPLC:
reversed-phase HPLC
R&D:
research and development
UHPLC:
ultra high-performance liquid chromatography
US:
ultrasonic
USP:
United States Pharmacopeia
UV/VIS:
ultraviolet/visible
W35TT:
adeps solidus compositus
iii
LIST OF FIGURES
List of figures
Figure 1 Potential uptake locations of the drug from the different sections of the rectum ........ 3
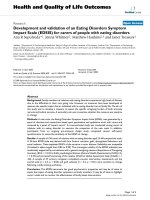
Figure 2 log D vs. pH curves of paracetamol, ASA and papaverine........................................ 15
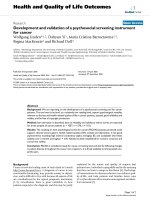
Figure 3 Chromatograms obtained on Hypersil ODS (a), Luna C18 (b) and Zorbax SB-18
(c) columns. Coeluting peaks are magnified in the insets ........................................ 16
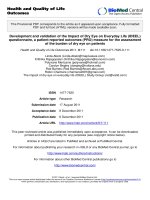
Figure 4 Selectivity and hydrophobicity comparison of the three columns in the database
of Waters .................................................................................................................. 17
Figure 5 Comparison of the three stationary phases. It can be observed that papaverine
was completely retained on Hypersil ODS .............................................................. 18
Figure 6 Robustness test results ............................................................................................... 22
Figure 7 Initial chromatogram of development ........................................................................ 24
Figure 8 log D curve of aminophenazone by Pallas ................................................................. 24
Figure 9 UV spectrum of paracetamol in MeOH ..................................................................... 26
Figure 10 AMFZ robustness test results ................................................................................... 29
Figure 11 Paracetamol robustness test results .......................................................................... 29
Figure 12 Recovery of AMFZ and paracetamol. (a) Effects of NaCl concentration. (b)
Effects of pH. (c,d) Effects of pH at constant c(NaCl) = 100 mM. Vertical bars
denote means of 3 independent measurements (n=3), error bars indicate the
standard deviation of the 3 data. Covariances between the independent variable
(concentration) and the dependent variable (recovery) for plot a=28.67; b=13.47; c=58.71 and d=75.38 ..................................................................................... 32
Figure 13 Theoretical figure of micelle-breaking mechanism ................................................. 34
Figure 14 Turbidimetric plots for determination of CMCs of Tween 20 (▪), Tween 60 (▪),
Tween 20 & 60 (▪) and Tweens 20 & 60 with salt and base (▪) ............................... 36
Figure 15 1H NMR spectra of aminophenazone and paracetamol standards and samples.
The signals marked with letters prove that no decomposition takes place in the
sample solution treated with strong base. Peaks a and b of paracetamol are
shifted to the right by 0.2 ppm due to the deprotonation of the OH and NH
groups in the alkaline medium ................................................................................. 38
Figure 16 Dissolution profiles of AMFZ containing hard fat (•) and W35TT (♦)
suppositories ............................................................................................................. 39
Figure 17 The flow chart of the sample preparation procedure ............................................... 43
Figure 18 Mean API contents for the samples, with the standard deviations. An API
content in the interval 85-115% is satisfactory. Samples Ph1-Ph9: measured by
HPLC; samples Ph10-Ph15 measured by cerimetric titration .................................. 44
iv
LIST OF TABLES
List of tables
Table 1 CMCs of Tween 20 and Tween 60 ................................................................................ 9
Table 2 Concentrations of standard APIs ................................................................................. 12
Table 3 Chromatographic parameters of the sample peaks on the three columns; k’ is the
retention factor, α the separation factor, Rs the resolution and tR the retention
time ........................................................................................................................... 19
Table 4 Solvent gradient in the chromatographic method described in section 3.1 ................. 19
Table 5 Results of solution stability studies ............................................................................. 27
Table 6 Surfactant concentration ranges of CMC determination ............................................. 35
Table 7 Calculation of CMCs from the data of fitted straight lines ......................................... 35
Table 8 Assay results on factory-produced suppository samples, measured by titrimetry or
HPLC ........................................................................................................................ 42
Table 9 Average assay results on the samples and standard deviations in the homogeneity
study ......................................................................................................................... 45
Tables in supplement
Table S-1 Results of accuracy studies ...................................................................................... 60
Table S-2 Results of method robustness tests .......................................................................... 61
Table S-3 Results of robustness studies. The second line of every condition changed refers
to the nominal value of the parameter ...................................................................... 62
Table S-4 Results of AMFZ accuracy studies .......................................................................... 63
Table S-5 Results of accuracy measurement of paracetamol in W35TT ................................. 64
v
LIST OF PUBLICATIONS AND LECTURES
List of publications and lectures
Full papers related to the thesis
É. Kalmár, K. Ueno, P. Forgó, G. Szakonyi, G. Dombi
Novel sample preparation method for surfactant containing suppositories; effect of micelle
formation on drug recovery
Journal of Pharmaceutical and Biomedical Analysis 2013 (83) 149-156
IF: 2.947*
É. Kalmár, J. Lasher, T. Tarry, A. Myers, G. Szakonyi, G. Dombi, G. Baki and K. Alexander
Dosage uniformity problems which occur due to technological errors in extemporaneously
prepared suppositories in hospitals and pharmacies
Saudi Pharmaceutical Journal, accepted for publication
IF: 0.954*
É. Kalmár, A. Gyuricza, E. Kunos-Tóth, G. Szakonyi, G. Dombi
Simultaneous quantification of paracetamol, acetylsalicylic acid and papaverine with
validated HPLC method
Journal of Chromatographic Sciences, accepted for publication
IF: 0.749*
É. Kalmár, B. Kormányos, G. Szakonyi, G. Dombi
Validated HPLC determination of 4-dimethylaminoantipyrine in fundamentally different
suppository bases
Indian Journal of Pharmaceutical Sciences, accepted for publication
IF: 0.338*
*
2012 data
Scientific lectures related to the thesis
É. Kalmár:
Kromatográfiai technikák - Gyógyszerfejlesztés analitikai problémái
QP3 Továbbképzés
16. April 2013, Szeged, HU
(lecture)
É. Kalmár:
Tenzid tartalmú kúpok analitikai problémái és megoldásai
KEN XXXV. Kémiai Előadói Napok
29-31. October 2012, Szeged, HU
(lecture)
É. Kalmár, B. Kormányos, G. Szakonyi, G. Dombi
Fast efficient and robust UHPLC determination of 4-dimethylaminoantipyrine from different
types of suppository vehicles
4th ISMCK International Student Medical Congress
21-24. June 2012, Košice, Slovakia
(lecture)
É. Kalmár, B. Kormányos, G. Szakonyi, G. Dombi
Fast and robust HPLC method for aminophenazone assay from distinct suppository bases
TÁMOP- From molecule to drug
24-25. May 2012, Szeged, HU
(poster)
vi
LIST OF PUBLICATIONS AND LECTURES
Kalmár É.:
Aminofenazon tartalmú magisztrális gyermekkúpok hatóanyagtartalmának ellenőrzése
X. Clauder Ottó Emlékverseny
13-14. October 2011, Budapest, HU
(lecture)
Other publications, lectures
Gyógyszeranalitika gyakorlati útmutató (fejezetek: komplexometria, konduktometria, HPLC
analízis, atomspektroszkópia)
Gyakorlati jegyzet, SZTE GYTK, Gyógyszeranalitikai Intézet
(book chapter)
K. Jósvay, A. Buhala, Z. Winter, T. Martinek, E. Wéber, L. Németh, A. Hetényi, É. Kalmár,
G. Dombi, Z. Oláh, G. Szakonyi
TRPV1 and calmodulin interaction
EFIC® – 8th “Pain In Europe” Congress
9-12. October 2013, Firenze, Italy
(poster)
G. Szakonyi, K. Jósvay, A. Buhala, Z. Winter, É. Kalmár, F. Ötvös, Cs. Vízler, G. Dombi, Z.
Oláh
Investigation of vanilloid receptor – a target for novel pain killers
5th BBBB International Conference
26-28. September 2013, Athens, Grece
(poster)
A. Buhala, K. Jósvay, Z. Winter, L. Pecze, É. Kalmár, Gy. Dombi, Z. Oláh, G. Szakonyi
Structural Analysis of the human TRPV1 receptor
Hungarian Molecular Life Sciences
5-7. April 2013, Siófok, HU
(poster)
É. Kalmár
Hatóanyag tartalom meghatározása kromatográfiás módszerekkel - Validálás
Hétcsillagos gyógyszerész-SZTE GYTK továbbképzése, Szent-Györgyi Napok 2012.
15-17. November 2012, Szeged, HU
(lecture)
H. D. Szűcs, A. Tököli, É. Kalmár, G. Szakonyi, G. Dombi
MDR membránfehérje-családok vizsgálata során felmerülő nehézségek
42. Membrán transzport Konferencia
15-18. May 2012, Sümeg, HU
(poster)
É. Kalmár, H. D. Szűcs, G. Dombi, G. Szakonyi
AcrB homológ membránfehérjék expressziós problémái
41. Membrán transzport Konferencia
17-20. May 2011, Sümeg, HU
(poster)
Z. Winter, K. Jósvay, É. Kalmár, F. Ötvös, Z. Oláh, T. Letoha, G. Dombi, G. Szakonyi
A TRPV1 csatorna szerkezetének vizsgálata
41. Membrán-transzport Konferencia
17-20. May 2011, Sümeg, HU
(poster)
É. Kalmár, H. D. Szűcs, G. Dombi, G. Szakonyi
AcrB homológ membránfehérjék expressziója Escherichia coliban
40. Membrán Transzport Konferencia
18-21. May 2010, Sümeg
(poster)
É. Kalmár
Sclerosis Multiplex betegek liquor mintáinak NMR vizsgálata
IX. Clauder Ottó Emlékverseny
23-24. April 2009, Budapest, HU
(lecture)
vii
1. INTRODUCTION AND AIMS
1. Introduction and aims
Pharmaceutical analysis is one of the most challenging fields of analytical chemistry.
Pharmaceutical analysts carry out the qualitative and quantitative control of APIs and drug
products and also develop and validate appropriate methods. These methods are routinely
used by manufacturing companies in process testing and by authorities for the quality control
of drug products. In the vast majority of pharmaceutical analyses, instrumental analytical
methods are applied. The most widespread of all techniques is HPLC, which is complemented
or hyphenated with mass spectrometry, spectrophotometry, NMR or others. In consequence of
its dominant role in the pharmaceutical industry, HPLC is developing with huge leaps
nowadays. UHPLC is increasingly making conventional HPLC obsolete. The field of coreshell particles, the application of new detection techniques or 2D chromatography and the
very popular hyphenated systems provide many interesting problems or challenges.
Nevertheless, it should not be forgotten that these development directions are very
cost-intensive, as up-to-date instruments and even columns are very expensive. Smaller
national pharmaceutical companies and state-financed control laboratories of national
authorities therefore cannot always follow the development of instrumental analysis in this
direction. One of my main goals was to develop modern, rapid, precise and reproducible, but
also cost-effective HPLC assay methods which are generally available and applicable for
most users.
The development of sample preparation from complex drug products is the most
challenging area of assay method development for HPLC. To demonstrate this, I have chosen
to show two examples in my thesis. In the first example, the development problem relates to
the separation of three physico-chemically different APIs of a multicomponent drug product.
In the second example, the challenge is the complete recovery of the API from various
complex suppository dosage forms manufactured with different bases.
Even today a significant number of suppositories are prepared extemporaneously in
Hungary. Most are prepared by clinical pharmacies for paediatric use. The magistral
preparation of suppositories is cheap; moreover, customized personal therapy can be achieved
much better through their use. On the other hand, the independent quality control of such
products by authorities is not carried out at present. Accordingly, I would like to stress here
how important this topic is and, by demonstrating the consequences of technological errors
that may be committed during preparation, I would like to contribute to improving the quality
of extemporaneous pharmaceutical manufacturing in pharmacies.
1
2. LITERATURE
2. Literature
2.1. Tested pharmaceutical dosage forms
2.1.1. Oral powders
An oral powder as a pharmaceutical dosage form containing solid, loose, dry ingredients,
including one or more APIs with or without excipients. It is generally administered in or with
water or another suitable liquid. It may also be swallowed directly. It is presented as single-
dose or multidose preparations. Multidose oral powders require the provision of a measuring
device capable of delivering the quantity prescribed. Each dose of a single-dose powder is
enclosed in an individual container, for example a sachet or a vial [1].
Oral powders are currently very popular dosage forms. Especially favoured are the
granule forms of various OTC preparations, such as ACC®, Aspirin® or Neo Citran®. Their
main advantage over compressed dosage forms is the larger specific surface, the less
significant incompatibility issues and the comparative ease of adding taste maskers and
colouring agents during formulation. When a rapid effect is desired, the API, for example an
analgesic drug can be applied in oral powder dosage form (Flector®).
2.1.2. Suppositories
Suppositories are currently very popular formulations especially in paediatrics, where
they can be used for the effective lowering of fever. The choice of a suppository as the mode
of drug delivery is justified in all cases when oral delivery is impossible, that is an
unconscious or vomiting patient, or in the case of infants.
The therapeutic effect of correctly applied suppositories can be compared with that of
injections because the API can penetrate from the lower tract of the rectum to the vena anales,
thereby avoiding the vena portae and the liver, and can exert a systemic effect when
transported to the vena cava inferior, so the API does not undergo a first pass effect
(Figure 1).
The therapeutic use of suppositories has another aspect worldwide at present. The
suppository dosage form is widely used for various therapeutic indications, making use of the
feature that the local effect of the suppository can be transformed into therapeutic benefit (e.g.
in the treatment of asthma, ulcerative colitis, ulcerative proctitis or colorectal cancer in
paediatric practice) [2-8]. The treatment of acute malaria in children requires combination
2
2. LITERATURE
therapy in order to avoid the development of multidrug resistance. In these scenarios, it is a
plausible solution to deliver one of the drugs of the combination in a suppository [9, 10]. Thus,
a rapid systemic effect can be achieved. For the delivery of several non-steroid antiinflammatory drugs, such as paracetamol or indometacin, the efficacy of the suppository form
is equivalent or superior to that of the oral route [11-14].
Figure 1 Potential uptake locations of the drug from the different sections of the rectum
In
Hungarian
pharmaceutical
practice,
extemporaneous
products
including
suppositories are just as popular as factory-produced medicines. Extemporaneous products
comprise part of personal therapy, and take into account the physical status, age and other
diseases of the patient. Extemporaneously produced pharmaceuticals are used particularly in
paediatric clinical departments.
Approximately 80% of the suppositories used in Central Europe are produced
extemporaneously by moulding technique. In clinical pharmacies quantities of 100-300 and in
independent pharmacies 10-12 suppositories are generally moulded as one batch. Suspension
suppositories in particular are formulated with a solid fat vehicle (e.g. Witepsol 35) or a
combination of this suppository base with surfactants [15]. The core of this technology is the
dispersion of the finely powdered drug in the molten suppository base, after which the
suspension is moulded under continuous stirring. The viscosity of fatty suppository bases is
very low, and decreases still further with the increase of temperature, causing rapid
sedimentation of the suspended particles and leading to an inhomogeneous product. When the
liquid mass is moulded at around the solidification point, solidification occurs immediately
when the mass enters the mould, making further additions of the base and drug impossible. In
the calculation of the suppository base weight, Eq. 1 must be applied:
3
2. LITERATURE
n
Tm = E − ∑ f i ⋅ s i
(1)
i=1
where Tm is the suppository base to be weighed, E is the calibration constant of the mould, fi is
the displacement factor of the ith component and si is the weight of the ith component. During
the calculation of a correct formula, it is not sufficient to subtract the weight of the solid
components from the final weight of the suppository to obtain the required amount of
suppository base. We have to know the value of E for the specific mould and the specific
suppository base, which can be determined through independent measurements. Ten
suppositories are moulded with the mould, using the pure base, and after cooling they are
weighed and the average suppository weight is calculated. This average value will be used as
the calibration constant of the mould for the specific base. As the density of the API
incorporated in the suppository can differ from that of the base, the displacement factor (f) is
required to compensate the difference in densities. The value of f, which shows how much
base will be displaced by unit weight of API, can be calculated from Eq. 2:
f=
100 ⋅ (E − G)
+1
G⋅x
(2)
where E is the weight of the blank suppository containing only base, G is the weight of the
suppository containing the API in known concentration, and x is the API content of the
suppository in weight percentage. If the pharmacist fails to carry out the steps in strict
accordance with the rules, significant deviations will be observed in the results of the
homogeneity of the batch and in the total drug content of the batch. In pharmacies, the
f values of the most frequent APIs in the most common bases are not generally available.
According to good manufacturing practice, pharmacists apply the principle of overage during
the calculation of the batch composition, but an incorrect calculation for the amount of vehicle
required and other technological errors may lead to serious deviations in the final dosage for
the individual suppositories [16-18].
In Hungarian pharmaceutical practice, moulded suppositories are formulated
predominantly with three suppository bases: adeps solidus, massa macrogoli and W35TT,
which contains surfactants. The lipophilic adeps solidus is officially included in Ph Eur as
hard fat or Witepsol W35. Massa macrogoli is a hydrophilic base, which contains: macrogol
1540 and Span 20. W35TT is a special lipohydrophilic base, which is included officially in
FoNo. It is a mixture of 95 w/w% of hard fat, 2.5 w/w% of Tween 20 and 2.5 w/w% of
4
2. LITERATURE
Tween 61. In consequence of procurement issues relating to Tween 61, Tween 60 is
nowadays used instead.
Numerous studies that have focused on the liberation of drugs from suppositories
containing surfactants from the aspect of pharmaceutical technology have clearly revealed
that it is beneficial for a suppository base to have high hydroxyl group content. The usage of
non-ionic surfactants is now suggested, but in lower amounts than those used in older recipes,
which generally means lower than 3%, and preferably around 1% [19]. A high surfactant
concentration may lead to the formation of micelles, which incorporate some of the API,
impeding its release [20]. According to Ghorab et al. [21], the optimum amount of Tween 60
is 5%; higher proportions than that up to 10% had a lower effect on the release rate. Above
10%, the release rate is decreased due to micelle formation. Surfactants not only enhance
release of the drug from the suppository base, but increase the permeability of the tissues
surrounding the rectal lumen. Non-ionic surfactant Tween 20 showed outstanding
effectiveness when used in 5% combined with lipophilic vehicles [22].
2.2. Analysed drug substances
2.2.1. Aminophenazone
CH3
AMFZ is a phenazone derivative. It is a white crystalline powder
which is soluble in water and freely soluble in alcohol. Its pKa is 4.70,
N
H3C
CH3
and its log P is 0.99. AMFZ is an antipyretic and analgesic drug, for
®
N
O
®
example in Demalgon tablet or Germicid suppository. This API is
N
CH3
frequently used in clinical paediatric practice in Hungary, especially as
an extemporaneous dosage form [23-26].
The antifebrile effect of AMFZ develops especially quickly (comparable to that of
injections) if the drug is taken rectally. An additional benefit is that its administration does not
require specially trained staff. Agranulocytosis, one of the registered side-effects of the
substance, has a very low incidence, while carcinogenicity, another possible side-effect, can
be completely eliminated through rectal administration [27-35]. During its biotransformation,
AMFZ is demethylated in two steps, catalysed by cytochrome P450 2B [28, 29]. The
demethylated product then undergoes acetylation and is eliminated from the body as
acetylaminoantipyrine. In the presence of nitrite ion at pH between 2.0 and 3.1, the
carcinogenic nitrosamine derivative dimethylnitrosamine is formed in parallel with the
demethylation. The physiological circumstances in the stomach provide a suitable medium for
5
2. LITERATURE
this reaction to take place [36-38]. On the other hand, rectal administration of AMFZ
completely eliminates the possibility of dimethylnitrosamine formation as the pH of the
mucous fluid in that region is around 7.9.
2.2.2. Paracetamol
H
N
Paracetamol or acetaminophen is one of the most frequently
used antifebrile and painkiller drugs around the world. It has been
used in Hungary only since 1990. It is incorporated in many well-
CH3
O
HO
known products (Rubophen®, Panadol®, Coldrex®, Mexalen®, Miralgin®, Neo Citran® and
Saridon®). It is an aniline derivative. It is a white, crystalline powder, which is moderately
soluble in water and freely soluble in alcohol. Its calculated pKa is 9.48 and its log P value is
0.53 [24, 26, 39].
Usually it is not classified as an NSAID because it does not show a significant antiinflammatory effect. In the event of an overdose, it causes acute liver failure. This is due to
the saturation of conjugation with sulphate and glucuronide systems, which generate nontoxic
metabolites, leading to the conversion of paracetamol to the highly reactive intermediate
metabolite N-acetyl-p-benzoquinoneimine (NAPQI) via the cytochrome P450 2E1 and 3A4
enzyme system, which becomes predominant. Excess amounts of NAPQI and glutathione are
produced, which are responsible for decreased detoxification. Acetylcysteine can be used as
the antidote of paracetamol toxication, which reduces paracetamol toxicity by rebuilding body
stores of glutathione. Glutathione reacts with the toxic NAPQI metabolite so that it does not
damage cells and can be safely excreted [40-42].
2.2.3. Acetylsalicylic acid
O
ASA is a white, odourless, crystalline powder, which is slightly soluble
in water and freely soluble in alcohol. It is used as a painkiller, antifebrile or
OH
anti-rheumatic drug. Its pKa is 3.83, and its log P is 1.25 [24, 26, 43].
For the mitigation of acute renal or gastrointestinal pain, the primary
drug of choice is a NSAID such as ASA, paracetamol or ibuprofen [44].
6
O
O
CH3
2. LITERATURE
2.2.4. Papaverine
O
Papaverine is a white, crystalline powder that is
H3C
moderately soluble in water and alcohol. It is freely
H3C
N
O
soluble in hot water. Its solubility can be increased by
O
CH3
decreasing the pH of the aqueous medium. It is an alkaloid
CH3
of opium. It has a smooth muscle relaxant effect [40, 45].
O
Its pKa is 6.12 and its log P is 3.92 [26]. A number of drug products are available on the
market for the treatment of smooth muscle spasm, e.g. in the biliary, renal and intestinal tracts
(BILA-GIT®). Such conditions are frequently treated with combined products, which contain
a smooth muscle antispasmodic together with one or more NSAID painkiller drugs [46]. The
combination of papaverine-HCl or papaverine base and ibuprofen or indometacin is nowadays
commonly used, especially for the treatment of dysmenorrhoea. As regards the administration
of papaverine, the research focus has shifted in recent years from the gastrointestinal tract to
the coronary arteries [47] and the therapy of an erectile dysfunction [48-50, 40]. Nevertheless,
in pharmaceutical practice, papaverine is still commonly prescribed as an antispasmodic to
relieve gastrointestinal and menstrual spasms.
2.3. Analytical methods
2.3.1. Development of HPLC assay
As an analytical technique, HPLC possesses a very impressive history, which has been
extensively studied by many authors [51-55]. In my thesis, the focus is placed on the
development of sample preparation methods and assay determination of pharmaceutical
products. A deep theoretical introduction on the separation of small molecules will therefore
not be included.
One of the most important tasks of a chromatographic analyst in pharmaceutical R&D is
the development of analytical methods for the assay of pharmaceutical products and
validation of the methods before submission.
The most challenging key step in this process, especially in the case of complex dosage
forms (such as suppositories, extended release tablets, etc.), is the sample preparation. In this
step, the API must be separated from the matrix, which can be a very complex task if both
identification and quantitative determination are required. To achieve optimum recovery, the
total API content of the product must be liberated. The European Pharmacopoeia does not
7
2. LITERATURE
provide any guidance as concerns general sample preparation for the assay of any dosage
form; details are included only in the pharmaceutical technological procedures. The US
Pharmacopoeia, on the other hand, contains monographs about pharmaceutical products,
including suppositories [16]. According to the literature, samples can be divided into 4
groups: solid or liquid pharmaceutical products, biotechnological samples (proteins) or
biological samples (blood, urine, tissue fluid, etc.). In the case of solid dosage forms,
dissolution of the API from the finely ground powder of the sample with an appropriate
solvent is necessary. It should be noted that the solvent must be compatible (miscible) with
the chosen mobile phase of the chromatographic system. In the event of liquid dosage forms,
this step is much simpler. On the other hand, solubility problems may arise, partition of the
API between solvents of different polarity can be observed, or a change in solubility can
occur with the change of pH. It may be generally stated that physical interactions of APIs and
excipients that potentially cause problems during recovery are studied very rarely. Sample
preparation should be handled within the scope of method development.
During method development for HPLC, there are many options beyond those in the
scientific literature to design or to predict the behaviour of the system. The main goal is
always to separate the analytes from each other and from other components of the sample in a
rapid, reproducible, accurate and robust method which provides optimum peak shape and
theoretical plate number.
HPLC method development is currently aided by many expert systems, such as the
Pallas program package or the Marvin program package. In order to design the separation, it
is necessary to know the basic physico-chemical parameters (log P, pKa and log D), which
can provide guidance to reach the optimum method in the fewest development steps. log P
determines the polarity of the compound, which is a fundamental parameter of the retention.
pKa facilitates determination of the pH range in which a robust method can be developed, and
also aids the choice of appropriate buffer system. log D describes the change in polarity of the
compound vs. pH. It is a good indicator of how the retention may change in the studied pH
range. The log D vs. pH function presents the distribution change of the dissociated and nondissociated forms. Thus, the mobile phase composition can be effectively designed on the
basis of the predicted pKa and log D vs. pH curve, obtained from the expert system. In some
cases, the sequence of elution of the components can also be effectively estimated.
If the retention factors of the components differ too widely (k’1-k’2 > 10), it is suggested
to apply gradient elution instead of isocratic elution. In gradient elution, the composition of
the mobile phase is varied as a function of time. The application of gradients can effectively
8
2. LITERATURE
decrease the retention of selected components if the concentration of the stronger component
in the mobile phase is increased.
2.3.2. The CMC and its determination
One of the most characteristic properties of a surfactant is its CMC. In a specific solvent
system, this is the concentration above which individual surfactant molecules spontaneously
aggregate and form micelles through secondary interactions. Several methods are available
for the determination of CMC. The most widely used techniques are the measurement of
surface tension, conductance in the case of ionic surfactants, UV/VIS spectrophotometry, NIR
spectroscopy, turbidimetry and densitometry [56, 57]. As the suppository base studied in the
present work contained Tween 20 and Tween 60, in Table 1 the CMCs of these materials
determined with different methods in previous studies are listed.
Table 1 CMCs of Tween 20 and Tween 60
TWEEN 20
Reference Method
[58]
[59]
[60]
[61]
[62]
[63]
[64]
[65]
Surface tension
NIR
Surface tension
Densitometry
Surface tension
Spectrophotometry
iodine absorbance
Shift in λmax
Surface tension
Surface tension
Dye micellization
Surface tension
TWEEN 60
[61]
Densitometry
Spectrophotometry
[63]
iodine absorbance
Shift in λmax
Surface tension
[64]
Surface tension
[65]
Dye micellization
Surface tension
Temperature
of
of
RT
RT
RT
24.88 °C
RT
Medium
H2O
0.0804
0.08
0.0488
0.097
0.059
D 2O
0.12
-
Spec.a
70
-
RT
0.055
-
-
RT
RT
RT
RT
RT
0.0557
0.0488
0.048
0.042
0.011
-
-
24.88 °C
0.068
-
-
RT
0.0209
-
-
RT
RT
RT
RT
RT
0.0196
0.0206
0.021
0.022
0.0055
-
-
a
1-ethyl-3-methylimidazolium bis(trifluoromethylsulfonyl) imide [EMIm]+[Tf2N]-.
When a colloidal solution is irradiated with visible light, the incident coherent beam is
scattered. The intensity of the transmitted light is therefore lower than that of the incident
9
2. LITERATURE
light, and scattered light can be detected in any direction around the incident beam. This
phenomenon is called pseudoabsorbance or turbidity and is described by Eq. 3:
1 I
τ = ln 0
(3)
l It
where τ is the turbidity, It is the intensity of the transmitted light, Io is the intensity of the
incident light and l is the path length. As the light absorption properties of the colloidal
solution before and after micelle formation differ, the rate of turbidity increase changes when
the surfactant concentration is increased. This method therefore appeared appropriate for
CMC determination. The intensity of the scattered light in connection with the turbidity of the
solution is influenced by the size of the scattering particles, the difference between the
refractive indices of the particles, the medium (contrast) and the interaction of the particles. In
dilute solutions, interactions between particles can be neglected, and thus the increase in
turbidity can be ascribed to the aggregation of the particles or in other words the formation of
micelles [66].
2.3.3. Cerimetric titration of AMFZ
The basis of the determination is a cerimetric redox titration method [67], during which
the nascent oxygen evolved from the reaction of Ce(IV) with water oxidizes AMFZ. The endpoint of the titration is observed by the change in colour of ferroin present as indicator.
CH3
H3C
CH3
O O
CH3
N
CH3
N
H3C
N
CH3
O
N
+ 4Ce4+ + 2H2O
-4Ce3+ - 4H+
AMFZ
N
O
N
CH3
Dioxypyramidone
The Ce(IV) ion oxidizes the water according to the following equations :
Ce4+ + H2O••
→
Ce3+ + [H2O•]+
[H2O•]+
→
HO• + H+
2 HO•
→
H2O + O••
The produced nascent oxygen (O••) oxidizes the pyrazolone ring to dioxypyramidone [68, 69].
10
3. MATERIALS AND METHODS
3. Materials and methods
3.1. Materials
The following materials were used in these studies: AMFZ (Sigma-Aldrich, St. Louis,
MO, USA), paracetamol (Ph Eur 6.0, Phoenix Pharma Zrt., Hungary, Lot. No.: 1011204),
papaverine-HCl (Molekula, Shaftesbury, UK), ASA (Ph Eur 6.0, University Pharmacy,
University of Szeged, Szeged, Hungary), MeOH (Chromasolv for HPLC, Sigma-Aldrich, St.
Louis, MO, USA), ACN (VWR, Prolabo, Fontenay-Sous-Bois, France), sodium acetate
(Reanal, Budapest, Hungary), sulfuric acid 96% (Analyticals Carlo Erba, Milano, Italy),
acetic acid 96% (VWR, Prolabo, Fontenay-sous-Bois, France), sodium hydroxide (Reanal,
Budapest, Hungary), sodium chloride (VWR, Prolabo, Leuven, Belgium), potassium
dihydrogenphosphate (Spektrum 3D, Debrecen, Hungary) and potassium hydroxide (Reanal,
Budapest, Hungary), Suppositorium antipyreticum pro parvulo FoNo VII. (Naturland Ltd.,
Hungary, Lot. No.: 1938-1112 and Parma Produkt Ltd., Hungary, Lot. No.: 1209-1106).
Throughout the experiments, HPLC grade solvents were used. The solvents and the aqueous
solutions were prepared with triple distilled water. During the spectrophotometric
measurements, MeOH (VWR, Prolabo, Fontenay-sous-Bois, France), TWEEN® 20 (SigmaAldrich, St. Louis, MO, USA) and TWEEN® 60 (Sigma-Aldrich, St. Louis, MO, USA) were
used.
The suppository bases applied were hard fat and W35TT (University Pharmacy,
University of Szeged, Szeged, Hungary).
The divided powder samples in 4.1. Part I contained approximately 17.0 mg
paracetamol, 26.0 mg ASA and 5.0 mg papaverine in a homogeneous mixture. For the stock
solution, 48.0 mg powder was weighed with analytical precision into a 50.0 ml volumetric
flask, dissolved and made up to volume with the solvent, phosphate buffer (25 mM, pH
3.43) : ACN (85:15, V/V). During the preparation, the sample was heated to 40 °C, this step
being required for the complete dissolution of ASA, which has low solubility (slightly soluble
according to Ph Eur) in water. For the working sample solution, 3.0 ml stock solution was
diluted to 10.0 ml and filtered through a 0.45 µm Millipore syringe filter before injection.
Volumetric solutions for the cerimetric titrations in 4.3. Part III were prepared with the
following materials: cerium(IV) sulfate tetrahydrate (Panreac, Barcelona, Spain), sulfuric acid
96% (Farmitalia Carlo Erba, Milano, Italy) and ferroin-solution, 1/40 M (Reanal, Budapest,
Hungary).
11
3. MATERIALS AND METHODS
Factory-made suppositories were used during the comparison of the analytical methods.
The reference product was Suppositorium antipyreticum pro parvulo FoNo VII. Naturland
(Naturland Magyarország Kft., Budapest, Hungary), which contained 150 mg AMFZ per
suppository in solid fat suppository base. One box contained six suppositories [70].
The studied samples in 4.3 Part III were prepared in regular pharmacies by a moulding
technique, according to the following prescription. Ten suppositories were prescribed with a
labelled claim of 100 mg AMFZ in each suppository. The choice of vehicle for the
suppository was left to the responsibility of the pharmacist. Practically all of the samples were
prepared with solid fat. In each case, predetermined technological errors (known to us) were
made during the manufacturing samples.
3.2. Methods
3.2.1. Preparation of reference solutions and establishment of system suitability
The API contents of the samples were quantified by reference to reference solution in
the appropriate solvent mixtures with concentrations presented in Table 2, which
corresponded to the theoretical 100% concentration level of the sample solutions to be
examined. Two reference solutions were prepared from independent stock solutions in order
to check the system suitability by the following procedure.
Table 2 Concentrations of standard APIs
Paracetamol
ASA
Papaverine
AMFZ
Paracetamol
Concentration (mg/ml)
Divided powder
0.100
0.150
0.030
Suppository
0.075
0.075
Solvent
Phosphate buffer (25 mM,
pH 3.43) : ACN (85:15, V/V)
MeOH: water (50:50, V/V)
MeOH : ACN : 50 mM
phosphate buffer (pH 6.3),
(50:5:45, V/V/V)
The precision of the injections was checked before all measurement sets by injecting the
first reference solution 5 times. The system was considered suitable if the RSD% of the 5
replicate injections did not exceed 2.0%. The accuracy of the calibration was checked by
injecting the second reference solution twice. The results were accepted if the correlation
factor (see Eq. 4) calculated from the average response ratio of the two reference solutions
was not more than 2.0.
12
3. MATERIALS AND METHODS
Correlation factor = 1 −
A Std1 ⋅ w Std2
⋅ 100 %
A Std2 ⋅ w Std1
(4)
where AStd1 and AStd2 are the average peak areas of the replicate reference injections, while
wStd1 and wStd2 are the weights of the reference substances used to prepare the solutions.
The symmetry factor of the main peak of interest was also monitored throughout the
measurements; it had to be between 0.7 and 2.0 for the analysis to be started.
3.2.2. Titrimetric analysis of suppositories with AMFZ
During the sample preparation, 1 suppository was melted over a 40 °C water bath and 3
replicate samples of 0.20-0.30 g were weighed from the molten mass into titration flasks.
10.0 ml of 15% sulfuric acid was added to each sample and the mixture was heated to 40 °C
to extract the API from the suppository base. The mixture was then cooled to room
temperature, 15 ml of distilled water was added, and after mixing and the addition of 1 drop
of ferroin indicator, titration with 0.05 M cerium(IV) sulfate volumetric solution was
performed until the colour of the solution changed from orange to green and remained green
for at least 1 min.
3.3. Instruments and other equipment
For mobile phase degassing and sample sonication a DLS 310-T DONAU-LAB-SONIC
US bath was used.
HPLC measurements were carried out on a Shimadzu Prominence UHPLC system
(Shimadzu Corp., Kyoto, Japan) equipped with an LC-20AD pump, a 4-port solenoid mixing
valve, a CTO-20A column oven, a DGU-20ASR degasser, and an SPD-M20A UV/VIS PDA
detector with a 10 mm optical path length flow cell. Samples were injected via a Rheodyne 6port manual injector valve fitted with a 20 µl sample loop. Separation was studied on a
Hypersil ODS (C18) 150x4.6 mm, 5 µm column (Thermo Scientific, Keystone, UK), a Luna
C18(2), 150x4.6 mm, 3 µm column (Phenomenex, Torrance, CA, USA) and a Zorbax SBC18 150x4.6 mm, 3.5 µm column (Agilent, Santa Clara, CA, USA) during the method
development procedure. Data acquisition and peak integration were carried out with
LCSolution (Shimadzu Corp., Kyoto, Japan) chromatographic data acquisition and processing
software. The results were evaluated with LC Solution and Microsoft Office Excel 2007
software. The log D vs. pH functions for the tested compounds were predicted with Pallas
intelligent chromatographic software [26].
13
3. MATERIALS AND METHODS
Spectrophotometric measurements were carried out on a Shimadzu UV-1601 UV/VIS
double-beam spectrophotometer. Throughout the measurements, quartz cells with 10 mm
optical path length were used. The spectrophotometric data were evaluated with Microsoft
Excel.
1
H NMR spectra were recorded on a BRUKER Avance DRX 500 spectrometer at room
temperature, with a deuterium lock. There was no water suppression during the experiment.
The carrier frequency (O1) was placed at 7.01 ppm and a 16.00 ppm wide region was detected,
the excitation was carried out with a 30° pulse (PW90=12.5 µs), the interpulse delay was set to
3 seconds, the acquisition time was 2.05 s and 8 transients were collected into 32K data points.
The spectral processing included an exponential filtering with 0.3 Hz, zero-filling to 64K data
points and a complex Fourier transformation. The data collection and data processing were
carried out with Bruker XWIN-NMR 3.1 software.
14
4. RESULTS – PART I.
4. Results
4.1. Part I. Development and validation of HPLC assays
4.1.1. Chromatographic separation problems of drugs with different polarities
Many authors have described the simultaneous determination of paracetamol and ASA
in various pharmaceutical dosage forms and also in blood or urine samples [71–81], but the
available literature on the HPLC analysis of papaverine is quite limited. Mostly, the presence
of papaverine together with opiates has been studied [82–90] and many findings are available
as concerns its identification in blood samples from opiate drug users [83, 86, 87, 89, 90]. It is
very rarely detected by means of UV/VIS photometry in chromatographic methods.
Figure 2 log D vs. pH curves of paracetamol, ASA and papaverine
4.1.1.1. Method development strategy
As the first step of chromatographic method development, the chemical properties of
the drugs, which may influence the separation, were determined. Particularly the separation of
papaverine and ASA can be difficult to achieve, in view of the specific pKa values and the
15
4. RESULTS – PART I.
log D vs. pH curves (Figure 2). The pH of the applied aqueous mobile phase was one of the
key parameters that affected the separation. The range between 2 and 8 was optimum from the
aspect of the stationary phase, but the range between 1 and 6 was not appropriate for the
separation of papaverine, which contains 1 basic nitrogen with a pKa in the upper part of the
range. The ratio of dissociated and undissociated forms of ASA changes in the pH range 3-8.
At pH > 6 (which is beneficial for papaverine separation), ASA peak splitting was observed
[26].
In light of the above findings, the most challenging task was to find the most
appropriate combination of the boundary conditions, where the overall negative influence on
the separation and elution of the analytes was least. pH 3.4 ± 0.05 was found to be a
reasonable compromise for the pH of the aqueous phase. An assay of papaverine alone was
reported in the application database of Agilent, which involved a similar pH in the aqueous
mobile phase [91]. In this method, the aqueous eluent contained 25 mM potassium
dihydrogenphosphate, but sulfuric acid was used to adjust the pH so as not to increase the
phosphate concentration.
Figure 3 Chromatograms obtained on Hypersil ODS (a), Luna C18 (b) and Zorbax SB-18 (c) columns.
Coeluting peaks are magnified in the insets
16