Performance And Environmental Accounting Of Air Biofiltration For Carbon Monoxide Removal
Bạn đang xem bản rút gọn của tài liệu. Xem và tải ngay bản đầy đủ của tài liệu tại đây (1.61 MB, 103 trang )
ABSTRACT
Title of Thesis:
PERFORMANCE AND ENVIRONMENTAL
ACCOUNTING OF AIR BIOFILTRATION
FOR CARBON MONOXIDE REMOVAL
Priti Ganeshan, MS, 2005
Thesis Directed By:
Assistant Professor, Dr. D.R. Tilley, Biological
Resources Engineering
The ability of air biofilters to remove carbon monoxide (CO), a priority pollutant
that harms human and environmental health was investigated. Environmental accounting
of biofilters was performed using emergy analysis to compare resource requirements of
biofilters to catalytic converters. Cylindrical PVC biofilters were filled with pebbles or
compost, inoculated with soil slurries and loaded with either bottled CO or engine
exhaust CO. In batch experiments, compost and pebble biofilters exhibited exponential
decrease in CO over time with compost removing 90% of 1000 ppm-bottled CO and
pebble biofilters removing 80% CO in 24 hours. In continuous flow experiments,
compost biofilter exposed to 1000 ppm-CO generated from a gasoline engine was able to
reduce CO levels (45%) at efficiency commensurate to a bottled CO source. In the range
of 500-1000 ppm-CO, biofilters used less total environmental and energy resources to
remove CO (12E9 solar emjoules) than conventional catalytic converters (40E9 solar
emjoules).
PERFORMANCE AND ENVIRONMENTAL ACCOUNTING OF AIR
BIOFILTRATION FOR CARBON MONOXIDE REMOVAL
By
Priti Ganeshan
Thesis submitted to the Faculty of the Graduate School of the
University of Maryland, College Park, in partial fulfillment
of the requirements for the degree of
Master of Science
2005
Advisory Committee:
Assistant Professor, David R. Tilley, Chair
Associate Professor, Patrick Kangas
Associate Professor, Andrew Baldwin
Acknowledgements
There are many people responsible for the successful completion of this thesis. I
cannot thank my parents enough for all their love and support and instilling the
importance of a good education in me.
Dave Tilley has been phenomenal as an advisor, guide, mentor and friend. His
support and interesting insights for my research were inspirational. His doors were
always open to all my questions and concerns. Dave Tilley is responsible for
nurturing me from an inquisitive student to an effective researcher. I would also like
to thank my committee, Drs. Andy Baldwin and Pat Kangas for their thoughtful
comments and suggestions on my research.
My work would not have been possible if not for the hardworking and
innovative team of Gary Siebel and Ali Jamshidi, who built my project and never
failed to provide the finest and smartest hardware support possible for my research.
I would also like to thank Dr. R.H. McCuen for being extremely helpful with the
statistical aspect of this thesis. He took a lot of time out of his busy schedule to guide
and advice me on statistical interpretation of my results.
I was lucky to have Pepe as a very co-operative lab-mate, who was always there
to lend a helping hand. Last but not least, I would like to thank my pals and good
friends for being there all the way.
ii
Table of Contents
Acknowledgements....................................................................................................... ii
Table of Contents......................................................................................................... iii
List of Tables ................................................................................................................ v
List of Figures .............................................................................................................. vi
Chapter 1: Introduction ................................................................................................. 1
1.1 Problem Statement .............................................................................................. 1
1.2 Current Methods for Controlling CO emissions................................................. 3
1.3 Treatment of CO using Biofilters ....................................................................... 4
1.4 Need for Systems Ecology Based Life-cycle Assessment.................................. 6
1.5 Objectives ........................................................................................................... 9
1.6 Plan of Study....................................................................................................... 9
Chapter 2: Material and Methods ............................................................................... 11
2.1 CO Biofiltration ................................................................................................ 11
2.1.1 Description of system ................................................................................ 11
2.1.2 Data Collection .......................................................................................... 14
2.1.3 Data Analysis of Biofilter Performance..................................................... 23
2.2 Environmental Accounting ............................................................................... 28
2.2.1 Emergy Methodology ................................................................................ 28
2.2.2 Laboratory Biofilter System ...................................................................... 30
2.2.3 Pilot Scale Biofilter.................................................................................... 31
2.2.4 Catalytic Converter .................................................................................... 31
2.2.5 Modeled Performance of Catalytic Converter at Lower CO levels ........... 32
Chapter 3: Results ....................................................................................................... 34
3.1 Performance of Biofilters for CO Removal ...................................................... 34
3.1.1 CO Removal Performance of Biofilters under Batch Loading.................. 34
3.1.3 Continuous Loading of Biofilters with Bottled CO................................... 42
3.1.3 Exhaust CO Removal by Biofilters under Continuous Loading................ 45
3.1.4 Effect of Chlorination ................................................................................ 62
3.2 Emergy Analysis............................................................................................... 63
3.2.1 Emergy Evaluation of Lab-scale System................................................... 64
3.2.2 Emergy Evaluation of Pilot-Scale Biofiltration System ............................ 66
3.2.3 Emergy Evaluation of Catalytic Converter System ................................... 67
3.2.4 Modeled Performance of Catalytic Converter at Lowered CO
Concentration...................................................................................................... 69
Chapter 4: Discussions and Conclusions .................................................................... 71
4.1 Biofiltration of CO............................................................................................ 71
4.1.1 Elimination Capacity of Biofilters ............................................................. 71
4.1.2 Effect of Media, Inoculation, Loading and Chlorination on CO Removal 72
4.2 Emergy Comparison of CO-Control Technologies .......................................... 77
4.3 Summary of Conclusions.................................................................................. 78
4.4 Applications and Future work........................................................................... 80
Appendices.................................................................................................................. 82
iii
Appendix A: Carbon Monoxide Budget for Catalytic Converter........................... 82
Appendix B: Taylor Series Calculations for Biofilter Batch Flow model.............. 84
Appendix C: Footnotes to Tables 3.9, 3.10, and 3.11............................................. 86
Bibliography ............................................................................................................... 92
iv
List of Tables
Table 1.1 Preview of experiments .............................................................................. 10
Table 2.1: Timeline of batch/bottle experiment (hours of exposure) ......................... 19
Table 2.2: Template for identifying and quantifying resource inputs and outputs in an
Emergy Analysis......................................................................................................... 30
Table 3.1: Removal efficiencies of compost and pebble media under batch flow
conditions.................................................................................................................... 35
Table 3.2: 1st order rate constant of CO uptake for compost and pebble media under
batch flow conditions.................................................................................................. 36
Table 3.3: Model Parameters for CO Batch Flow ...................................................... 37
Table 3.4: CO steady state dynamics through 78 day run .......................................... 44
Table 3.5: Improvement in CO removal ..................................................................... 45
Table 3.6: Mean daily CO removal efficiencies (%) for compost and pebble media,
loaded with engine exhausts ....................................................................................... 59
Table 3.7: Three-way ANOVA on the CO mass removed by compost and pebble
biofilters loaded with CO exhaust at 700 and 1000 ppm-CO..................................... 61
Table 3.8: Mean CO mass removal (mg h-1) by the biofilters under different factors.
..................................................................................................................................... 62
Table 3.9: Emergy evaluation of lab-scale compost biofilter treating carbon monoxide
(10 year lifetime)......................................................................................................... 65
Table 3.10: Emergy evaluation of pilot scale compost biofilter treating CO (10 year
lifetime)....................................................................................................................... 66
Table 3.11: Emergy evaluation of catalytic converter (10 year lifetime). ................ 68
Table 3.12: Summary of Emergy Analysis for Different CO Removal Technologies.
..................................................................................................................................... 68
Table 3.13: Summary of Emergy requirements of different CO control technologies70
Table 4.1 Recent biofiltration research advances in removal of organic and inorganic
compounds .................................................................................................................. 71
v
List of Figures
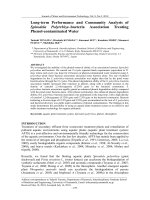
Figure 2.1: Biofilter setup in the laboratory................................................................ 12
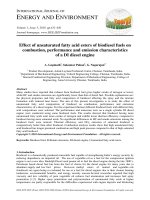
Figure 2.2: Biofilter Flow Diagram ........................................................................... 13
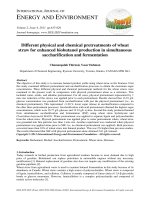
Figure 2.4: Top view schematic of the continuous/bottle experimental setup ........... 20
Figure 2.5: Top view schematic of the continuous/engine experimental setup.......... 21
Figure 3.1: Comparative performance of the compost and pebble biofilter at different
exposure times with the standard error for each. ........................................................ 35
Figure 3.2: (a) Model calibration of batch/bottle CO experiment on compost #2 and
#4 showing measured versus predicted removal efficiencies and (b) Validation of
compost #2 and #4 models on data from compost #6................................................. 38
Figure 3.3: (a) Model calibration of batch/bottle CO experiment on pebble #1 and #3
showing measured versus predicted removal efficiencies and (b) Validation of pebble
#1 and #3 models on data from pebble #5. ................................................................. 39
Figure 3.4: Comparison of modeled performance of the compost and pebble media as
a function of increasing exposure time under a constant maturity time of 1 day. ...... 40
Figure 3.5: Comparison of modeled performance of the compost and pebble media as
a function of increasing maturity time under a constant exposure time of 8 hours. ... 41
Figure 3.6: CO steady state outlet concentration from biofilter #6 through the 78 day
experiment................................................................................................................... 42
Figure 3.7: CO removal efficiency of compost biofilter # 6 after various treatments of
inoculation and idleness.............................................................................................. 43
Figure 3.8: CO mass removal after each inoculation and idle period......................... 45
Figure 3.9: Inlet and outlet CO concentration for the a) compost biofilter CM2 (on
7/10/2003) and b) pebble biofilter PM3 (on 7/11/2003) receiving engine exhausts
targeted at 1000 ppm-CO, before inoculation............................................................. 48
Figure 3.10: Inlet and outlet CO concentration for the a) compost biofilter CM2 (on
7/29/2003) and b) pebble biofilter PM3 (on 7/28/2003) receiving engine exhausts
targeted at 1000 ppm-CO, before inoculation............................................................. 49
Figure 3.11: Inlet and outlet CO concentration for the a) compost biofilter CM2 (on
8/1/03) and b) pebble biofilter PM3 (on 8/4/03) receiving engine exhausts targeted
1000 ppm-CO, after inoculation. ................................................................................ 50
vi
Figure 3.12: Inlet and outlet CO concentration for the a) compost biofilter CM2 (on
8/14/03) and b) pebble biofilter PM3 (8/13/03) receiving engine exhausts targeted at
1000 ppm-CO, after inoculation. ................................................................................ 51
Figure 3.13: Mean daily input and output CO concentration of (a) Compost CM2 and
(b) Pebble PM3 before and after inoculation when continuously fed engine exhaust
@1000 ppm CO. ......................................................................................................... 52
Figure 3.14: Inlet and outlet CO concentration for the a) compost biofilter CM4 (on
7/14/03) and b) pebble biofilter PM1 (on 7/9/03) receiving engine exhausts targeted at
700 ppm-CO, before inoculation. ............................................................................... 54
Figure 3.15: Inlet and outlet CO concentration for the a) compost biofilter CM4 (on
7/24/03) and b) pebble biofilter PM1 (on 7/23/04) receiving engine exhausts targeted
at 700 ppm-CO, before inoculation. ........................................................................... 55
Figure 3.16: Inlet and outlet CO concentration for the a) compost biofilter CM4 (on
8/6/03) and b) pebble biofilter PM1 (on 8/7/03) receiving engine exhausts targeted at
700 ppm-CO, after inoculation. .................................................................................. 56
Figure 3.17: Inlet and outlet CO concentration for the a) compost biofilter CM4 (on
8/19/03) and b) pebble biofilter PM1 (on 8/18/03) receiving engine exhausts targeted
at 700 ppm-CO, after inoculation. .............................................................................. 57
Figure 3.20: CO mass uptake by the compost (#4) and pebble (#1) filters for each
run, from engine exhaust targeted at 700 ppm-CO..................................................... 60
Figure 3.21: Outlet CO concentration from compost biofilter # 6, continuously loaded
with bottled CO at 100 ppm, before and after chlorination. ....................................... 63
Figure 3.22: Emergy systems diagram for a compost biofilter setup. ....................... 64
Figure 3.23: Energy systems diagram for the catalytic converter. ............................ 64
Figure 3.22: Solar emergy required by each of three treatment technologies to
remove CO from a waste air stream as a function of inlet CO concentration. ........... 70
vii
Chapter 1: Introduction
1.1 Problem Statement
Carbon monoxide (CO) is a colorless, odorless, poisonous and tasteless gas that
affects human health and the environment. CO is a byproduct of incomplete burning
of any Carbon-based compound (OSHA, 2002). CO is easily absorbed into the
bloodstream, where it combines with hemoglobin and forms Carboxyhemoglobin
(COHb) (Raub et al, 1999). The presence of this compound in the blood reduces the
oxygen carrying capacity to the body’s organs and tissues (USEPA, 1995a). At low
concentrations, CO can cause fatigue in healthy people and chest pain in people with
heart disease (USEPA, 1995b). At higher contamination levels (COHb > 10%), it
results in neurological symptoms like impaired vision and coordination, headaches,
dizziness, confusion and nausea. (Raub et al, 2000). With extreme exposure, coma,
convulsions and cardiopulmonary arrest may occur. CO exposure causes flu-like
symptoms that clear up after leaving the contaminated area. (USEPA, 1995c). CO
indoors contributes to bad indoor air quality, and is one of the causes of the “Sick
Building Syndrome”, where the occupants of a certain affected building repeatedly
describe a complex range of vague and often subjective health complaints (Jones,
1999).
CO released to the atmosphere readily combines with and removes the OH −
radical present in the atmosphere through OH − + CO → H + + CO2 . The reaction with
OH − is a large sink for CO as it removes more than 80% of CO. The OH − radical is
1
referred to as the “tropospheric vacuum cleaner” (Graedel, 1978) as it acts as a sink
for hundreds of gases and reduces pollutant buildup (Thompson, 1992). Thus OH − is
the main oxidant in the atmosphere and its distribution determines the chemical sink
of many trace constituents, including several greenhouse gases such as methane and
ozone. (Moxley and Cape, 1996; Granier et al, 2000;). Thus CO released to the
atmosphere, indirectly increases levels of O3 and other volatile organic compounds by
removing OH − radical, which is the main atmospheric sink of the OH − radical
(Seiler, 1978; Zimmerman et al, 1978; Moxley and Smith, 1998; Granier et al, 2000).
Hence CO, though radiatively unimportant, becomes a critical component in
atmospheric chemistry because of the large effect it has on the hydroxyl radical
(Conny, 1998). An increased tropospheric CO contributes to ground level Ozone
levels (Watson et al, 1990). For each CO molecule reacting with OH − , one molecule
of O3 could be formed (Logan et al, 1981). The indirect greenhouse warming effect
due to increased CO levels is equivalent to the direct effects of increasing nitrous
oxide (Daniel and Solomon, 1998). Thus CO, owing to its reactivity with OH − is a
critical component of atmospheric chemical systems and directly and indirectly
affects numerous trace gases (Guthrie, 1989, Logan et al, 1981). Therefore CO levels
play a key role in atmospheric chemistry and climate.
CO global emissions amount to about 2500 Tg year-1 (Logan et al, 1981). CO
presence in the outdoor environment is mainly due to incomplete and inefficient
combustion of fossil fuels in automobiles and largely untreated industrial emissions
(800-2000 Tg year-1). CO is produced by photochemical oxidation of methane (4001000 Tg year-1) and Non-Methane Hydrocarbons (NMHC) (300-1200 Tg year-1).
2
Emissions from vegetation (50-130 Tg year-1) and photodecomposition of organic
matter in surface waters (such as oceans, rivers, and lakes) and soil surface (20-80 Tg
year-1) also contribute to global CO levels (Conrad, 1988, Logan et al, 1981). The
main industrial producers of CO are ferrous and non ferrous metal processing
industries, petroleum refineries and chemical industries.
CO is also a significant cause of indoor air pollution as well. Bad indoor air
quality can lead to the “Sick Building Syndrome”, where in the occupants experience
discomforts like headache, dizziness, lethargy, which disappear on leaving the
building. CO indoors can be attributed to gas cooking ranges, gas space heaters,
Kerosene space heaters, environmental tobacco smoke, fireplaces and woodstoves.
Operating vehicles in an attached, enclosed garage could also produce dangerous
levels of CO indoors.
1.2 Current Methods for Controlling CO emissions
CO from automobile emissions is one major source of CO pollution. Therefore,
the automotive catalytic converter is one of the most important means of controlling
CO. The catalytic converter uses rare metals as catalysts to reduce nitric oxide (NO)
to nitrogen gas and oxidize CO + hydrocarbons to CO2 & water (Keith et al. 1969).
This technique requires rare metals such as platinum, palladium or rhodium obtained
from large-scale mining that consumes energy, degrades ecosystems and causes other
indirect environmental impacts. Though efficiency of catalytic converters has been
proved, it may not be sustainable and may cause other major environmental concerns.
The average life of a catalytic converter is about 80000 miles, much less than the
3
expected life of a vehicle so older vehicles contribute to a higher proportion of
atmospheric CO. Catalytic converters for automotive traction raise some concern for
human health and the environment, due to the release of Pd, Pt and Rh (PlatinumGroup Metals, PGMs). In fact, the thermal and mechanical conditions under which
such devices work (including abrasion effects and hot-temperature chemical reactions
with oil fumes) can cause significant release of the PGMs to the environment and
eventually affect human health (Caroli et al, 2001).
1.3 Treatment of CO using Biofilters
Biological treatment methods use microbial metabolic activities to convert
pollutants into harmless byproducts, like water, carbon dioxide and biomass.
Microbial populations interact with a number of species symbiotically and bring
about reduction in contaminant levels. Essentially the pollutants are broken down and
used by microbes for metabolism. Therefore, bio-treatment seems to be a viable
treatment process for biodegradable compounds with simple bond structures that are
easily broken by microbes. With a favorable environment for microbial interactions,
biological treatment processes can be a cost-effective and efficient method to degrade
pollutants.
Microbial treatments have been used to treat solid waste since early twentieth
century, but have been used to treat waste gases only since the fifties. The earliest
biological treatments were soil beds that treated sewer gases (Carlson and Leiser,
1966) and the process was called biofiltration. Since then a variety of different media
like wood chips, compost, activated carbon have been used to improve biofiltration
4
efficiency, clogging and head loss. Thus biofiltration uses active microbial
communities immobilized on a wet and nutritious porous medium to degrade a
variety of pollutants in a gaseous stream. Air biofilters work by creating a nutritional
environment amenable to microbial transformations of waste elements and
compounds.
Soil bed reactors and microbial air reactors have been demonstrated effective at
reducing many organic and inorganic compounds in laboratory and commercial
applications. Biofilters have been shown to remove contaminants like Diethyl ether
(Yang et al, 2002), BTEX (Martinez and Tamara, 2002) and hydrogen sulfide (Jones
et al, 2002). Soil bed reactors were found capable of removing odors of waste
treatment plants (Carlson and Leiser, 1966). Smith et al (1973) demonstrated
absorption capacities of sulfur dioxide, hydrogen sulfide, methyl mercapatan, and
small amounts of ethylene, acetylene and carbon monoxide.
Though biofiltration for air quality management has been under investigation
for several decades (DeVinney 1999), it has been only commercialized to a
significant level in the last decade (Boswell et al, 2002). Biofiltration technology has
become quite popular in industries to treat volatile organic compounds (VOC), odors
and petroleum hydrocarbons. Additional, similar kinds of pollutants are also being
noticed in the indoor environment at alarming levels (Jones, 1999; Wood et al, 2002).
Potentially harmful air pollutants may accumulate in enclosed, human occupied
systems. VOC’s originate indoors from sources like building furnishings, adhesives
and cleaning agents (Sheldon et al, 1988). Biological treatment processes have found
applications in such indoor environments. B.C. Wolverton’s (1990) study showed that
5
foliage plant system (leaves, potting soil and microbes attached to roots) greatly
improves indoor air quality.
Carbon monoxide manifests itself as a formidable outdoor and indoor pollutant.
So the development of biofilters to treat CO will have multiple applications. Soil
microbes are the second largest sink for CO (Bartholomew and Alexander, 1981;
Moxley and Smith, 1998). There are many reports of microorganisms capable of
utilizing CO (Nozhevnikova and Yurganov, 1977) and include fungi (Inman and
Ingersoll, 1971), algae (Chappelle, 1962), actinomycetes (Bartholomew and
Alexander, 1979), carboxydobacteria (Zavarzin and Nozhevnikova, 1977), and CO
oxidizing nitrifying bacteria (Conrad, 1996). Also some studies have shown that soil
bed reactors (Frye et al, 1992) and foliage plants (Wolverton, 1990) were able to
completely and rapidly remove low concentrations (120-130ppm)of CO.
Although biofilters may be proven to eliminate CO emissions or reduce levels,
there remains a question as to how environmentally friendly biofilters are compared
to other CO control technologies, namely catalytic converters.
1.4 Need for Systems Ecology Based Life-cycle Assessment
The earth and her resources are been continuously diminished on the pretext of
increasing economic development. Nature’s services are considered free and
inexhaustible, with value added only to human services. The concept of industrial
ecology has now become important to demonstrate the fact that human economic
development and nature have to be balanced. Industrial ecology has been defined by
Graedel and Allenby (1995) as “the means by which humanity can deliberately and
6
rationally approach and maintain a desirable carrying capacity, given continued
economic cultural and technological evolution”. The principles of industrial ecology
focus on making material/product cycles more efficient and designing for the
environment (Tilley, 2003). It also advocates ‘cradle to cradle’ design approach rather
than conventional ‘cradle to grave’ practice.
The life cycle thinking espoused by industrial ecology requires that industries
take a lifecycle approach towards subsystems and processes that are a part of its
supply chains and sub-chains. It has become imperative to use a life cycle assessment
that would incorporate the actual economic gain and environmental impacts of any
process or material. Design, manufacturing & operation of environmental pollution
control technologies should follow principles of industrial ecology ensuring that the
energy and material resources consumed and waste generated are minimized over its
entire cycle.
Thus a pollution technology, which very effectively reduces the target
contaminant but, indirectly causes a different environmental burden, has to be
analyzed for net environmental gain. Therefore, from a systems perspective
environmental pollution control strategies should not only ensure that the targeted
pollutant is reduced but also that indirect environmental impacts are not created in the
process of manufacturing and operating technologies. Integrated system analysis tools
should be applied to evaluate environmental technologies to determine their true
environmental benefit. Holistic evaluation of integrated ecological-industrial systems
requires a methodology that includes systems ecology. The methodology should
7
realize all the ecological, environmental, social and economic benefits and costs
associated with environmental control technologies.
One such system analysis approach is using Emergy Evaluation, which is a
scientific method for performing environmental accounting that directly compares
environmental and economic inputs on a common basis. Emergy (spelled with an
“m”) measures both the work of nature and humans in generating a product or service
(Odum, 1996). Emergy can be defined as a measure of the total energy of one kind
that has already been used in energy transformations directly or indirectly to make a
product or service. Different types of energy are compared using the transformity
which is defined as emergy per unit available energy. Emergy is a record of energy
used and has been called “energy memory”. For example, a piece of charcoal has a
certain amount of available (potential) energy that is released when it is burnt. It
required an even higher amount of energy to make it through many natural processes.
Emergy thus makes a distinction between available energy and previously-used
available energy that makes it a very powerful tool in system evaluation.
An emergy analysis can be used in any kind of system evaluation especially in
environmental systems as it can compare input energies with actual environmental
benefit. For example, if we compare two methodologies to treat storm water runoff, a
constructed wetland and a heavily engineered filter system, we may find that both
may be equally capable to reducing pollutant loads. However the constructed wetland
may also add a whole ecosystem, with its complex interactions, giving more value to
the technology. An emergy evaluation can consider indirect benefits like these, which
give more meaning to an impact assessment study.
8
1.5 Objectives
My research goals were to quantify the capacity of biofilters to remove CO from
air streams and to evaluate the environmental sustainability of biofilters that remove
CO. Specifically my study:
1.
Determined the CO elimination capacity of biofilters.
2.
Determined the effect of media, inoculation, loading and chlorination on
removal rate and efficiency.
3.
Determined the CO removal efficiency of a biofilter loaded with exhaust
from a gasoline powered engine.
4.
Compared the environmental sustainability of the biofilter system and
compared it to a traditional technology of CO removal.
1.6 Plan of Study
Table 1.1 summarizes the experiments conducted. To determine the CO
elimination capacity of biofilters (objective #1), I loaded six bench-scale biofilters
with CO and measured the inlet and outlet concentration.
Objective # 2 was achieved by measuring the performance of two different
media, compost and pebbles, inoculating the biofilters with slurries made from local
soils, loading the biofilters with bottled CO at either 100 ppm or 1000 ppm and
dosing a biofilter with hypochlorite.
9
Table 1.1 Preview of experiments
Objective Experiment
#
1, 2
Batch/Bottle
Fill-wait-read outlet CO.
Source: Bottled CO
Data Collected
Analysis
Record start + end
CO concentrations.
t-test
Non linear least squares
model
Univariate ANOVA
1, 2
Continuous/Bottle
Continuously supply COContinuously read outlet.
Source: Bottled CO
Record outlet CO
concentrations.
Time series
2, 3
Continuous/Engine
Continuously supply Engine
exhaust Read inlet and
outlet.
Source: Engine exhaust CO
Record inlet CO
concentrations at
intervals and outlet
CO at all other times.
Time series
Univariate ANOVA
2
Continuous/Bottle with
chlorination
Continuously supply COChlorinate media- Observe
effects of chlorination on
removal.
Record outlet CO
concentrations
Time series
4
Environmental Accounting
Compare lab-scale and pilotscale biofilter to traditional
catalytic converter
technology
Calculate
environment and
economic resource
inputs and CO
removed
Emergy evaluation
To meet objective # 3, I fed 4 biofilters 700 ppm or 1000 ppm CO generated in
the exhaust of an internal combustion engine.
Objective # 4 involved performing emergy evaluation of the lab-scale biofilter,
a modeled pilot-scale biofilter operating under industrial conditions and a traditional
automotive catalytic converter.
10
Chapter 2: Material and Methods
This chapter is divided into two main topics: Section 2.1 describes the biofilter lab
experiments. Section 2.2 describes the emergy evaluation method used to perform the
environmental accounting of the biofiltration technologies.
2.1 CO Biofiltration
2.1.1 Description of system
Previously used designs for bench scale biofilter units (Jones et al, 2002) were
built in the University of Maryland Biological Resources Engineering (UMBRE)
Project Development Center (College Park, MD). Six cylindrical biofilters, 15 cm in
diameter and 1 m in height were constructed of clear PVC (Figure 2.1). Each biofilter
had a bottom port and two top ports for sampling CO. Lids with fitted clamps and
rubber sealers were provided to close both ends of each biofilter. A thin plastic grid
was placed in each biofilter at a height of 15 cm from the bottom of the PVC pipe, to
support biofilter media and allow for drainage. The bottom lid was also fitted with a
port for leachate drainage and collection. A safety valve was also fitted on the bottom
lid. Non-reactive and non-absorbing Tygon® tubing (US Plastic Corp., Lima, OH)
was used for all gas transport. The six biofilters were mounted upright on a steel and
wooden frame, built at the UM BRE Project Development Center.
11
Cylindrical
Biofilters
Figure 2.1: Biofilter setup in the laboratory
Three PVC cylinders were filled with inert, hardened baked clay “pebbles”
(Grorox®, Home Harvest® Garden Supply Inc., Baltimore, MD) with diameters of 816 mm. The three pebble biofilters were designated #’s 1, 3 and 5. The remaining
three PVC cylinders were filled with poultry litter compost generated at the
composting facility at the University of Maryland’s Lower Eastern Shore Research
and Education Center (Poplar Hill, MD). The three compost biofilters were
designated #’s 2, 4 and 6. The biofilters were irrigated with de-chlorinated water to
12
maintain a moist environment. The biofilters were inoculated with slurries made from
soils located on the University of Maryland campus (College Park, MD). Soil
innoculum was made by collecting cylindrical soil cores (5 x 5 cm) from forests and
wetland sites. The soil was sieved (ASTM sieve No.40) and mixed with one liter of
dechlorinated water to form slurry. Nutrient additions in the form of 20 ml of 0-5-4
solution (N-P-K solution, Flora Bloom ®, General Hydroponics®,
Moisture
addition
Vacuum Pump
1/3 HP
CO Analyzer
(NDIR)
Media:
Compost or
Pebbles
Flow
1m
3 HP Motor
Exhaust
Plastic grid
Bottled CO
CO
Flow-meter
Drain
15 cm
Figure 2.2: Biofilter Flow Diagram
Sebastopol, CA) and 20 ml of 5-0-1 solution (N-P-K solution, Flora Micro®,
General Hydroponics®, Sebastopol, CA) were added to the soil slurry. This soil
innoculum was added to the compost and pebble biofilters through the top lid.
13
CO contaminated air was pulled through the units from the bottom and
measured for reduction in CO concentration upon exit from the top of the PVC
cylinders. Two sources of CO were used to test the biofilters. One was bottled CO
(Airgas East, Salem, NH) at a known concentration mixed with air. The other CO
source was a gasoline engine exhaust containing CO mixed with other combustion
products. CO-containing exhaust was generated by a 2,620 W (3.5 HP) four-stroke
gasoline engine (Briggs and Stratton, Corp., USA). A 250 W (1/3 HP) vacuum pump
(High Vacuum Pump, Model: E2M 2, Franklin Electric, Bluffton, IN), attached to
one of the top ports of each biofilter, pulled exhaust gas containing CO through the
biofilter media from the bottom (Figure 2.1).
CO concentrations were measured with a Non-Dispersive Infrared (NDIR) gas
InletThe
CO
analyzer (Model 200, California Analytical Instruments (CAI), Orange, CA).
to
outlet readings from the gas analyzer were continuously logged using a databottom
logger
port of
(HOBO® Outdoor 4-Channel data logger, Onset Computers, Cape Cod, MA).
BF Gas
flow rates were measured and controlled with stainless-steel flow meters (Gilmont
Inc., Barrington, IL) at the biofilter inlet.
2.1.2 Data Collection
CO elimination capacities of the biofilters were studied under two different flow
conditions: batch flow and continuous flow conditions.
Batch/Bottle: Figure 2.3 shows a top view of the biofilter experimental setup
for the batch flow experiments. In the batch experiments, bottled CO at 1000 ppm
was pumped into the biofilter until CO concentration at the top port reached steady
state value of close to 1000ppm-CO. This was the Start concentration. The biofilter
14
ports were then closed. All six biofilters were exposed to the CO for the same
prescribed period, at the end of which End concentrations were sampled from the top
port.
Manifold
Outlet CO
from top of
BF to
analyzer
BF6
BF1
BF5
BF2
BF4
BF3
Manifold
Gas Analyzer
Bottled CO
Figure 2.3: Top view schematic of the batch/bottle experimental setup
The Start and End CO concentrations displayed by the NDIR CO analyzer were noted
and recorded manually in a laboratory notebook. Batch experiments were carried out
on the six biofilters for 60 days, with the all the biofilters being exposed to the same
prescribed number of hours on any day. The biofilters were exposed to anywhere
between 2 to 90 hours before End concentrations were sampled. Table 2.1 shows a
timeline of the batch experiments with biofilter exposure time.
In the continuous flow experiments the pollutant CO air stream was
continuously passed through the biofilter. Real time outlet CO concentrations from
the analyzer were logged using the data logger. These continuous flow studies were
carried out using bottled CO and CO engine exhaust as the input CO pollutant stream.
15
Table 2.1: Timeline of batch/bottle experiment (hours of exposure)
Compost
Pebble
Day1
5.25
0
Day1.5
17.75
0
Day2
4.25
0
Day2.5
18
0
Day3
3
0
Day3.5
67
0
Day4
0
0
Day5
0
0
Day7
5
0
Day7.5
17
0
Day8
0
0
Compost
Pebble
Day10
21.25
21.25
Day11
94
94
Day12
0
0
Day13
0
0
Day14
0
0
Day15
22.5
22.5
Day16
6.25
6.25
Day17 Day18 Day19
25.5
0
0
25.5
0
0
Day20
0
0
Day21 Day22
0
0
0
0
Day23
0
Compost
0
Pebble
Day24
0
0
Day25
0
0
Day26
0
0
Day27
0
0
Day28
2.5
2.5
Day28.5 Day29 Day30 Day31
20
2.5
0
19
20
2.5
0
19
Day32
68
68
Day33 Day34
0
0
0
0
Day35
6
Compost
6
Pebble
Day36
4.5
4.5
Day36.5
16
16
Day37
8
8
Day38
0
0
Day39
0
0
Day40
0
0
Day41 Day42 Day43
0
0
0
0
0
0
Day44
4.5
4.5
Day45 Day46
4.5
4
4.5
4
Day47
0
0
Day48
0
0
Day49
4.5
4.5
Day50
0
0
Day51
0
0
Day52
0
0
Day53
0
0
Day54 Day55 Day56
5
5.5
7
5
5.5
7
Day57
4
4
Day58 Day59
5
4
5
4
Compost
Pebble
Day60
7.5
Compost
7.5
Pebble
19
Day6
0
0
Day9
23.75
23.75
Continuous/Bottle: Figure 2.4 shows the experimental setup for the
continuous/bottle experiments. Bottled CO containing 1008 ppm CO mixed with air
was pulled through the compost biofilter (#6) by the vacuum pump for 6 hours during
any run.
Outlet CO from
top of BF to
analyzer
Manifold
BF6
Inlet CO to
bottom of BF6
Vacuum Pump
Manifold
Gas Analyzer
Data-logger
Bottled CO
Figure 2.4: Top view schematic of the continuous/bottle experimental setup
CO flow through the biofilter and the vacuum pump was maintained and
controlled at 0.5 liters per minute (l/min). The outlet CO concentration from the top
port of biofilter #6, read by the CO analyzer was logged every 2 seconds using the
HOBO data-logger. The steady state CO concentration at the outlet was noted at the
end of each run. The biofilter was run for 78 days, was inoculated with soil slurries on
some days and left idle (not run) on other days. The effects of these treatments on the
dynamics of the biofilter outlet concentration were studied over time. The biofilter
was inoculated with one liter soil and nutrient slurries on Day 5 and Day 25. The
compost biofilter was also put on “idle” from Day 35 to Day 70, after which it was
run as previously to study the effect of idling on the natural biofilter mechanism.
20