Review Article (RA) Comparison of the Product Life Cycle Cost System with the Traditional Cost System...Serdar KUZU
Bạn đang xem bản rút gọn của tài liệu. Xem và tải ngay bản đầy đủ của tài liệu tại đây (272.26 KB, 24 trang )
Review
International Journal of Basic and Clinical Studies (IJBCS)
2012;1(1): 20-38. Kuzu S
Comparison of the Product Life Cycle Cost System with the Traditional Cost System
and its Application on a Pharmaceutical Company
Serdar KUZU*
*
Social Sciences Vocational High School, Research Assistant, Istanbul University
Abstract
The developments in information technologies in the world have led to developments
in the technologies used in production. Labor-intensive production technology has been
replaced by computer-controlled production. Enterprises are carrying out their production and
sales activities in a fierce competition environment and as a result of consumers’ demand of
quality and reliable products and quick distribution channels from production enterprises,
enterprises have started to concentrate on their products by striving for high quality low cost,
automation, flexible production and use of technology and information. The heavy increase in
the technological change both in the global pharmaceutical industry and in other sectors has
dramatically shortened the life cycles of products and means of production. Moreover, the
increasing competition has also shortened the life cycles of products, reduced the prices of
products and compelled enterprises to revise new products. Thus the product life cycle cost
approach has come into prominence which focuses on the management of the costs and costeffectiveness throughout the life-cycle that starts with the pre-production of products and
services and continues until the disposal of the products and recalling of the products from the
market. The aim of this study is to put forth the function and importance of the product life
cycle cost method, which has emerged as a method that makes up the deficiencies of the
traditional cost accounting, within the scope of cost management and to underline the benefits
of the said method for firms, especially with respect to cost saving. The differences between
the two methods were discussed by means of the application of the product life cycle cost
method on a pharmaceutical firm.
Jel Code: M41
Key Words: Life Cycle Costing, Product Life Cycle Management, Product Life Cycle
Process, Kaizen Costing, Target Costing, Pharmaceutical Company
20
Review
International Journal of Basic and Clinical Studies (IJBCS)
2012;1(1): 20-38. Kuzu S
Introduction
The concept of Product Life Cycle Cost (PLCC) was first used in in the mid-1960s as an
auxiliary means to be used by the United States Department of Defense in the main defense
tenders. In 1976 a project entitled “Life cycle budgeting and costing as an aid in decision
making” was initiated by the United States Department of Health, Education and Welfare (1).
The adoption of life cycle thinking has been very slow in the other industries (2). Public
sector has also been a relevant promoter for life cycle cost calculations (3).
Later on this situation was changed with the adoption of the first chapter of the ISO 14040, a
part of the international environmental protection standard. The philosophy of product life
cycle includes the following issues (4):
Life cycle valuation
Life cycle management
Life cycle costing
Ecodesign.
Literature Review
In literature, about PLCC method, various academic studies has been done by diffrerent
branch of sciences. The summary of these studies are given below; Dhillon study about
twentythree different types of life cycle cost models. Some of the PLCC models are general
and some of them are specific life cycle cost models. The models which are considered as
general category are not very general. This is because of some of them consider major cost
elements and some of them are based on some assumptions. In conclusion, some of these
models are product specific and the other models are general to some extent. Generally, these
models are imperfect because they don’t have a wide life cycle perspective. (5) PLCC method
is used to asist on decision making by the %66 of the companies in a Swedish building
industry Study and the some analysis method is used by %40 of city administrations in a U.S
Study to assess their building projects. (6-7) Hwang and Bae developed a performance model
which they use to manufacture manufacturing facility design considering systems
configuration, RAM system and the design life cycle cost. The life cycle cost model considers
acquisition cost, maintenance cost, breakdown repair cost and logistic support cost. (8) PLCC
Model has been used only 5 % of large industrial companies in a Finnish Study by Hyvönen.
21
Review
International Journal of Basic and Clinical Studies (IJBCS)
2012;1(1): 20-38. Kuzu S
(9) Sandberg and Boart performed PLCC model for the conceptual development of the
hardware part of functional (total care) products. The discussed design support model can be
used to assess life cycle cost and create a view of how decisions between a number of design,
performance, and manufacturing and maintenance activities affect each other in conceptual
design. (10)
Enparantza and Revilla studied about a life cycle cost calculation and management system for
machine tools. The PLCC model considers acquisition cost, operation cost, maintenance cost
and turnover/scrap cost. (11) Carpentieri and Papariello performed a PLCC calculation model
for automotive production line. The model has two supporting databases which are,
preventive maintenance and corrective maintenance database. (12) PLCC calculation is used
Aye et al. for analyse a range of property and construction options for a building. (13) Davis
and Jones performed draft to document and analyze PLCC for documenting and analyzing
PLCC using a simple network based representation. The casual factors that lead to costs and
the effect of each technology factor are identifies the and analyses the total cost implications
to introduce a technology factor are analysed by the PLCC-NET model. (14) To quantify
disposal costs, Study of Abraham and Dickinson’s the disposal of a building in which Product
Life Cycle Cost calculation is used. (15)
Widiyanto and Kato studied about forecasting the cost and performance of coal fired power
plant with and without pollution control by PLCC model. (16) Sterner developed a model to
uses PLCC methodology to calculate the total energy costs of buildings. (17) Hajj and Aouad
performed a draft of the PLCC model with object oriented and VR technologies for a building
which calculates the PLCC at two different levels. (18) The results of Safety, Maintainability,
Availability and Reliability in Design İis performed Baaren and Smit model development
phase. Their Model incorporates reliability, availability, maintainability, supportability and
PLCC aspects in the design and development process of large scale complex technical
systems. (19) PLCC Analysis of photovoltaic water pumping system is also performed in
Foster and Hanley’s study. (20)
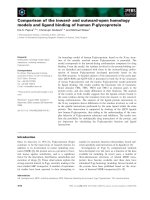
Asiedu and Gu presented a state of the art review of product life cycle cost analysis models
until 1997. The cost estimation models are divided into three groups which are analogous,
22
Review
International Journal of Basic and Clinical Studies (IJBCS)
2012;1(1): 20-38. Kuzu S
parametric and detailed. In conclusion the reviewed models are restricted to simple operations
or one phase of life cycle often the design and manufacturing stage. This gives us the
necessity about opinion to develop models which include more parts of the product life cycle
methods. (21) An analytic method to estimating reliability and life cycle cost of process safety
system is presented by Bodsberg and Hokstad study. (22)
1. Definitions of the Product Life Cycle Cost System
The product life cycle cost is expressed as the total cost that include the planning, design,
acquisition and maintenance costs that occur during the entire product life cycle and other
costs that are directly related to the product and incurred in order to acquire or use the product
(23). In other words the product life cycle cost method defines and measures all costs that
occur throughout the economic life of physical assets and targets the optimization of the cost
of the ownership and acquisition with the present value method (24).
The product life cycle is a process where (25);
the life of the product is limited,
different marketing, production and financing functions are needed in each phase
of the product life,
the product, cost and profit performance of an enterprise are presented as a means
of managerial control.
2. Phases of the Product Life Cycle Cost System
The product life curve begins with the introduction of the new product to the market. The
product “dies” if the potential of the product in the market is destroyed due to technological
deficiency or improper strategies followed in the environment of uncertainty. The product life
curve defines the phases of a new product in the market. These phases are introduction,
growth, maturity and abandonment and different product, price, distribution and promotion
efforts are deployed in each phase. Product planning is the first step to building the life curve
system.
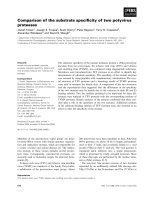
As can be seen in the Figure 1 below, introduction phase is the phase where the product meets
the target market. In this phase sales increase is slow and the profit rate is low. The unit costs
are high (26). Losses are made in this phase since there is a high number of promotion
23
Review
International Journal of Basic and Clinical Studies (IJBCS)
2012;1(1): 20-38. Kuzu S
activities and a low sales volume (27). The growth phase lasts from the break-even point until
the maturity period and enterprises want to prolong this phase. Sales increase and profit starts
to increase. The number of the competitors in the market also increases. The product enters
also other sections of the market and the distribution network widens. In the maturity phase,
the sales and competition are at the highest level. Enterprises strive to protect their market
shares. Since enterprise runs in full capacity, unit costs are at the lowest level. The
abandonment phase lasts until the transition to loss due to the decrease in sales. The decrease
rate of each product is different. The decrease period may be slow. It is difficult to recognize
that the product is in this phase. When sales and profitability decrease, some enterprises
abandon the market. The ones that remain in the market, on the other hand, reduce the number
of their products. These enterprises exit the small market sections and weak commercial
channels and reduce their prices by cutting promotion budgets. In line with the developments,
especially pharmaceutical companies reduce the sales of their products in the market or even
recall the products from the market due to the competitive environment or an invention which
is more advanced than their invention.
Figure 1. The Relationship between Product Life Cycle and Profitability (28).
Profits/ Sales
Sales
Profits
Replacement
Replacement
Time
Introduction
Growth
Maturity
Decline
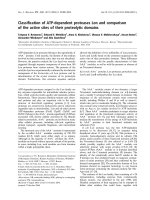
The life phases of a pharmaceutical product are demonstrated on a product life cycle curve.
As can be seen in Figure 2 below, this curve shows the situation of the pharmaceutical
product to be introduced to the market by taking into consideration the sales volume and
profitability factors.
24
Review
International Journal of Basic and Clinical Studies (IJBCS)
2012;1(1): 20-38. Kuzu S
Figure 2. The Relationship between Product Life Cycle and Profitability Volume (29).
Sales
Volume
Introduction
Growth
Growth Rate
High
High
Market Share
Low
High
Cash Need
High
Low
Profitability
Low
High
Production
Low
High
Cost
High
Low
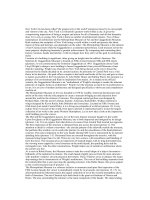
Figure 3: Product Life Cycle (30).
Product
Life
Cycle
Costs 66%
Maturity
Decline
Low
High
High
High
High
Low
Low
Low
Low
Low
Low
High
Time
95%
85%
Cash
Flow
Percentage of
Actual
Product Life Cycle
Costs
Calculation
Identical cost
Preliminary
Planning
Phase
Design
Detailed Product Logistic
Design Phase
Support
25
Review
International Journal of Basic and Clinical Studies (IJBCS)
2012;1(1): 20-38. Kuzu S
As can be seen in Figure 3, according to the life cycle costing approach, an important part of
the production and after sales costs are related to decisions made in the design phase.
Therefore, the production and usage costs that depend on the pharmaceutical product to be
produced are shaped in the design phase, before the production phase. Whether in case of
drugs or in case of products, only 20% of the costs can be manipulated in the production
phase and the following phases and this fact necessitates a cost approach which is not limited
to the production phase (31). Figure 4 below shows the flowchart of all phases.
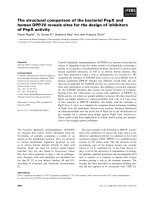
Figure 4. Product Life Cycle Cost Process (32).
Product Life Cycle Process
Research
Development
High Costs
Desing
Product
Marketing
Customer
Customer
Low Costs
3. The Concept of Product Life Cycle from the Viewpoint of Producer
The product life cycle cost system process is discussed through three viewpoints: consumer
viewpoint, producer viewpoint and marketer viewpoint. Indeed, these different viewpoints
concerning life cycle constitute a whole. The maximization of the return to be obtained from
the product life or the minimization of the costs cannot be achieved without understanding the
intertangled relationships between these different angles. The producer, calculations consist of
the estimation of the costs of design, engineering, industrialization and production of a new
product and in the analysisof these costs throughout the life cycle (33). The drug producer has
to know what kind of a value is gained by the customer with the product it offers and the cost
incurred by the customer in order to gain the said value (34). For instance, the cost of a car
from the viewpoint of consumer (acquisition cost + usage cost + maintenance cost) is the
sales value of the car. Boeing Company paid special attention to the customer life cycle costs
while designing Boeing 777. It shortened the time to be spent for routine maintenance by
26
Review
International Journal of Basic and Clinical Studies (IJBCS)
2012;1(1): 20-38. Kuzu S
performing it in different areas and reduced the airplane’s acquisition and maintenance costs
and thus justified the high price of Boeing 777 (35).
Even though the product life cycle costs of the producer differ depending on the activities
performed during the life cycle, they generally include the following phases (36);
1.
2.
3.
4.
5.
The concept of product,
Design,
Development,
Production,
Logistic Support.
The product life cycle costs of the producer are obtained by adding all costs that occur in the
above phases. While the product life cycle cost analysis from the viewpoint of consumer is
used as a part of the market analysis conducted to find the answer to the question “how much
should the features of the products cost for the consumer throughout the product life cycle?”,
the producer life cycle costing analysis tries to find out the cost effects of the features of the
products (37). In other words, it explores the effects of a cost incurred for a feature of the
product on the product profitability. Table 1 below shows the life cycle cost system that
belongs to different sections.
Table 1. Formation of Costs according to the Life Cycles of Different Products (38).
Life
Product
Types
Warplanes
Cycle
Phases
Research-Development and
21%
Design
Production
45%
Service and Disposal
34%
Average Life Cycle Period
30 years
Commercial
Airplanes
Nuclear
Missiles
Computer
Programs
20%
20%
75%
40%
40%
25 years
60%
20%
2-25 years
25%
5 years
4. Comparison of the Product Life Cycle Cost System with the Traditional Cost System
Product life cycle costing is a process used throughout the total life cycle of a product. These
costs are examined in the Figure below with respect to being charged on the producer and
consumer. The traditional product life cycle activities are displayed on the left side of the
Figure. However, the broader definition of life cycle also includes the strengthening activities
27
Review
International Journal of Basic and Clinical Studies (IJBCS)
2012;1(1): 20-38. Kuzu S
which are displayed on the right side of the Figure. Accordingly, the life of the product ends
when the product is no longer useful or when the product is worn out. The producer and user
costs in the real product life cycle are examined in the Figure 5 below:
Figure. 5 The Real Life Cycle and Costs of the Product (39).
The differences between the life cycle costing and the traditional costing are presented below
(40).
Traditional Method
PLCC Method
Takes the product
development and logistic
support costs as period cost.
Takes into consideration
only the costs concerning
production in product
costing.
Attaches importance to the
control of the costs only in
the production phase.
Is based on periodical
reporting.
Charges the product development and logistic support costs on
the product cost.
Takes into consideration all costs (including period expenses)
that can be related to the product in product costing.
Attaches importance to cost management from the
development phase forward.
Is based on product life cycle reporting.
5. The Relationship of the Product Life Cycle Cost Method with other Strategic Cost
Methods
28
Review
International Journal of Basic and Clinical Studies (IJBCS)
2012;1(1): 20-38. Kuzu S
Generally, there are three phases in the life cycle of a product: planning, production and
disposal. There are three basic means of decision-making in the said life cycle according to
the product costs:
•
Product life cycle costing
•
Target costing
•
Kaizen costing
While target costing supports the development and design phases of new models, Kaizen
costing supports the existing products in the production phase.
Target costing is an approach that is closely related to the design and development of a new
product. Another important issue to be considered with respect to target costing is that the
bigger part of the cost of a product is determined in the product design phase. Especially,
when the fact that pharmaceutical companies incur most of the costs in the R&D phase is
taken into consideration, the importance of target costing comes into the picture. There is little
to be done after a product is designed and started to be produced. For, most of the
opportunities for reducing the cost of the product are obtained and used during the design of
the product (41).The target costing method and the product life cycle costing method comply
with each other precisely at this point and the two methods are intertangled.
The target costing approach determines a target cost and aims at designing the product
according to the determined cost and thus to achieve the targeted cost instead of designing a
product and finding out the cost of the product (42). Indeed, the target costing has emerged
out of the need to attain early cost information which is required to be deduced, in the earliest
possible phases (planning and design) of a product’s life cycle, from the market structure and
the strategies of the enterprise in order to realize the planning, management and control aims
(43).
Figure 6. Formation of the Product Life Cycle Costs In Case Target Costing and
Traditional Methods are Utilized (44).
Cost
Target
Cost
and
PLCC
Traditional
Method
and PLCC
29
Review
International Journal of Basic and Clinical Studies (IJBCS)
2012;1(1): 20-38. Kuzu S
Time
Source: Ahmet Vehdi Can, “Target Costing, Theory and Practice”, Sakarya Publishing
House, Sakarya, 2004, p.174
Enterprises should apply target costing and product life cycle costing in an integrated way.
For, target costing is meaningful within the approach of product life cycle costing. As can be
understood also from the Figure above, in case the traditional method is used, the product life
cycle costs acceleratingly increase in the later phases of the life cycle, slow down in the
middle of the life cycle and acceleratingly decrease in the last phase of the life cycle.
However, when target costing is used, while relatively more costs are incurred in the early
phases of the product life cycle, great cost saving are provided in the later phases of the life
cycle . Every 1 Euro deducted before the production phase provides 8-10 Euros of saving in
the phases following the production phase . As an example of the firms which utilize these
savings, Toyota has incurred greater costs in the concept determination and design phases of
the product and obtained considerable savings in costs in the later phases of changes and
additions (45). The “more with less” approach, which was developed by General Electric due
to the parts deficiency during the World War II, has afterwards been transformed into an
organized effort to investigate the ways of providing the needed functions in a product with
minimum cost (46). American companies such as Ford and General Motors have also incurred
greater costs in the product design phase and gained considerable cost advantage (47). RollsRoyce states that 80% of the production costs of 2.000 parts occurs in the design phase (48).
Kaizen is a human-based, short-pitch, product-oriented effort that shares information and acts
in line with the motto “the best is the enemy of good”. Since Kaizen is a philosophy which
aims to develop all factors concerning the processes where inputs turn into outputs, Kaizen
costing is the use of Kaizen techniques in order to reduce the costs of parts and products at a
pre-determined rate. Kaizen costing aims at small but continuous improvements in all
activities of competition-based enterprises by focusing on preventing wastes and reducing
costs (49).
30
Review
International Journal of Basic and Clinical Studies (IJBCS)
2012;1(1): 20-38. Kuzu S
6. Application in Pharmaceutical Company
Cost management through the product life cycle is applied to a German pharmaceutical firm
which is called as X. Firm plans to produce a new pharmaceutical product in 2012. Product
life cycle is accepted as five years. During application period, inflation rate is assumed to be
constant at 3 %.
In a pharmaceutical firm, items which are included to the application would be affected
differently by the inflation rates. So in this study, inflation rate is taken as 3% in average for
all these items included in the application. While estimating items’ net present value, discount
rate is accepted as 12% which is calculated by the weighted average cost of capital. For the
reliability of the study, dependable data are included to the application and cash flow & cash
outflow is accepted as ordinary. Items those would be a part of cost element in production of
the pharmaceutical product (drug) is taken into account. Estimated data of produce and sale
amounts from 2012 to 2016, are included to the application. These data are just ex-ante. Fixed
Money Approach is used as a base in this study.
In this study, along the application of cost management through the product life cycle, firstly
items that would be a part of cost element in production would be increased by the inflation
rate. Then items which were increased by the inflation rate would be discounted by the net
present value. At the last stage, unit cost, sale price, and cost amount through the life cycle of
the product would be calculated and afterwards the statement of income would be drawn
according to the cost management of product life cycle.
31
Review
International Journal of Basic and Clinical Studies (IJBCS)
2012;1(1): 20-38. Kuzu S
Table 2 : Estimated Cost Data of New Drug Production in 2012
COSTS (€)
1.Pre production Costs
Product Planning and Design Concept Costs
Product Design and Development Costs
Research and Development Costs
TOTAL
2.Production Costs
3.After Sales Costs
Pharmacists- Drug Offices’ Costs of
Distribution
Marketing Costs
Warranty Costs
Advertisement- Presentation Costs
TOTAL
TOTAL
700.000
400.000
100.000
1.200.000
2.000.000
80.000
300.000
50.000
70.000
500.000
Table 3 Enhancement of Predicted Costs, of The New Product According to The
Inflation Coefficient Rate and Discount to The Base Year
32
Review
International Journal of Basic and Clinical Studies (IJBCS)
2012;1(1): 20-38. Kuzu S
Pre-Production
Costs
Costs
2012
Product Planning and
Design Concept Costs
700.000x1,0
3
Product Design and
Development Costs
Research and Development
Costs
400.000x1,0
3
100.000x1,0
3
Inflation
Discount
Adjustment
Factor TOTAL
Coefficient Costs
%12
€
721.000
0,8929
643.781
412.000
0,8929
367.875
103.000
0,8929
91.969
Table 4. Enhancement of Predicted Costs, of The New Product According to The
Inflation Coefficient Rate in The Application Period.
Ad
Warranty Costs
Marketing Costs
Pharmacists- Drug
Offices’ Costs of
Distribution
Production Costs
Cost/Years
2012
Cost Before Inflation
Coefficient
Application
2.000.000
Inflation Coefficient
1,03
Cost After Inflation
Coefficient
Application
2013
2014
2015
2016
1,06
1,09
1,12
1,15
2.060.000 2.120.000 2.180.000 2.240.000 2.300.000
Cost Before Inflation
Coefficient
Application
80.000
Inflation Coefficient
1,03
1,06
1,09
1,12
1,15
Cost After Inflation
Coefficient
Application
82.400
84.800
87.200
89.600
92.000
Cost Before Inflation
Coefficient
Application
300.000
Inflation Coefficient
1,03
1,06
1,09
1,12
1,15
Cost After Inflation
Coefficient
Application
309.000
318.000
327.000
336.000
345.000
Cost Before Inflation
Coefficient
Application
50.000
Inflation Coefficient
1,03
1,06
1,09
1,12
1,15
Cost After Inflation
Coefficient
Application
Cost Before Inflation
51.500
70.000
53.000
54.500
56.000
57.500
33
Review
International Journal of Basic and Clinical Studies (IJBCS)
vertisementPresentation Costs
2012;1(1): 20-38. Kuzu S
Coefficient
Application
Inflation Coefficient
Cost After Inflation
Coefficient
Application
1,03
1,06
1,09
1,12
1,15
72.100
74.200
76.300
78.400
80.500
Marketing
Costs
Pharmacists- Drug Offices’ Production
Costs of Distribution
Costs
Table 5. Enhanced Predicted Costs by the Inflation Coefficient Rate in the Application
Period Discounting in the Base Year.
Costs After
Inflation
Coefficient
Application
€
Discount
Factor
%12
2.060.000
2.120.000
2.180.000
2.240.000
2.300.000
82.400
84.800
87.200
89.600
0,8929
0,7972
0,7118
0,6355
0,5674
0,8929
0,7972
0,7118
0,6355
Inflation
Coefficient
Applied
Estimated
Costs
(2012 Base
Year)
1.839.374
1.690.064
1.551.724
1.423.520
1.305.020
73.575
67.603
62.069
56.941
92.000
309.000
318.000
327.000
336.000
345.000
0,5674
0,8929
0,7972
0,7118
0,6355
0,5674
52.201
275.906
253.510
232.759
213.528
195.753
34
Review
International Journal of Basic and Clinical Studies (IJBCS)
AdvertisementWarranty
Presentation Costs
Costs
2012;1(1): 20-38. Kuzu S
51.500
53.000
54.500
56.000
57.500
72.100
74.200
76.300
78.400
0,8929
0,7972
0,7118
0,6355
0,5674
0,8929
0,7972
0,7118
0,6355
45.984
42.252
38.793
35.588
32.626
64.378
59.152
54.310
49.823
80.500
0,5674
45.676
Table 6. Cost of The New Product Life Cycle Through The Years.
Cost/Year
Product Planning and
Design Concept Costs
Product Design and
Development Costs
Research and Development
Costs
Production Costs
Pharmacists- Drug Offices
Distribution costs
Marketing Costs
Warranty Costs
AdvertisementPresentation Costs
TOTAL
2012
2013
2014
2015
2016
TOTAL
643.781
643.781
367.875
367.875
91.969
91.969
1.839.37 1.690.06 1.551.72 1.423.52 1.305.02 7.809.70
4
4
4
0
0
2
73.575
67.603
62.069
56.941
52.201
275.906
45.984
253.510
42.252
232.759
38.793
213.528
35.588
195.753
32.626
312.388
1.171.45
5
195.243
64.378
59.152
54.310
49.823
45.676 273.340
3.402.84 2.112.58 1.939.65 1.779.40 1.631.27 9.762.12
2
0
5
0
5
8
35
Review
International Journal of Basic and Clinical Studies (IJBCS)
2012;1(1): 20-38. Kuzu S
Table 7. Calculation of Unit Costs by Using Both the Traditional Cost System and The
With The Application With The Application Product Life
Traditional Cost Method
Cycle Cost Method
Cost Of The New Product Life Cycle System
Cost/Years
Product Life Cycle
Cost
2014
1.939.65
3.402.842 2.112.580
5
Forecast Production
Output
2012
2013
100.000
120.000
34,03
1.839.37
4
17,6
13,85
11,12
9,6
1.690.06
4
1.551.724 1.423.520 1.305.020
100.000
120.000
140.000
160.000
170.000
18,39
14,08
11,08
8,9
7,68
140.000
2015
2016
1.779.40
0
1.631.275
160.000
170.000
Product Life Cycle
Unit Cost
Production Cost
Forecast Production
Output
Product Unit Cost
Table 8. Enhancement of the Predicted Sales Revenue of The New Product According to
The Inflation Coefficient Rate and Discount to the Base Year.
Before Inflation
Coefficient
Applied Estimated
Sales Revenue
Sales Revenue
/Years
2012
5.000.000
2013
2014
2015
2016
TOTAL
36
Review
International Journal of Basic and Clinical Studies (IJBCS)
Inflation
Coefficient
1,03
1,06
1,09
1,12
1,15
After Inflation
Coefficient Applied
Estimated Sales
Revenue
5.150.000
5.300.000
5.450.000
5.600.000
5.750.000
Discount
Factor
%12
0,8929
0,7972
0,7118
0,6355
0,5674
Inflation Coefficient and Discount
Applied Sales Revenue
(2012 Base Year)
2012;1(1): 20-38. Kuzu S
4.598.435
4.225.160
3.879.310
3.558.800
3.262.550
19.524.255
X PHARMACEUTICAL MANUFACTURING BUSİNESS INC. INCOME
STATEMENT UNDER PRESENT VALUES OF ACCOUNT BETWEEN
2012-2016
Sales
Production Costs
-Production Cost
-Preproduction Cost
Gross Margin
19.524.255
8.913.326
7.809.702
1.103.624
10.610.929
37
Review
International Journal of Basic and Clinical Studies (IJBCS)
2012;1(1): 20-38. Kuzu S
After Sales Costs
-Pharmacists- Drug Offices
Distribution Costs
-Marketing Costs
-Warranty Costs
-Advertisement- Presentation Costs
1.952.426
312.388
1.171.455
195.243
273.340
Net Profit
8.658.503
Profitability Ratio
44%
Table 9. Distribution of the Costs Which are Occured in the Total Product Life Cycle
Period
DRUG PRODUCT LİFE CYCLE TOTAL COST
The Share of Total
COSTS
AMOUNT
%
Preproduction Cost
1.103.624
10
Production Cost
7.809.702
72
After Sales Costs
1.952.426
18
Product Life Cycle Total Cost
10.865.752
100
The results of this application can be summarized as follows ;
As it can be seen from the table, cost structure of the pharmaceutical firm X all through the
product life cycle of the new product, is like that ; % 72 of total cost is production cost and %
28 of total cost is composed of before production and after sale costs. If it were analyzed by
the Traditional Cost System, only the cost of production would have been focused. In that
case, before production and after sale costs were going to be ignored and cost reduction would
be just counted in the production cost. In conclusion, cost of product life cycle gives
dependable results rather than the traditional cost system.
The other important conclusion can be drawn from this study is that unit cost. Unit cost which
is calculated by the Traditional Cost System means the unit production cost. If a
38
Review
International Journal of Basic and Clinical Studies (IJBCS)
2012;1(1): 20-38. Kuzu S
pharmaceutical firm ignored the other cost units which would be occurred through the product
life cycle period then the financial statements of the firm wouldn’t reflect the realities. The
new technological developments lower the production costs but raises the non-production
costs. Recent studies elucidate that % 90 of the total costs of product consists of preproduction and after production costs. By analyzing the Net Present Value of the Project
which is greater than zero, it can be said that this project is realizable one.
Product’s real added value for the firm can be drawn from the income statement which
inludes all the costs of the product through its life cycle. By income statement, a
pharmaceutical firm can realize if the product bears the costs or not. As the income statement
is made up within the frame of net present value, relevant items’ present values are analyzed
as the sum of their present values form 2012 to 2016.
In fact, income statements which are drawn by periods in traditional accounting system does
not indicate the real added value of the product to the firm. Periodical income statements
reflect just the relevant periods’ income and expenditure and this causes the handicap of
evaluation all income and expenditure of the product all through its life cycle as a whole. In
that point, to attain the profitability ratio that the firm request, the question of which cost
components should be saved, plays an important role in the analyze.
Conclusion
Increasing competition and globalization force the firms to take notice of their rivals. In these
competitive environment, firms should take notice of not only their production cost and but
also pre-production and after production costs. Nowadays, policy of production has been
changed and customer oriented production has become prominent. Customers play an
important role in the production period of the firms.
In conclusion, policy of the cost oriented sales has been changed. Nowadays, in this
increasing competitive environment, the viewpoint of the production technologies changes
day by day within the development of information technology. Executives of the
Pharmaceutical firms are obliged to focus on all the production costs instead of significant
39
Review
International Journal of Basic and Clinical Studies (IJBCS)
2012;1(1): 20-38. Kuzu S
part of the production process according to cost of the product life cycle period. Within the
frame of Product Life Cycle Cost System, not only the cost of production but also the other
costs of non-production process. By this means, Pharmaceutical firms can obtain savings from
the costs in the production process.
References
1. Langdon, Davis. Literature review of Life Cycle Costing and Life Cycle Assesmant.
Draft Review June 2006:6
2. Lindholm, A. and Suomala, P. Learning by Costing: Sharpening Cost Image through
Life Cycle Costing? .The 7th Manufacturing Accounting Research Conference.
Tampere, Finland, May 30 - June 1, 2005
3. Woodward, D. Life Cycle Costing – Theory, İnformation Acquisition And
Application. International Journal of Project Management, 1997; 15:(6):335-344
4. Petr Nemeck ve Alena Kocmanova. Integration of Life Cycle As A Business Aproach.
Economics and Management, 2007:525
5. B. S. Dhillon. Life Cycle Costing: Techniques, Models and Applications. Gordon and
Breach Science Publishers,1989: 46-79
6. Sterner, E. Life-Cycle Costing And Its Use İn The Swedish Building Sector. Building
Research & Information, 2000;28:(5):387-393
7. Ardit, D. and Messiha H.M. Life Cycle Cost Analysis (LCCA) in Municipal
Organizations. Journal of Infrastructure Systems, 1999;5:(1):1-10
8. Havang et al; H. Hwang, S. Bae and G. Cho. Performance Model for Manufacturing
Facility Planning based on System Configuration, RAM and LCC. International
Journal of Innovative Computing, Information and Control, ICIC International,
February 2007;3:(1):199-209
9. Hyvönen, T. Management accounting and information systems: ERP versus BoB.
European Accounting Review, 2003;12:(1):155-173
10. M. Sandberg, P. Boart and T. Larsson. Functional Product Life-cycle Simulation
Model for Cost Estimation in Conceptual Design of Jet Engine Components.
Concurrent Engineering: Research and Applications, Dec 2005;13:(4):331-342
11. R. Enparantza, O. Revilla, A. Azkarate and J. Zendoia. A Life Cycle Cost Calculation
and Management System for Machine Tools. 13th CRIP International Conference on
Life Cycle Engineering, 2006:711-716
40
Review
International Journal of Basic and Clinical Studies (IJBCS)
2012;1(1): 20-38. Kuzu S
12. M. Carpentieri and M. Papariello. A Life Cycle Cost Framework for Automotive
Production Lines. 13th CRIP International Conference on Life Cycle Engineering,
2006:717-722
13. Aye L, Bamford N, Charters B, Robinson J. Environmentally sustainable
development: a life-cycle costing approach for a commercial oKce building in
Melbourne, Australia. Construction Management and Economics, 2000;18: 927-34
14. N. Davis, J. Jones and L. Warrington. A Framework for Documenting and Analyzing
Life Cycle Costs using a Simple Network Based Representation. , Proceedings of
Annual Reliability and Maintainability Symposium, IEEE, 2003:232-236
15. Abraham DM, Dickinson RJ. Disposal costs for environmentally regulated facilities:
LCC approach. Journal of Construction Engineering and Management; 1998; 124:
(2):146–54
16. A. Widiyanto, S. Kato and N. Maruyama. A LCA/LCC Optimized Selection of Power
Plant System with Additional Facilities Options. Journal of Energy Resources
Technology, Dec. 2002;124:290-298
17. Sterner E. Green procurement of buildings: estimation of life-cycle cost and
environmental impact. Ph. D. dissertation thesis, Department of Mining Engineering,
LuleXa University of Technology, 2002.
18. A. AL-Hajj and G. Aouad. The Development of an Integrated Life Cycle Costing
Model using Object Oriented and VR Technologies. Construction Informatics Digital
Library, 1999:78-1999-2901
19. R. J. van Baaren and K. Smit. Design for RMS/LCC - the Development of a Design
Model. Proceedings of Annual Reliability and Maintainability Symposium, IEEE,
1999: 330-335
20. R. Foster and C. Hanley. Life Cycle Cost Analysis for Photovoltaic Water Pumping
Systems in Mexico. 2nd World Conference on Photovoltaic Solar Energy Conversion,
Vienna, Austria, July 1998.
21. Asiedu Y. Product Life Cycle Cost Analysis: State of the art review. International
Journal of Production Research, April 1998;36:(4):883-908
22. L. Bodsberg and P. Hokstad. A System Approach to Reliability and Life Cycle Cost of
Process Safety Systems. IEEE Transactions on Reliability, June 1995;44:(2):179-186
23. Sten, Bengt. Environmental Costs and Benefits in Life Cycle Costing. Management of
Environmental Quality, 2005;16:(2):108
24. Woodward, David G. Life Cycle Costing-Theory. İnformation Acquasition and
Application. İnternational Journal of Project Management, 1998;15:(6):338
41
Review
International Journal of Basic and Clinical Studies (IJBCS)
2012;1(1): 20-38. Kuzu S
25. Çelik Muhsin. Approaches to Product Life Cycle Coost Evaluation Of Environmental
Impact Business Decisions. Journal Of Accounting and Auditing Overview, April
2006:130
26. Balyemez,Figen Evrim İlden Develi, D.Zeynep Bayazıt Şahinoğlu. V. National
Manufacturing Research Symposium. İstanbul Commerce University, November
2005:25-27
27. Erden, Selman. A. Cost Mangement and Costing for Global Competitiveness. Journal
of World of Accounting Science, December 2003;5:(4):87
28. Sevim, Adnan. A Contemporary Means in the Strategic Profit Management: Product
Life Cycle Cost System. Journal of World of Accounting Science, 2002;4:(1):140
29. Karcıoğlu Reşat. Strategic Cost Management, New Approaches in Cost and
Management Accounting. Aktif Publishing House, Erzurum,2000:90
30. Altunay, M.Akif. A Contemporary Costing System: Activity Based Costing System
and an Application on a Textile Enterprise. Süleyman Demirel University, Institute of
Social Sciences, Department of Business Management MA Thesis, 2007.
31. Altunay, M.Akif. A Contemporary Costing System: Activity Based Costing System
and an Application on a Textile Enterprise. Süleyman Demirel University, Institute of
Social Sciences, Department of Business Management MA Thesis, 2007.
32. Edward J.Blocher, Kung H.Chen, Thomas W.Lin Mc Graw, Hill. Cost Management A
Strategic Emphasis. 2nd edition, 2000:168-169
33. Asiedu Y, Gu P. Product life cycle cost analysis: state of the art review. International
Journal of Product Research, 1998;36:(4):836-908
34. Basık, Orhan. F; Türker, İpek. Strategic Cost Analysis and Management. V. National
Manufacturing Research Symposium, İstanbul Commerce University, November 2005
35. Charles T.Hongren, Srikant M.Datar, George Foster, et al. Cost Accounting. Pearson
International Edition,13. Edition, Mar 4, 2008:471
36. Susman, I,Gerald. Product Life Cycle Management. Practices in Cost Management
Boston, 1990:226
37. Wayne J.Morse, James R.Davis, Al. L.Hartgraves. Managemen Accounting.
Addısion-Wesley Publushing Company, Third Edition, 1991: 33
38. Can, Vehdi. A. Target Costing, Theory and Practice. Sakarya Publishing House,
Sakarya, 2004:170
42
Review
International Journal of Basic and Clinical Studies (IJBCS)
2012;1(1): 20-38. Kuzu S
39. Köse Tunç. Decision-Making Means According to Product Costs: Product Life Cycle
Costing, Target Costing and Kaizen Costing. Osmangazi University Journal of Social
Sciences, December2002;3:(2):84
40. Çetinkaya, Zeynep. Strategic Cost Management. Kahramanmaraş Sütçü İmam
University Institute of Social Sciences, Department of Business Management MA
Thesis, 2008: 46
41. Erden, Selman. A. Relation of Cost Management Systems Production Environments
and Strategic Cost Management. Türkmen Publishing House, 2002:203
42. Erden, Selman. A. Relation of Cost Management Systems Production Environments
and Strategic Cost Management. Türkmen Publishing House, 2002:203
43. Can, Vehdi. A. Target Costing, Theory and Practice. Sakarya Publishing House,
Sakarya, 2004:170
44. Can, Vehdi. A. Target Costing, Theory and Practice. Sakarya Publishing House,
Sakarya, 2004:174
45. Doğan, Zeki. A New Approach to Cost Management: Life Cycle Costing Method.
Journal of World of Accounting Science, 2000;4:98
46. Erden, Selman. A. Cost Mangement and Costing for Global Competitiveness. Journal
of World of Accounting Science, December 2003;5:(4):88
47. Doğan, Zeki. A New Approach to Cost Management: Life Cycle Costing Method.
Journal of World of Accounting Science, 2000;4:98
48. Doğan, Zeki; Hatipoğlu Ayşegül. A Study on the Applicability of Target Costing
Method. Journal of World of Accounting and Finance, 1998:21:102
49. Acar, Durmuş; Alkan, Hasan. Kaizen Costing Reducing The Cost Of Production.
Journal of World of Accounting Science, 2003;5:22
43