School Quality And The Black-White Achievement Gap
Bạn đang xem bản rút gọn của tài liệu. Xem và tải ngay bản đầy đủ của tài liệu tại đây (294.21 KB, 55 trang )
NBER WORKING PAPER SERIES
SCHOOL QUALITY AND THE BLACK-WHITE ACHIEVEMENT GAP
Eric A. Hanushek
Steven G. Rivkin
Working Paper 12651
/>
NATIONAL BUREAU OF ECONOMIC RESEARCH
1050 Massachusetts Avenue
Cambridge, MA 02138
October 2006
Support for this work has been provided by the Packard Humanities Institute. The views expressed
herein are those of the author(s) and do not necessarily reflect the views of the National Bureau of
Economic Research.
© 2006 by Eric A. Hanushek and Steven G. Rivkin. All rights reserved. Short sections of text, not
to exceed two paragraphs, may be quoted without explicit permission provided that full credit, including
© notice, is given to the source.
School Quality and the Black-White Achievement Gap
Eric A. Hanushek and Steven G. Rivkin
NBER Working Paper No. 12651
October 2006
JEL No. H4,H7,I2,J15,J7,I1
ABSTRACT
Substantial uncertainty exists about the impact of school quality on the black-white achievement gap.
Our results, based on both Texas Schools Project (TSP) administrative data and the Early Childhood
Longitudinal Survey (ECLS), differ noticeably from other recent analyses of the black-white achievement
gap by providing strong evidence that schools have a substantial effect on the differential. The majority
of the expansion of the achievement gap with age occurs between rather than within schools, and specific
school and peer factors exert a significant effect on the growth in the achievement gap. Unequal distributions
of inexperienced teachers and of racial concentrations in schools can explain all of the increased achievement
gap between grades 3 and 8. Moreover, non-random sample attrition for school changers and much
higher rates of special education classification and grade retention for blacks appears to lead to a significant
understatement of the increase in the achievement gap with age within the ECLS and other data sets.
Eric A. Hanushek
Hoover Institution
Stanford University
Stanford, CA 94305-6010
and NBER
Steven G. Rivkin
Amerst College
Department of Economics
P.O. Box 5000
Amherst, MA 01002-5000
and NBER
Schools, Peers, and the Black-White Achievement Gap
By Eric A. Hanushek and Steven G. Rivkin
Cognitive skills appear strongly correlated with black and white gaps in school attainment
and in wages, and this has motivated aggressive policies to raise the quality of education for
blacks. 1 The landmark decision in Brown v Board of Education that attacked racial segregation of
schools was the modern beginning of concerted federal, state, and local actions directed at
improving black achievement. 2 Along with subsequent court cases, Brown ushered in a profound
change in both school and peer characteristics, while contemporaneous increases in school
spending, brought on in part by school finance litigation, further raised the resources devoted to
black students in the public schools. Nonetheless, racial disparities have been stubbornly resistant
to policy, raising the possibility that schools really cannot be effective policy instruments. 3
Table 1 provides a stark picture of the black-white differences in academic, economic, and
social outcomes that have survived the schooling policies of the last decades. Among men and
women 20 to 24 years old, blacks are far less likely to complete or be in the process of completing
college, far less likely to work, and far more likely to be in prison or other institution. The rates of
incarceration and non-employment for young black men paint a particularly dire picture.
These outcomes, combined with the weak and often contradictory statistical evidence on
the effects of specific school policies on achievement, raise substantial doubts that schools are an
important determinant of achievement inequality. 4 Moreover, recent research generally provides
1
O'Neill (1990) and Neal and Johnson (1996) provide evidence on wage differences, and Rivkin (1995)
provides evidence on differences in educational attainment and employment.
2
Brown v. Board of Education, 347 U.S. 483 (1954).
3
Neal (2006) documents black-white gaps in both quantity and quality of schooling and shows evidence
that convergence of earlier periods slowed or stopped in the 1980s and 1990s.
4
Earlier optimism about narrowing gaps (Jencks and Phillips (1998)) largely dissipated with new evidence
that the black-white achievement gap stayed constant or even grew during the 1990s (National Center for
Education Statistics (2005)). In terms of the specific policies that have been pursued, direct evidence on the
benefits of school desegregation remains limited. Review of the evidence surrounding desegregation actions
provides limited support for positive achievement effects (Schofield (1995)); Guryan (2004) does, however,
find that desegregation reduced the probability of dropping out of high school. Accumulated evidence does
not provide strong support for the belief that higher expenditure typically leads to substantial improvements
2
Table 1. Distribution of 20 to 24 year olds by School Status, Employment Status, Years of Schooling, and
Institutionalization Status in 2000 (percentage by Gender and Race)
High school dropout
Institutionalized
Not
employed
Employed
High School Graduate
Attending college
Not Attending college
Not
Not
Employed
Employed
employed
employed
College Graduate
Not
employed
Employed
Total
observations
Men
Blacks
Whites
14.1%
2.7%
10.3%
4.2%
6.7%
9.5%
12.7%
13.6%
13.2%
22.5%
15.0%
6.3%
23.3%
29.0%
1.2%
2.3%
3.8%
10.0%
10,459
53,820
Women
Blacks
Whites
0.9%
0.3%
10.3%
6.4%
5.6%
4.7%
15.6%
13.9%
20.0%
26.8%
17.2%
9.8%
21.3%
19.5%
2.2%
3.1%
7.0%
15.5%
10,728
50,664
Note: Row percentages add to 100 percent.
Source: Author calculations from Census 2000 Public Use Microdata Sample (PUMS).
additional support for that view. For example, Fryer and Levitt (2004, 2005) find that a substantial
racial achievement gap exists at entry to school and increases with age but that the majority of the
increase occurs within schools and is not explained by quantifiable school characteristics. 5
Clotfelter, Ladd, and Vigdor (2005) document a large third grade achievement gap in North
Carolina that does not increase with schooling. Our past work, on the other hand, highlights
substantial achievement impacts of specific peer and teacher inputs whose distributions differ
substantially by race, suggesting possible school based explanations of at least a portion of the
black-white achievement differences. 6
We trace the racial achievement gap as it evolves from kindergarten to the end of middle
school and are able largely to reconcile the disparate findings. The resolution involves several
elements. First, prior analyses have not accurately decomposed changes in the racial gap with age,
and correction of this decomposition alters the basic picture. Second, a variety of survey
difficulties, non-uniform measurement errors over time, and differential missing test data lead to
substantial distortions in the apparent racial achievement gaps that, if uncorrected, mask the true
character of racial gaps. Finally, careful attention to differences in and the effects of specific peer
and school factors yields a clear explanation of the expansion of the gap with age.
We use data from the Early Childhood Longitudinal Survey (ECLS) – the basis for the
Fryer and Levitt work – for analysis through grade 5 and the Texas Schools Project (TSP) panel
data for grades 3 through 8. Although the richer and more extensive TSP data offer the clearest
picture of school influences, they are not nationally representative and do not provide achievement
results in the earliest grades.
in the quality of instruction, particularly with regard to higher pay for teachers with a masters degree or
substantial experience (Hanushek (2003)).
5
Note that Murnane, Willett, Bub, and McCartney (2005) cannot replicate either the basic school patterns of
the achievement gap or the influence of measured family background on the gaps when they go to a different,
but in some ways richer, data base. Neal (2006) finds little evidence of a growing gap past entry to school and
discounts the role of schools in either creating or ameliorating any gaps.
3
Differences in the achievement distributions for blacks and whites at school entry
complicate comparisons if growth rates differ systematically by initial achievement either due to
actual differences in skill acquisition or limitations in the measurement of achievement. Several
hypotheses have been offered that suggest that the gap may grow more rapidly for initially high
achieving blacks. On the one hand, blacks who excel in the early grades may face the strongest peer
pressure against academic success. Alternatively, higher achieving blacks may fall further from the
center of their school’s achievement distribution and be less likely to participate in an academic
program that facilitates continued excellence. 7 Importantly, we consider the effects of test
measurement error and regression to the mean on the pattern of racial achievement differences.
Our results differ sharply from the other recent analyses of the black-white achievement
gap. First, we find that the majority of the expansion of the achievement gap with age occurs
between rather than within schools in both the ECLS and TSP data. The contrast with the findings
of Fryer and Levitt (2005) appears to result from a problem with their achievement decomposition.
Second, we find that identifiable school factors – the rate of student turnover, the proportion of
teachers with little or no experience, and student racial composition – explain much of the growth
in the achievement gap between grades 3 and 8 in Texas schools. Unfortunately, the structure of
the ECLS does not permit the estimation of the causal effects of these variables for the grades and
test instruments in that sample. Nonetheless, the similar race differences in school and peer
characteristics in the TSP and ECLS data and the much larger increases in the between-school
component of the racial achievement gap in the early ECLS grades suggest the impact of schools is
likely to be as large if not larger in the earlier grades.
Importantly, a comparison of the TSP data and the ECLS strongly suggests that nonrandom
6
Hanushek, Kain, and Rivkin (2004a) investigate the effects of student mobility, Rivkin, Hanushek, and
Kain (2005) investigate the effects of teacher experience, and Hanushek, Kain, and Rivkin (2006) investigate
the effects of racial composition.
7
Fryer and Levitt (2005) consider a related hypothesis through comparing performances of blacks and whites
on alternative cognitive tests and suggest that blacks may indeed be doing more poorly on tests of higher
4
attrition due in large part to student and family mobility leads the ECLS to understate significantly
the increase in the achievement gap with age. In addition, the much higher rates of special
education classification and grade retention for blacks, particularly for boys, indicates that the
select sample of tested students provides an incomplete picture of the academic difficulties
experienced by blacks relative to whites in both administrative and survey data.
The next section describes the ECLS and TSP data sets used in this analysis. Section 2
documents changes in the racial achievement gap with age for all blacks and whites and by initial
achievement and gender. This section also decomposes the gap into within-and between-school
components to illustrate the potential importance of schools in explaining growth in the
achievement differential. Section 3 describes the empirical model and estimates of the effects of
specific school and peer factors on achievement. The final section summarizes the findings and
discusses potential implications for policy.
1. ECLS and TSP Data
This paper employs both the Early Childhood Longitudinal Survey Kindergarten Cohort
(ECLS) and Texas Schools Project (TSP) data sets in the investigation of the black-white
achievement gap. The ECLS is designed to be a nationally representative sample for grades K-5,
and the TSP data contain administrative information on the universe of Texas public school
students for grades 3-8. Together these data span the elementary and middle school years, and the
stacked panels contained in the TSP data facilitate the estimation of school and peer group effects
on achievement.
A. ECLS Data
The ECLS is a survey of the National Center for Education Statistics that is designed to
provide extensive information on the early school years. To date six waves of data have been
collected, beginning with the base year kindergarten survey in fall 1998. Follow-up surveys were
order skills. Murnane, Willett, Bub, and McCartney (2005) further question the impact of test content and
score calculations on the pattern of achievement gaps.
5
completed in the spring of kindergarten, the spring of the subsequent academic year and every two
years thereafter for all students and in the fall of the year following kindergarten for a much smaller
sub-sample. Students remaining with their cohort were thus surveyed twice in kindergarten, once or
twice in first grade, in third grade, and in fifth grade. Because the fall survey for the first grade was
administered to only a subset of students, we do not use information from that wave.
Importantly, only a sub-sample of students who changed schools was included in the
follow-up waves. Given the high mobility rate of blacks and difficulties tracking some movers, this
sampling approach potentially contaminates racial achievement comparisons. As we illustrate
below, it appears that nonrandom selection into the follow-up waves distorts the black-white
comparisons in ways that understate the growth of the achievement gap with age.
Standardized mathematics and reading tests were administered in each of the waves along
with child surveys that elicit information on race, ethnicity, family financial circumstances,
parental education and employment, and a number of other variables. Information on teacher,
school, and student demographics was also collected from schools and teachers each academic year,
and sampling weights were provided in order to make the data nationally representative.
A two stage adaptive testing procedure was used to measure achievement. Students first
completed a short pretest that sorted them into categories on the basis of the number correct.
Students were administered different tests depending upon the pretest score, and test administrators
used item response theory algorithms to grade the examinations. Theoretically the tests are
vertically scaled such that a given point differential reflects a given difference in knowledge
throughout the scale regardless of whether the differential reflects different scores on the same test
or results for different grades.
Because of the relatively small sample size, limited and potentially noisy information on
family background, and concerns about the possibility of omitted variables bias that cannot be
mitigated using the panel data techniques employed in the analysis of the TSP data, we do not use
the ECLS data in the estimation of school, peer, and teacher effects. Rather we use the test scores to
6
describe the evolution of the racial achievement gap for this cohort and use the information on
teachers and peers to characterize racial differences in the school environment.
B. TSP Data
The TSP data set is a unique stacked panel of school administrative data constructed by the
UTD Texas Schools Project. The data we employ track the universe of Texas public elementary
students as they progress through school. For each cohort there are over 200,000 students in over
3,000 public schools. Unlike many data sets that sample only small numbers from each school,
these data enable us to create accurate measures of peer group characteristics. We use data on four
cohorts for grades three (the earliest grade tested) through eight. The most recent cohort attended
8th grade in 2002, while the earliest cohort attended 8th grade in 1999.
The student data contain a limited number of student, family, and program characteristics
including race, ethnicity, gender, and eligibility for a free or reduced price lunch (the measure of
economic disadvantage). The panel feature of the data, however, is exploited to account implicitly
for a more extensive set of background characteristics through the use of a value added framework
that controls for prior achievement. Importantly, students who switch schools can be followed as
long as they remain in a Texas public school.
Beginning in 1993, the Texas Assessment of Academic Skills (TAAS) was administered
each spring to eligible students enrolled in grades three through eight. The tests, labeled criteria
referenced tests, evaluate student mastery of grade-specific subject matter. This paper presents
results for mathematics. Because the number of questions and average percent right varies across
time and grades, test results are standardized to a mean of zero and variance equal to one.
Notice that the persistence of a constant differential in terms of relative score does not
imply a constant knowledge gap. If the variance in knowledge grows with age and time in school,
as we believe most likely, any deterioration in the relative standing of blacks on the achievement
tests would understate the increase in knowledge inequality.
The student database is linked to teacher and school information. The school data contain
7
detailed information on teachers including grade and subject taught, class size, years of experience,
highest degree, race, gender, and student population served. Although individual student-teacher
matches are not possible, students and teachers are uniquely related to a grade on each campus.
Students are assigned the average class size and the distribution of teacher characteristics for
teachers in regular classrooms for the appropriate grade, school, subject, and year.
3. The Facts about Racial Achievement Gaps
Beginning with the “Coleman report,” Equality of Educational Opportunity (Coleman et al.
(1966)), test score decompositions have been used to learn about the contribution of schools to the
variation in achievement. The logic is simply that school policies mainly affect differences across
schools, so a finding that only a small proportion of achievement variance occurs between schools
is suggestive of a limited role of schools as opposed to family and other factors that vary both
within and between schools. There are of course reasons why this rough logic might fail, 8 but it is
a useful starting point for understanding the basic pattern of achievement gaps.
Fryer and Levitt (2004, (2005) report that most of the black-white achievement differences
lie within schools, but their approach fails to capture accurately the contributions of the within- and
between-school components. Although there is a simple and well-known decomposition of the
variance of achievement into between- and within-school components, this calculation does not
carry over to consideration of the mean achievement gap. Specifically, except in the special and
uninteresting case of identical enrollment shares for blacks and whites across schools, the
between-school component of the mean gap does not equal the average overall gap minus average
within school gap as captured by the coefficient on an indicator for blacks from a school fixed
effect achievement regression. Given the uneven distribution of whites and blacks among schools,
this calculation produces erroneous measures of the within- and between- school contributions by
8
In particular, sorting by families and teachers leads to systematic differences in family and community
background among schools that is correlated to school and teacher quality, and differences in the quality of
instruction exist within schools (see, for example, Rivkin, Hanushek, and Kain (2005)).
8
ignoring the implications of the distribution of blacks and whites among schools.
An example illustrates the problem with setting the between-school component equal to
the overall gap minus the fixed effect coefficient. Consider a sample of 1,000 schools where all but
one is completely segregated. The fixed effect estimator of the “within” component of the
achievement gap would come entirely from the single school containing both black and white
students. This one school has virtually no effect on the overall gap and no information on the
difference between the segregated black and white schools. Nonetheless, if the within school
difference in this one school happened to be larger than the overall gap, this approach would imply
that the between-school contribution was negative and that differences among schools actually
reduced the overall achievement gap.
Equation (1) shows the appropriate weighting of the two components such that the
between-school component (first term in brackets) and the within-school component (second term
in brackets) adds up to the racial difference in average achievement ( Aw − Ab ). 9 The first term
shows explicitly how differences in the distributions of blacks and whites among schools with
different average levels of achievement determines the between-school component, where nds/nd is
the share of demographic group d in school s. 10
(1)
Aw − Ab = [∑
s
⎛ 1
n ws
n
1 ⎞
⎟⎟∑ ( Aws − Abs )α s (1 − α s )ns ]
As − ∑ bs As ] + [⎜⎜
+
nw
s nb
⎝ n w nb ⎠ s
The second term is a weighted average of black-white achievement differences within each school,
where αs equals the proportion of the black and white students in school s who are black and 1- αs
equals the proportion who are white. Notice that the weight for school s is neither proportional to
the school’s share of total enrollment of blacks or whites nor its share of enrollment in schools with
both blacks and whites. Rather the weight for school s depends non-linearly on both total
The appendix provides a derivation of this decomposition.
nb is the total number of black students, and nbs is the number of black students in school s, with parallel
definitions for white students (w).
9
10
9
enrollment and the distribution by race: schools with higher total enrollment and more equal
enrollment shares receive greater weight. Notice that in a decomposition based on equation (1) the
within school contribution in the above example with the single integrated school would approach
zero, meaning that essentially all of the differential would correctly be attributed to the
between-school component.
A. Different Views of Average Black-white Achievement Differences
Table 2 decomposes the black-white achievement gap into within- and between-school
components using the sample of students in the ECLS with a complete set of test scores and
applying the sampling weights relevant for students who participated in the five waves used in this
paper. 11 The top row shows that the overall gap begins at 5.4 points and increases by 2.5 points
during kindergarten, 4.4 points during first grade, 5.7 points during grades two and three, and by
1.4 points during grades four and five. Although the gap continues to widen through fifth grade, the
pace slows following first grade.
The second row shows that virtually all of the grade-to-grade increases in the overall gap
occur between schools. The increase in the between-school component accounts for 12.8 points out
of the total increase of 14 points throughout the period. Note that if we instead relied on the black
coefficient from a school fixed effect regression in the decomposition, the within-school
component would appear to increase by 11 points, accounting for almost 80 percent of the overall
gap during this period. 12
Table 3 reports mean scores for grades 3, 5, and 8 from the TSP data calculated over all
test-takers and over those who remain with their initial cohort for all grades. 13 (Note that these
Scores are scaled according to item response theory (IRT), permitting them to be equated across grades.
These calculations use the sampling weights from the survey (where the decomposition follows equation 1
based on weighted student counts for each school). Calculations not using the sampling weights are very
similar in both magnitude and pattern.
12
This is very similar to the pattern estimated by Fryer and Levitt.
13
We do not report all grades, because movement from elementary to junior high or middle school produces
a great deal of temporary test volatility in grades 6 and 7 that disappears within a year following the
transition.
11
10
Table 2. U.S. Average Black-white Math Test Score Gap from ECLS
(average white score minus average black score)
Overall
Between school
Within school
Race coefficient from
regression with school
fixed effects
Observations
blacks
whites
K (fall)
5.4
4.0
1.4
K (spring)
7.9
6.2
1.8
Grade
1
12.3
10.3
2.0
3
18.0
15.0
3.1
5
19.4
16.8
2.6
4.5
6.0
8.8
15.8
15.6
1,165
5,972
1,276
6,520
1,283
6,535
1,249
6,439
1,249
6,410
Note: Scores are calculated in ECLS according to Item Response Theory. Averages calculated with sample
weights to account for non-random aspects of sampling and attrition.
Table 3. Texas Average Black-white Math Test Score Gap from TSP
Overall
Between school
Within school
Observations
blacks
whites
3
0.59
0.19
0.39
87,941
336,948
intact cohort
grade
5
0.65
0.25
0.40
87,941
336,948
8
0.70
0.28
0.42
3
0.70
0.24
0.46
entire sample
grade
5
0.73
0.27
0.46
87,941
336,948
145,282
503,835
143,524
507,789
Note: Standardized test scores (mean=0, s.d.=1) from TAAS.
8
0.76
0.31
0.44
142,073
497,924
comparisons are calculated in terms of standard deviations, because no IRT scores are available for
the Texas tests). 14
A comparison of the gaps produced by the repeated cross sections (right panel) and the
sample of students with a complete set of test observations who progress with their class (left panel)
highlights the importance of grade retention, special program assignment, and other factors that
determine test taking patterns. The probability of grade retention and of special education
classification is higher for those in the lower portion of the achievement distribution, implying that
blacks in the complete cohort sample will tend be a more select group than whites in the complete
cohort sample. Across grades, the sample of blacks will tend to have been in school longer on
average than whites because of grade retention, and this works to narrow the black-white gap when
taken as a snapshot at a given grade level. Both the lower 3rd grade test score gap and larger increase
in the gap between 3rd and 8th grade for the complete cohort sample can be attributed to these
differences in grade retention and special education classification.
In the complete panel sample, the gap rises from 0.59 standard deviations at the end of 3rd
grade to 0.65 in 5th grade and to 0.70 in 8th grade. The pattern of achievement gap change is similar
to that observed in the ECLS. Not only does the yearly rate of increase diminish with age, but also
the between-school component accounts for over 75 percent of the change in the gap between third
and eighth grades (0.09 of the 0.11 total increase).
Although the purposeful sorting of families into communities and school districts means
that family and community factors contribute to the between school gaps, the patterns observed in
Tables 2 and 3 leave open the possibility that school quality differences account for much of the
rise in the racial achievement gap during the elementary and middle school years.
B. Differences by Initial Achievement
Tables 2 and 3 show that the growth in the average black-white achievement gap declines
Murnane, Willett, Bub, and McCartney (2005) suggest that the different units of analysis can affect the
results, but we have no way to deal with that issue here.
14
11
with age and occurs predominantly between schools, but an important question is whether the
changes are similar across the initial achievement distribution. Investigating such heterogeneity is
complicated by the fact that test scores measure actual knowledge with error, meaning that the
kindergarten or third grade scores are not perfectly correlated with knowledge. If students are
categorized by their initial scores and if test measurement errors are uncorrelated over time, those
placed in high achievement categories will tend to draw less positive errors in the subsequent year,
while those placed in the lower categories will tend to draw more positive errors in the subsequent
year. Consequently regression to the mean will account for a portion of the observed difference in
test score changes across categories.
Such regression to the mean also complicates black-white comparisons because of
differences in the actual initial skill distribution. Table 4 illustrates the general problem using a
stylized trivariate distribution of actual skill and measurement error that is randomly distributed
and does not differ by race. The top panel reports the assumed distributions of actual skill for blacks
and whites, where the distribution for blacks is more concentrated in the lower categories than the
distribution for whites. The bottom panel describes the resulting distribution of observed test
scores, where Pij is the probability that a student with true ability in category i is observed in
category j (e.g., PLH is the probability that someone with low ability will have an observed test score
in the high ability category). Comparison of the top and bottom panels shows that the observed test
score distributions distort the actual race differences in skill even with the assumption of random
measurement error distributions that do not differ by race. A higher proportion of whites than
blacks are misclassified into the lowest observed skill category, while the opposite is true for the
highest observed skill category. Such systematic misclassification leads to higher expected
achievement gains for whites than blacks throughout the distribution as a result of the regression to
the mean phenomenon.
The pattern illustrated in Table 4 invalidates the simple categorization of students on the
basis of initial test scores. To overcome this problem, we use a test in a different subject to
12
Table 4. Simulated Observed and Actual Test Score Distributions for Blacks and
Whites (Pij = probability of being actual category i but observed as category j)
Initial Actual Skill Distributions
Blacks
Whites
Observed Test distribution
Blacks
Low
Middle
High
Whites
Low
Middle
High
Low
0.4
0.2
Middle
0.4
0.4
High
0.2
0.4
0.4*PLL + (0.4*PML + 0.2*PHL)
0.4*PMM + (0.4*PLM + 0.2*PHM)
0.2*PHH + (0.4*PLH + 0.4*PMH)
0.2*PLL + (0.4*PML + 0.4*PHL)
0.4*PMM + (0.2*PLM + 0.4*PHM)
0.4*PHH + (0.2*PLH + 0.4*PMH)
categorize students by initial mathematics skill level, based on the assumptions of positive
correlations across subjects in true skill and of no correlation in the test measurement errors across
subjects. This scheme severs the link between initial category and expected difference in the error
realizations for the initial and subsequent periods.
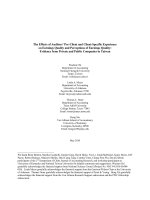
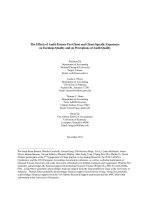
Table 5 and Figures 1 and 2 report changes with age in the overall and between-school
components of the black-white achievement gap in mathematics for the ECLS and TSP samples,
respectively. The ECLS sample is divided into six initial achievement categories on the basis of
kindergarten reading scores, and Table 5 shows that the black-white gap increases much more prior
to 3rd grade than between 3rd and 5th grade except for the highest category where the gap declines
following 1st grade and in the period as a whole. 15 Although the largest increase occurs in the
bottom category, the overall increase in the lower five categories does not vary much by initial
reading achievement. Finally, the bulk of the overall changes in all categories results from
between- rather than within-school changes.
Similar to the national trends from the ECLS for grades K thru 5, Figure 1 shows that
growth in the achievement gap for the TSP sample tends to be noticeably larger in the earlier grades
(3rd to 5th). 16 However, in contrast to the pattern observed in Table 5, Figure 1 reveals a pronounced
ordering in the magnitude of change by initial achievement categories, particularly following 5th
grade (solid bars). Between grades 5 and 8 the overall gap increases in only one of the seven bottom
categories and by only 0.01 standard deviations, while the gap increases by at least 0.05 standard
deviations in all but one of the next six groups and by at least 0.09 standard deviations in the top
three groups. For the grade span as whole, the gap increases by at least 0.25 standard deviations in
the top three groups, between 0.17 and 0.21 in five of the next 6 groups, and by less than 0.10 in the
seven lowest categories.
15
We use the spring kindergarten rather than the fall kindergarten test to divide students in the ECLS because
of the lack of dispersion in the fall kindergarten reading test distribution. The distribution of scores and
evolution of the racial achievement gaps by kindergarten reading category are found in Appendix Table a1.
16
Appendix Table a1 reports the overall and between school gaps for the TSP sample.
13
Table 5. U.S. Average Black-white Math Test Score Gap by Spring
Kindergarten Reading Test Score Category from ECLS
1
Overall
kindergarten
1st grade
3rd grade
5th grade
Spring Kindergarten reading test score category
2
3
4
5
6
2.2
5.7
14.9
16.8
3.6
6.4
12.8
14.1
4.9
7.8
15.1
15.7
6.1
9.7
13.0
13.3
5.4
13.7
15.6
15.6
8.2
10.4
9.4
6.6
Between School
kindergarten
2.3
1st grade
5.6
3rd grade
14.4
5th grade
16.1
3.0
5.5
10.8
11.9
3.8
6.2
12.8
13.1
5.4
8.1
11.0
11.0
5.3
13.2
14.6
14.7
7.4
9.2
8.6
6.6
Observations
blacks
whites
412
1,315
324
2,078
170
1,567
65
562
39
218
208
382
Notes: Students are categorized by kindergarten reading score. Scores are divided into 20 intervals of equal
length with results reported for categories with at least 30 blacks. (Because the IRT scaling spans all grades,
the top categories are not relevant for kindergarten). Cell sizes fluctuate slightly from grade to grade.
Figure 1. 3rd to 5th Grade and 5th to 8th Grade Changes in the Math
Achievement Gap by 3rd Grade Reading Category
0.20
Increase in b-w gap (s.d.'s)
0.15
0.10
3rd to 5th gap change
5th to 8th gap change
0.05
0.00
1
2
3
4
5
6
7
8
9
10
-0.05
-0.10
3rd Grade Reading Category
(lowest = 1, highest = 16)
11
12
13
14
15
16
Figure 2. Between School Changes in the Math Achievement Gap by 3rd Grade
Reading Category
0.20
Increase in b-w gap (s.d.'s)
0.15
0.10
3rd to 5th gap change
5th to 8th gap change
0.05
0.00
1
2
3
4
5
6
7
8
9
10
-0.05
-0.10
3rd Grade Reading Category
11
12
13
14
15
16
Similar to the pattern observed in the ECLS sample, Figure 2 shows that between-school
changes account for the bulk of the overall changes observed between 3rd and 5th grade in Texas
across the initial reading achievement distribution. However, following 5th grade there is a marked
divergence in the impacts of the between-school component by 3rd grade reading category. The
between-school gap actually declined in each of the bottom seven categories, and in six of the
seven this decline leads to a reduction in the overall differential despite offsetting changes in the
within-school component in most. In contrast, the between-school gap does not fall in any of the
remaining groups and tends to move in the same direction as the within-school changes.
Consequently the overall gap increases for students in the upper reading achievement categories,
though as previously noted the magnitude of the gap expansion following 5th grade tends to be
much smaller than the changes observed between grades 3 and 5.
C. Differences by Gender
The recent widening of the gender gap in high school and college completion, which is
particularly pronounced for blacks, raises the possibility of a gender differential in the evolution of
the elementary school achievement gap. Appendix Tables a2 and a3 report overall gender
differences for the ECLS and TSP samples, respectively, and Appendix Tables a4 and a5 report
gender differences by initial reading achievement.
The tables provide little or no evidence of differential patterns by gender, and particularly
no evidence of a sharp drop in the relative achievement of black boys during these grades. This
holds across the initial reading achievement distribution and for both total changes and the
within-and between-school components.
D. Nonrandom attrition and test taking
Nonrandom attrition from the samples of students with test results potentially complicates
the measurement of the black-white achievement gap including differences by gender in both the
ECLS and TSP data. Nonrandom sampling in follow-up surveys, race differences in special
education classification and grade retention, and other sources of missing test data have the
14
potential to distort achievement comparisons and understate academic difficulties experienced by
many students (as previously shown in Table 3).
The high rate of school transfers for blacks elevates the importance of sampling a
representative set of movers in the ECLS, and the test score pattern observed in Appendix Table a6
for students who remain in the sample for all five waves raises doubts that the ECLS succeeded in
procuring a 50 percent random sub-sample of movers in the follow-up surveys. 17 In contrast to
white movers whose average scores are slightly lower than those of stayers, blacks who move
between first and third grade score significantly higher on average than non-movers and those who
switch schools in other periods. This achievement pattern seems particularly unlikely, because the
2000 U.S. Census shows that average income, mother’s education, and the probability of living in a
two parent household were far lower for black children 6 to 8 years old who switched residences
within the previous year than for black children who did not move. 18 The ECLS pattern also differs
markedly from the pattern observed for public school switchers in Texas (see Appendix Table a7)
and suggests that its included black movers are a biased sample of all blacks who switched schools
during these grades. Moreover, the sampled black movers tend to realize substantial academic
gains with age relative to other blacks, in sharp contrast both to the whites in the ECLS and to
Texas movers who tend to lose ground relative to non-movers.
The apparent ECLS sampling difficulties highlight the value of being able to track school
switchers with administrative data, but such tracking does not insulate the TSP data from all causes
of nonrandom selection. As Texas public school students age the racial gap in remaining on grade
and having a test widens, particularly for boys. A substantially higher percentage of black than
white boys is retained in grade each year, and the race differential in the proportion of boys excused
from test taking due to special education classification exceeds ten percentage points (Appendix
The intent was to movers whose first language was English at a rate of 50 percent and other movers at a
slightly higher rate.
17
15
Table a8). Those excused from the test or retained score far lower on average than other students in
the previous year (see Appendix Table a9), meaning that the attrition from the test sample almost
certainly attenuates estimates of the achievement gap and its growth with age.
Clearly the test data provide only a partial measure of academic progress, and we attempt
to provide a more complete picture by describing the special education and retention patterns for
the entire elementary and middle school experience. Table 6 describes the joint distributions of
special education classification and retention by race and gender for grades K thru 8. Both retention
and special education classification are considerably higher for blacks, particularly for boys. By
middle school over one quarter of black boys receive special services, almost twice the rate for
white boys or black girls. In addition, the high failure rates, concentrated in grades one and seven,
highlight the lack of academic progress for many black boys.
In sum, the test score patterns and rates of special education and retention depict a sizeable
deficiency in academic progress for black girls and an even larger deficit for black boys. Although
the largest increases in the test score gap occur in the early school years, the nonrandom selection
out of the test sample would appear to lower the observed growth in the gap in later grades from
what it would be in the absence of such attrition. Moreover, the high rates of retention in the early
grades mean that many can quit school legally close to the beginning or even prior to the start of
high school, raising doubts that surveys of high school students provide a valid comparison of the
academic progress of blacks and whites.
4. School and Peer Effects on Achievement Gaps
A key issue is the extent to which specific teacher and school variables account for the
growth in the achievement gap during the school years. Although some recent studies including
Fryer and Levitt (2004) have not found that observed school factors account for much if any of the
growth in the achievement gap, these results are inconsistent with other research that highlights the
From the 2000 Census data, within state movers come, for example, from families with a single parent 60
percent of the time and 18 percent have less than a high school education. For nonmovers, the comparable
18
16
Table 6. Distribution of Texas Public School Students by Special Education and Grade Retention Status,
by Race, Gender, and Grade
Grade
Boys
Blacks
1. Not retained/not special education
2. Not retained/special education
3. Retained/not special education
4. Retained/special education
Whites
1. Not retained/not special education
2. Not retained/special education
3. Retained/not special education
4. Retained/special education
Girls
Blacks
1. Not retained/not special education
2. Not retained/special education
3. Retained/not special education
4. Retained/special education
Whites
1. Not retained/not special education
2. Not retained/special education
3. Retained/not special education
4. Retained/special education
1
2
3
4
5
6
7
8
78.9%
8.2%
10.2%
2.8%
80.9%
14.6%
3.5%
1.0%
77.8%
18.4%
2.9%
0.9%
75.5%
22.7%
1.4%
0.4%
73.4%
25.3%
0.9%
0.5%
71.4%
25.6%
2.4%
0.6%
70.1%
25.1%
3.9%
0.9%
72.5%
25.2%
1.7%
0.6%
80.5%
10.7%
0.2%
2.6%
83.0%
14.8%
1.4%
0.7%
81.4%
16.9%
1.1%
0.7%
11.2%
18.0%
0.5%
0.3%
80.9%
18.3%
0.5%
0.3%
80.9%
17.6%
1.1%
0.4%
80.6%
17.2%
1.7%
0.5%
82.0%
16.7%
0.9%
0.4%
86.9%
4.1%
7.7%
1.3%
90.0%
7.2%
2.6%
0.5%
88.1%
9.2%
2.3%
0.5%
87.0%
11.8%
1.0%
0.2%
85.4%
13.7%
0.6%
0.2%
84.3%
14.1%
1.3%
0.3%
83.6%
13.8%
2.4%
0.3%
85.3%
13.3%
1.1%
0.3%
88.5%
5.8%
4.3%
1.4%
90.5%
8.0%
1.1%
0.4%
89.6%
9.2%
0.9%
0.4%
89.6%
9.8%
0.4%
0.2%
89.6%
9.9%
0.3%
0.2%
89.7%
9.6%
0.6%
0.2%
89.6%
9.1%
1.0%
0.2%
90.6%
8.6%
0.6%
0.2%
significant effects of specific school and peer factors that clearly differ by race.
Our primary goal here is to assess whether schools have a discernible impact on the growth
of the racial achievement gap. At any grade, the white-black gap in average achievement ( ΔA ) can
be written in terms of underlying mean characteristics ( X ) of whites (w) and blacks (b), the
impacts of these (β) on achievement, and a stochastic term ( ε ) such as:
ΔA = A w − A b
(2)
= X w β w − X b βb + (ε w − ε b )
= ( X w − X b ) β w + ( β w − βb ) X b + (ε w − ε b )
If X i and β i , i ∈ {w, b} , are vectors of the mean characteristics affecting achievement
and their respective impacts on achievement, the white-black achievement gap can be decomposed
into a weighted difference in mean characteristics and a weighted difference in achievement impact
parameters along with mean stochastic terms, as shown in the last line of Equation (2). Assuming
that the expected value of the mean errors is zero, equation (2) highlights the fact that racial
differences in both characteristics and parameters contribute to the evolution of the
achievement gap. Importantly, if β w ≠ β b , achievement gaps can change over time even if
blacks and whites face the same average inputs within schools.
We pursue a conservative estimation strategy that concentrates on that portion of the
achievement variance that can be credibly related to the causal influence of specific school factors
previously shown to be significant determinants of achievement and that are distributed differently
by race. Consequently we ignore other factors such as school leadership that are likely distributed
more favorably for whites than blacks. Further, because the ECLS data offer virtually no chance of
identifying the causal impact of any of the school factors, we limit our analysis just to the Texas
data. This is unfortunate because the Texas analysis begins with grade 3 and thus does not include
the earlier grades where there are larger changes in achievement gaps.
figures are 40 percent and 12 percent, respectively.
17