Pension funds and economic crises A scenario generating approach to incorporate economic crises in the asset liability management methodology
Bạn đang xem bản rút gọn của tài liệu. Xem và tải ngay bản đầy đủ của tài liệu tại đây (620.26 KB, 54 trang )
Master of Science Thesis
Pension funds and economic crises
A scenario generating approach to incorporate economic crises in
the asset liability management methodology
B. Masselink, M.Sc.
June 20, 2009
Pension funds and economic crises
A scenario generating approach to incorporate economic crises in
the asset liability management methodology
Master of Science Thesis
For obtaining the degree of Master of Science in Finance at Erasmus
University Rotterdam
B. Masselink, M.Sc.
June 20, 2009
Erasmus School of Economics
·
Erasmus University Rotterdam
Copyright c B. Masselink, M.Sc.
All rights reserved.
Erasmus University Rotterdam
Department Of
Finance
The undersigned hereby certify that they have read and recommend to the Erasmus School
of Economics for acceptance a thesis entitled “Pension funds and economic crises” by
B. Masselink, M.Sc. in partial fulfillment of the requirements for the degree of Master
of Science.
Dated: June 20, 2009
Supervisor:
dr. O.W. Steenbeek
Readers:
Preface
Den Haag, June 20, 2009
Dear Reader,
This report is the result of the graduation research at the Rotterdam School of Economics of
the Erasmus University Rotterdam. For the last year the author was involved in the Finance
Group of this faculty, by following courses and participating in seminars.
The purpose of this research is to investigate the possibility of including economic crisis into
a scenario generating process used by the Asset Liability Management (ALM) approach of
pension funds. In order to develop such a scenario generating tool, historical economic data
are evaluated. The results of this analysis are used to generate economic scenarios using two
different models, one including economic crisis and one without these.
I would like to thank the staff of the Finance Group of the Rotterdam School of Economics
and the Erasmus Data Service Centre for all their support and the possibility to do most
of the research at home. Especially, I would like to thank dr. Onno W. Steenbeek for his
supervision.
I really enjoyed applying the control and simulation knowledge I learned at the Delft University of technology into the field of economics, especially into the field of pension funds and
risk monitoring.
Sincerely yours,
Bram Masselink
Prinsegracht 6D
2512 GA Den Haag
+31(0)6-1923 2562
M.Sc. thesis
B. Masselink, M.Sc.
vi
B. Masselink, M.Sc.
Preface
M.Sc. thesis
Abstract
The possibility of implementing economic crisis into the generation of economic scenarios using
Vector AutoRegressive (VAR) models is studied. This allows pension funds using the Asset
Liability Management (ALM) approach to get insight into risks associated with economic
downturn. The economic scenarios are generated using two separate algorithms, one for the
generation of good and one for bad times. These two are combined to create a scenario
which includes economic crisis. This method is compared to a traditional method long term
economic dynamics. The purpose of this thesis is to prove that the method introduced can
be used, and not to gain a better insight into the risk profile of an individual pension fund
The approach discussed in this thesis is a simplified ALM model, which does not incorporate
demographic models and incorporates an investment space consisting of stocks and bonds
only with different maturity. Despite these limitations, the results clearly demonstrate that it
is possible to incorporate economic crisis into ALM models and therefore get a better insight
in the pension fund risk profile.
viii
B. Masselink, M.Sc.
Abstract
M.Sc. thesis
Table of Contents
Preface
v
Abstract
vii
1 Introduction
1
2 Theory
5
2-1 Defined benefit vs. defined contribution . . . . . . . . . . . . . . . . . . . . . .
2-2 Asset liability management . . . . . . . . . . . . . . . . . . . . . . . . . . . . .
5
6
2-3 Business cycles and frequency domain analysis . . . . . . . . . . . . . . . . . . .
8
2-4 Stochastic programming vs. scenario analysis . . . . . . . . . . . . . . . . . . .
11
2-5 Including economic dynamics . . . . . . . . . . . . . . . . . . . . . . . . . . . .
12
3 Data and methodology
15
3-1 Data . . . . . . . . . . . . . . . . . . . . . . . . . . . . . . . . . . . . . . . . .
3-2 Methodology . . . . . . . . . . . . . . . . . . . . . . . . . . . . . . . . . . . . .
15
17
3-2-1
Step 1: Analyzing historical data . . . . . . . . . . . . . . . . . . . . . .
17
3-2-2
Step 2: Generating economic scenarios . . . . . . . . . . . . . . . . . . .
18
3-2-3
Step 3: Calculating cash outflows . . . . . . . . . . . . . . . . . . . . .
20
3-2-4
Step 4: Determining asset returns . . . . . . . . . . . . . . . . . . . . .
22
3-2-5
Step 5: Calculating funding ratio . . . . . . . . . . . . . . . . . . . . . .
22
3-2-6
Step 6: Evaluating results . . . . . . . . . . . . . . . . . . . . . . . . . .
22
3-2-7
Initial conditions and assumptions . . . . . . . . . . . . . . . . . . . . .
23
4 Results and discussion
4-1 Liabilities . . . . . . . . . . . . . . . . . . . . . . . . . . . . . . . . . . . . . . .
4-2 Assets . . . . . . . . . . . . . . . . . . . . . . . . . . . . . . . . . . . . . . . .
4-3 Funding ratio . . . . . . . . . . . . . . . . . . . . . . . . . . . . . . . . . . . .
25
25
26
26
M.Sc. thesis
B. Masselink, M.Sc.
x
Table of Contents
5 Conclusions and recommendations
5-1 Conclusions . . . . . . . . . . . . . . . . . . . . . . . . . . . . . . . . . . . . .
5-2 Recommendations . . . . . . . . . . . . . . . . . . . . . . . . . . . . . . . . . .
5-2-1 Depth . . . . . . . . . . . . . . . . . . . . . . . . . . . . . . . . . . . .
31
31
32
32
5-2-2 Width . . . . . . . . . . . . . . . . . . . . . . . . . . . . . . . . . . . .
5-3 Concluding remarks . . . . . . . . . . . . . . . . . . . . . . . . . . . . . . . . .
33
33
References
References . . . . . . . . . . . . . . . . . . . . . . . . . . . . . . . . . . . . . . . . .
35
35
B. Masselink, M.Sc.
M.Sc. thesis
List of Figures
1-1 Major stock market performance, source: OECD . . . . . . . . . . . . . . . . . .
2
1-2 Importance of pension funds relative to the size of the economy . . . . . . . . .
3
2-1 ALM approach: scenario analysis . . . . . . . . . . . . . . . . . . . . . . . . . .
7
2-2 Example observation of a filtered 100 seconds signal . . . . . . . . . . . . . . . .
9
2-3 Stochastic programming vs. scenario creation . . . . . . . . . . . . . . . . . . .
11
2-4 Example of average return of different scenario generating processes . . . . . . .
13
3-1 Historical data . . . . . . . . . . . . . . . . . . . . . . . . . . . . . . . . . . . .
3-2 Historical average yield curve based on Nelson Siegel formula . . . . . . . . . . .
15
17
3-3 VAR approach to incorporate crisis . . . . . . . . . . . . . . . . . . . . . . . . .
19
3-4 Nominal expected cash outflows as fraction of total cash outflow . . . . . . . . .
21
4-1 Pension fund liabilities . . . . . . . . . . . . . . . . . . . . . . . . . . . . . . . .
4-2 Average pension fund assets . . . . . . . . . . . . . . . . . . . . . . . . . . . .
25
26
4-3 Average monthly stock returns and stock prices . . . . . . . . . . . . . . . . . .
27
4-4 Average funding ratio . . . . . . . . . . . . . . . . . . . . . . . . . . . . . . . .
27
4-5 Cross section of the average fund ratios . . . . . . . . . . . . . . . . . . . . . .
29
4-6 Probability of being under a certain funding ratio . . . . . . . . . . . . . . . . .
30
4-7 Standard deviation of the funding ratio . . . . . . . . . . . . . . . . . . . . . . .
30
M.Sc. thesis
B. Masselink, M.Sc.
xii
B. Masselink, M.Sc.
List of Figures
M.Sc. thesis
List of Tables
2-1 Pension fund balance sheet . . . . . . . . . . . . . . . . . . . . . . . . . . . . .
7
3-1 Data characteristics. Yearly returns and monthly standard deviation. . . . . . . .
16
3-2 Data characteristics. Nelson Siegel parameters. . . . . . . . . . . . . . . . . . .
17
3-3 Autoregressive parameter matrices . . . . . . . . . . . . . . . . . . . . . . . . .
20
3-4 Autoregressive noise matrices . . . . . . . . . . . . . . . . . . . . . . . . . . . .
21
3-5 Pension fund investment mix . . . . . . . . . . . . . . . . . . . . . . . . . . . .
23
4-1 Funding ratio characteristics . . . . . . . . . . . . . . . . . . . . . . . . . . . .
28
M.Sc. thesis
B. Masselink, M.Sc.
xiv
B. Masselink, M.Sc.
List of Tables
M.Sc. thesis
Chapter 1
Introduction
”The ongoing financial crisis has dealt a heavy blow to private pension systems. Between
January and October this year [2008, ed.], private pensions in the OECD area have registered
losses of nearly 20% of their assets (equivalent to USD 5 trillion).” While the same article,
(Yermo & Salou, 2008), states that ”Although the short-term impact is evidently negative,
pension funds, by their very nature, have to work with a long time horizon and their performance should also be evaluated on this basis. If one looks at returns over the last fifteen years
up to October 2008 - a positive picture still emerges. For example, the average, annual real
rate of return of pension funds was 8.5% in Sweden, and 6.1% in the United-States and the
United Kingdom over this period.” So the question rises how to evaluate pension funds on
the long term, while surfiving short term fluctuation in the funding ratio.
The trade-off between long term gains and short term losses should be made carefully, while
anticipating future adjustments of the policy, (Kouwenberg, 2001).
Financial institutions own vast amounts of financial assets and liabilities and are therefore
subject to changes in market values as stock prices and interest rates vary. But, not only
financial institutions are subject to changes in valuations of assets and liabilities, other corporations as well. These institutions and corporations (should) use models to evaluate their
investment strategies and risk profiles.
The institutions that use models are diverse and use them for different reasons. For example
airlines use them to evaluate their risk profile with respect to fuel prices, banks mainly look
at macroeconomic developments, credit risk and interest rate risks, hedge funds mainly look
for investment opportunities. Pension funds on the other hand are interested in their policy
decisions and investment mix and how they can mitigate interest rate, longevity, interest, and
market risks.
A common used method to evaluate risks is Value at Risk (VaR). VaR estimates the probability and the amount of impact of certain risk factors and combines these to result in a
currency amount of risk with a certain probability in a (part of) a portfolio. More details
with respect to the VaR methodology can be found in (Duffie & Pan, 1997), (Jorion, 1997)
and (Rockafellar & Uryasev, 2000). VaR is a straight forward method to evaluate risks which
M.Sc. thesis
B. Masselink, M.Sc.
2
Introduction
can be applied (to parts of) the portfolio. Asset Liability Management (ALM), on the other
hand, is a holistic approach to evaluate implications on the complete portfolio of assets and
liabilities. More details with respect to ALM will be given in the next chapter.
The different purposes of these economic models result in different requirements of the models
in terms of variables and time horizon. Some models only look at market and/or individual
stock price expectations. While others look at a macroeconomic level. This thesis focuses on
macroeconomic scenario generating models, and how these models can incorporate sudden
events like economic crises. These scenarios will be used in the ALM approach for pension
funds. Currently, the main method of incorporating economic dynamics into the scenario
generating process is by higher order Vector AutoRegression VAR(p)1 models and by the use
of spectral analysis, as will be discussed in the next chapter.
The ALM approach discussed in this thesis will provide pension fund stakeholders a better
overview of the implications of economic crises. In contrast to traditional VAR models the
proposed method includes a crisis in each of the generated macroeconomic scenario. By
including this crisis in the ALM approach the effect of possible crisis can be evaluated.
To create economic scenarios, first the past is evaluated while the future is expected to have
the same characteristics.2 This might be a good starting point, while on the other hand
investment commercials in the Netherlands should accompany the following warning: Results
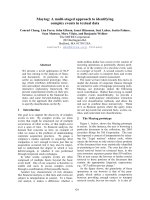
obtained in the past are no guarantee for the future. For example, Figure 1-1 shows the major
stock market performance since 1993. It can be clearly seen that there exist significant long
term up and downward movement in the market.
Figure 1-1: Major stock market performance, source: OECD
There is also a practical issue; what to do with exceptional periods in the past like economic
crises? One way to summarize the past performance is the average and the standard deviation
of the results of the past over a long period including these exceptional periods. Another
1
2
Note the difference between the Value at Risk (VaR) and Vector AutoRegression (VAR)
Details with respect to the creation of these economic scenarios will be given in Section 3-2
B. Masselink, M.Sc.
M.Sc. thesis
3
common used method is the ignore these exceptional periods and mark them as ’outliers’.
Both methods have obvious drawbacks;(1) This assumes that these sub sequential periods
of economic downturn will not occur in the future, while one would expect that the average
result in the future is influenced by these exceptional periods. Method (2) assumes that the
future will be without corrections and only consists of ’good’ periods. A third method is to
incorporate cycles, such as seasonal effects and business cycles by using spectral analysis as
will be discussed in Section 2-3.
According to (IMF, 2004) the role of pension funds increases in importance: ”The growth of
funded pension and the growing emphasis on risk management should strengthen the role of
pension funds as stable, long-term institutional investors.”
Figure 1-2: Importance of pension funds relative to the size of the economy in OECD countries
(2007), source: OECD
In 2007 Dutch pension assets amount to about e770 billion, according to (CBS, 2009),
equal to about 132% of the GDP, see Figure 1-2. Thus 3% more returns on assets results in more than 4% increase in GDP, which equals to about 8% of the national salaries,
(Boender, Dert, Heemskerk, & Hoek, 2007). It can be concluded that the stakes are high,
resulting in governance, justification, transparancy, efficiency, supervision and accountability
of pension management are becoming more and more important.
M.Sc. thesis
B. Masselink, M.Sc.
4
Introduction
A lot of research has been done in the field of portfolio optimization, for example determining
the mean variance global solution portfolio, like (Huberman, Kandel, & Stambaugh, 1987)
and (Fama, 1965). For example (Detemple, Garcia, & Rindisbacher, 2003) proposed a new
simulation based approach for optimal portfolio allocation in realistic environments including
complex dynamics and many state variables, using a Monte Carlo method.
Another interesting field of the ALM method, when applied to pension fund investment
strategies, is the use of derivatives for hedging purposes. For example (Palin & Speed,
2003) discuss work in progress with respect to hedging the pension funds funding ratio.
(Schotman & Schweitzer, 2000) show that stocks can be used as an inflation hedge even if
the stock returns are negatively correlated with unexpected inflation shocks, depending on
the investment horizon. Or (Engel, Kat, & Kocken, 2005) who studied how derivatives can
hedge interest rates.
However it should be noted that the portfolio optimization and the use of derivatives is beyond
the scope of this thesis, as the main purpose of this thesis is introducing a new methodology
of generating economic scenarios and its implications of the ALM approach at pension funds.
To prove the usability of this method a simplified ALM model is built.
The next chapter will discuss the theory of the ALM approach and how to incorporate business
cycles and other dynamics. Different aspects with respect to stochastic programming using
event trees and linear scenario generation will be elaborated on in the same chapter. Chapter 3
discusses the data used and the methodologies applied. Special interest is applied to ALM
model and the scenario generating process. The results of this new method can be found in
Chapter 4, and finally the conclusions and recommendations can be found in Chapter 5
B. Masselink, M.Sc.
M.Sc. thesis
Chapter 2
Theory
The theory discussed in this thesis can divided into several sub parts and is covered in this
chapter. First, the theory on different pension schemes is discussed in Section 2-1. After that,
the Asset Liability Management (ALM) method and the differences between business cycles
and economic shocks are discussed in Section 2-2 and Section 2-3, respectively. Section 2-4
compares the the stochastic programming method to the scenario analysis method. Finally,
the economic scenario generating method incorporated in this thesis is discussed in Section 2-5.
2-1
Defined benefit vs. defined contribution
National pension systems are typically represented by a multi-pillar structure, with different
sources of retirement income like the government, employment and individual savings. The
definitions of these pillars differs across academic literature, the following division can be found
in (IMF, 2004); in pillar 1 the state is the source of retirement income, often a combination
of universal entitlement and a component related to earning. Occupational pension funds
are the main source of income in pillar 2. Finally, pillar 3 consists of private savings and
individual financial products.
The relative importance of the contributions of pillars 1, 2, and 3 differ significantly from
country to country. In the Netherlands pillar 1 contributes to about 50 percent of the retirement income and the other half consists of pillars 2 and 3, source (IMF, 2004). Currently,
the Dutch pillar 1 is constructed as a pay as you go (PAYG) system, which is increasing the
pressure on the working class due to the aging population.
Pillar 2 consists of the retirement saving built up during occupation and can be separated into
defined benefit and defined contributions schemes, or a combination of these schemes, hybrid
plans. Defined benefit (DB) schemes are those in which the employer commits to provide
specific benefits related to individual wages and length of employment, while under defined
contribution (DC) plans the commitment is to make specific contributions to a pension fund,
where benefits depend on the level of contributions to the scheme and the investment return.
In the Netherlands about 95% of pillar 2 consists of DB schemes.
M.Sc. thesis
B. Masselink, M.Sc.
6
Theory
One of the main differences between the DB and DC schemes from a employers perspective is
the risk involved. In a DB plan the employer bears all the risks while in a DC plan the lower
investment returns mean lower pension payments for the employees. For more information on
pension schemes see (Ambachtsheer & Ezra, 1998), (Davis, 1994), (Modigliani & Muralidhar,
2004) and (Muralidhar, 2001).
2-2
Asset liability management
During the 2001-2005 period stock returns were falling and the interest rates were
low resulting in a deterioration of the financial position of many pension funds,
(Bauer, Hoevenaars, & Steenkamp, 2005). Regulations changed and more transparency was
demanded by the participants of the pension plans. One of the consequences was that not
only the assets, but also the liabilities were valued using fair valuation.
The purpose of the ALM approach consists of two parts; (1) to provide quantitative insight
in the results of interaction of assets and liabilities over a certain evaluation period. And
(2) to identify strategies to obtain an efficient policy mix. Important research with respect
to ALM research can be found in (Boender, 1995), (Boender, Aalst, & Heemskerk, 1998),
(Dert, 1995), (Mulvey, 1994), (Mulvey, 1996), (Mulvey, 2000), (Ziemba & Mulvey, 1998) and
(Ziemba, 2003).
Most pension funds use the ALM methodology to study the effect of the investment, contribution and indexation decisions, the pension deal, for all stakeholders. These stakeholders are
not only the retired, current and old employees, but also the employer and future generations.
ALM is not only interesting for pension funds, but to all institutions with long term assets
and liabilities like banks and insurance companies.
The ALM approach is an iterative process in which economic scenarios are generated using
assumptions and data with respect to financial markets, participants and the company. These
economic scenarios enter the pension funds company model, taking into account the ALM
strategy and the pension deal, resulting in a score1 of the pension deal with respect to the
individual economic scenario. By evaluating a lot of (>1000) economic scenarios, the pension
deal and ALM strategy can be evaluated and adjusted. This iterative process is shown in
Figure 2-1, (Boender et al., 2007). The details of the scenario generating process introduced
in this thesis can be found in Chapter 3.
In the ALM approach the policy makers try to influence the future balance sheet of the
pension fund. The balance sheet consists on assets (A) on one side and liabilities (L) and the
surplus2 (S) on the other side, see Table 2-1. The surplus can be calculated by L − A, the
funding ratio is defined as 1 + S/L. As usually, the balance sheet is analysed on a liquidation
basis, which means that only current assets and liabilities are taken into account3 .
The assets of the pension fund is the investment portfolio consisting of stocks, bonds, TBills, real estate, alternative investments, derivatives, etc.. The liabilities of a pension fund
1
An economic scenario can be scored on basis of several variables like contributions, indexation, underfunding period, etc.. The scoring method depends on the relative importance to the different implications of the
policy decisions defined by the board of the pension fund.
2
or deficit as occurs more and more often nowadays
3
Valuation on going concern is an alternative method which also takes future pension contributions (assets)
and future pension payments (liabilities) into account
B. Masselink, M.Sc.
M.Sc. thesis
2-2 Asset liability management
7
Management
Data:
Financial
Markets
Participants
Assumptions:
Financial
Markets
Company
Results
Scenario
Generation
Optimization
Range of
scenarios
Constraints
Norms
ALM strategies
Corporate model
Scenario-scores on ALM-criteria
wrt objectives / contstraints
Figure 2-1: ALM approach: scenario analysis
are calculated by discounting the expected pension payments, and possibly other liabilities.
These future assets and liabilities are calculated by using stochastic scenarios to construct
probability distributions.
Table 2-1: Pension fund balance sheet
Balance sheet
Assets (A)
Surplus (S)
Liabilities (L)
The surplus depends on the assets and liabilities of the pension fund, which in turn are
influenced by policy decisions and exogenous actuarial and economic factors. The policy
decisions are for example the contributions, indexation and investment policy. Examples
of exongenous factors are the inflation, interest rates, stock market returns, and the life
expectancy of the participants.
The paper of (R. P. M. M. Hoevenaars, Molenaar, Schotman, & Steenkamp, 2007) discusses
a long term investor with and without risky assets, subject to inflationary and interest rate
risks. Hoevenaars et al. show that there are differences in the global minimum variance and
liability hedge portfolio for the availability of alternative asset classes.
Besides the fact that liabilities alter the investment strategy, also the investment horizon alters
the optimal portfolio. For example equity is less riskier in the long run than in the short run,
M.Sc. thesis
B. Masselink, M.Sc.
8
Theory
according to (Campbell & Viceira, 2002). The time effect should also be incorporated into
the ALM approach as this interacts with liabilities.
The influence of the pension deal to risk sharing and wealth transfers between young and old
participants, generational accounting, is also studied using ALM analysis, like for example
(Ponds, 2003). The subject of generational accounting is beyond the scope of this thesis.
2-3
Business cycles and frequency domain analysis
The objective of the scenario generating process is summarized by the definition given by
(Bunn & Salo, 1993) who stated that a scenario is a possible evolution of the future that
should be consistent with a clear set of assumptions. The clear set of assumptions is often
translated to the empirical behavior of the economic variables which should resemble the
past. This statement included some difficulties as to which behavior4 , and which interaction
between economic variables should be taken into account, (R. P. M. M. Hoevenaars, 2008).
Common used methods to generate these scenarios is by the use of Vector AutoRegressive
(VAR) models.The simplest form of a AutoRegressive (AR) model is the univariate first order
AR(1) model;
xt = v + β1 xt−1 + εt
where
εt N (0, σ 2 )
(2-1)
in which all variables are scalers ans v is a constant term and β the autoregressive parameter.
The last term, ε is white noise with is assumed to be a Normal distribution;
E(εt ) = 0
E(ε2t ) = σ 2
E(εt εt−k ) = 0
(2-2)
for
k=0
If we extend the univariate AR(1) to a multidimensional equation, we obtain a VAR model.
And if not only period t − 1 is included we obtain a VAR(p) model of order p;
xt = v + A1 xt−1 + A2 xt−2 + · · · + Ap xt−p + εt
(2-3)
in which the underlined variables represent 1 × n vectors and the A is the autoregressive
parameter matrix of n×n which combines the auto and cross covariance relationships between
the economic variables.
In the article of (Campbell, Chan, & Viceira, 2003), the authors emphasize the importance
of the cross covariance variables of the VAR model. Especially for the long term investors,
like pension funds, the interaction of the economic variables cannot be ignored.
”Economic variables like GDP growth, employment, interest rates and consumptions show
signs of cyclical behavior. Many variables display multiple cycles, with lengths ranging between five up to hundred years.” (Groot & Franses, 2008) argue that ”multiple cycles can be
associated with long-run stability of the economic system, provided that the cycle lengths are
such that interference is rare or absent”
4
The question is ”how is the behavior described?” is it just the mean and variance, or should cycles taken
into account as well? And what about skewness and kurtosis?
B. Masselink, M.Sc.
M.Sc. thesis
2-3 Business cycles and frequency domain analysis
9
By using higher order VAR models, dynamics in the economic system can be included as there
is a clear interaction of the state of the economy in the past (xt−k ) and the current state of
the economy (xt ) by the term Ak . The parameters in the model are v and p × A, so the
amount of variables in the model equals n + n × n × p. This means that a lot of data is needed
to estimate the parameters accurately. Therefore this is an impractical way of including long
term dynamics in the process of generating economic scenarios.
Another way to study stochastic signals is spectral analysis, a widely used technique in physical engineering. Instead of observing a signal as a value at each time step, the signal is studied
by their characteristics at each frequency. In fact the signal is observed in the frequency domain instead of the time domain.
Fourier showed that any mathematical function can be written as an infinite sum of sines and
cosines;
∞
(Ak cos(kαx) + Bk sin(kαx))
f (x) =
(2-4)
k=0
When transforming a stochastic signal using Fourier transformation a phase and amplitude
is obtained for all frequencies ranging between 1/(observation time) and 1/(2 x time steps).
For example, suppose that we have observed a signal for 100 seconds with time steps of 1
second. This means that we have 100 data points. If a Fourier transformation is applied, 50
1
1
frequencies between 0.01 Hz ( 100s
) and 0.50 Hz ( 2·1s
)can be observed, but at each frequency
we have amplitude and phase information. This adds up to 100 data points as well. This
means no detail is lost in this transformation as with averaging or filtering.
Figure 2-2(a) shows the values of two signals for 100 seconds sampled at 1 Hz. The red line
is a random generated signal for which the signal is white noise for t → ∞ with σ 2 = 1. The
blue line is constructed by filtering the same signal with a second order low-pass filter5 .
3
0.5
random
filtered
2
|Y (f )|
signal
1
0
-1
0
0.3
0.2
0.1
-2
-3
random
filtered
0.4
20
40
60
time [s]
80
100
(a) Random noise and filtered signal
0
0
0.1
0.2
0.3
Frequency [Hz]
0.4
0.5
(b) Fourier transform of the random noise and filtered signal
Figure 2-2: Example observation of a filtered 100 seconds signal
The Fourier transformation of these two signals can be found in Figure 2-2(b). As you can
see, the power of the white noise is evenly distributed among all frequencies. While for the
filtered signal, the power reduces for higher frequencies.
5
The transfer function used for this filter is H(s) =
M.Sc. thesis
1
s2 +s+1
B. Masselink, M.Sc.