Inflation And Economic Growth Nexus In The Southern African Development Community: A Panel Data Investigation
Bạn đang xem bản rút gọn của tài liệu. Xem và tải ngay bản đầy đủ của tài liệu tại đây (587.38 KB, 92 trang )
INFLATION AND ECONOMIC GROWTH NEXUS IN THE
SOUTHERN AFRICAN DEVELOPMENT COMMUNITY:
A PANEL DATA INVESTIGATION
by
Monaheng Seleteng
Submitted in partial fulfilment of the
requirements for the degree
PhD (Economics)
in the
Faculty of Economic and Management Sciences
at the
University of Pretoria
2012
© University of Pretoria
Declaration
“ I declare that the thesis, which I hereby submit for the degree PhD (Economics) at
the University of Pretoria, is my own work and has not previously been submitted by
me for a degree at another university.”
ii
ACKNOWLEDGEMENTS
First and foremost, I would like to thank the All Mighty God for seeing me through
this journey. I would also like to convey my sincere gratitude to a number of people
and some institutions without whose contributions this thesis would not have been
successfully completed. I wish to thank my supervisor and co-supervisor, Dr. Manoel
Bittencourt and Prof. Reneé van Eyden, respectively, for having provided guidance,
support and patience ensuring a successful completion of the thesis. I highly
appreciate their contributions and comments.
I would also like to thank my employer, the Central Bank of Lesotho, for allowing me
to pursue my studies and also for their financial support throughout the four years of
my study leave. I would also like to thank my colleagues at the Research
Department of the Central Bank of Lesotho due to their sacrifices of taking over my
duties and responsibilities during the entire period of my study leave, I am humbly
thankful to them. I am also thankful to the academic staff and my fellow classmates
at the Department of Economics for their valuable comments throughout the years. I
would also like to thank the Economics Society of South Africa (ESSA) for giving me
an opportunity to present one of the papers in their conference. Furthermore, I would
like to thank Economic Modelling for accepting and publishing one of the chapters of
the thesis.
Furthermore, I am grateful to my wife and son, ‘Matlotliso and Tlotliso, respectively
for unwavering encouragement, unconditional support, and for believing in me at all
times and also for their sacrifices despite the little attention they received during this
work. I also wish to extend my thanks to my mother, sister, brother and mother-inlaw for their moral support at all times.
iii
ABSTRACT
Inflation and Economic Growth Nexus In The
Southern African Development Community:
A Panel Data Investigation
by
Monaheng Seleteng
Supervisor
:
Dr. Manoel Bittencourt
Co-Supervisor:
Prof. Reneé van Eyden
Department
:
Economics
Degree
:
PhD (Economics)
The aim of the thesis is to examine the relationship between inflation and economic
growth using the Southern African Development Community (SADC) as a case
study. The motivation emanates not only because of the lack of studies analysing
this relationship in the SADC region, but also due to the fact that this relationship
may differ from the one that exists in developed countries due to the level of
economic development and prudent macroeconomic policies being practised in the
latter (Sarel, 1996). The relationship may differ because the vast majority of
developed countries have established independent central banks with a clear
mandate to keep inflation levels within a specific range (adopted an inflation
targeting framework). However, in most developing countries, central banks do not
have a clear inflation targeting monetary policy framework, for instance, in the SADC
region, only South Africa has adopted an inflation targeting monetary policy
framework. High inflation episodes are known to contribute to macroeconomic
instability, therefore policy makers find it important to understand the kind of the
iv
relationship that exists between inflation and economic growth in order to develop
and implement sound macroeconomic policies. Therefore, inflation is viewed to be
one of the basic indicators of macroeconomic stability; hence it is an indicator of the
ability of the government to manage the economy. High levels of inflation may be
indicative of a lack of sound governance by the monetary authority of a country. In
addition, it is a sign of government that has lost control of its finances (Fischer,1993).
The thesis addresses issues of nonlinearities in the inflation-growth nexus by
endogenously estimating the threshold level of inflation below which inflation may
have no, or positive, impact on economic growth, or above which inflation may be
detrimental to economic growth. It also assesses the effects of a shock to inflation in
South Africa, being the largest economy in the region, on inflation and economic
growth of the rest of the region.
First, different panel data methodologies; Fixed Effects (FE), Difference Generalised
Method of Moments (DIF-GMM), System Generalised Method of Moments (SYSGMM), and Seemingly Unrelated Regression (SUR) estimators are used in order to
examine the relationship between inflation and economic growth in the region.
Second, Panel Smooth Transition Regression (PSTR) methodology is utilised to
examine the nonlinearities in the inflation-growth nexus. In particular, the threshold
level of inflation is endogenously estimated and the smoothness of the transition
from a low to a high inflation regime in the region is also estimated1. Thirdly, the
effects of South African inflation on the inflation and economic growth in the rest of
the region are assessed using impulse-response functions derived from estimating a
Panel Vector Autoregression (PVAR) model. Overall, the study deals with problems
which are normally encountered when using cross-country data such as
endogeneity, heterogeneity and cross-sectional dependence.
The main findings of the study are that inflation and economic growth in the region
are negatively related, as is also the case in other regions of the world as depicted
by the empirical literature (Fischer, 1993 and De Gregorio, 1993). Therefore, in
terms of the inflation-growth link, the SADC region is not different from all the other
1
Published in Economic Modelling
v
regions around the globe. Secondly, the threshold level of inflation in the region is
estimated at 18.9 per cent, which is in line with the findings of authors like Drukker et
al. (2005), Mignon and Villavicencio (2011), and Ibarra and Trupkin (2011), who
found a threshold level of 19.2 per cent, 19.6 per cent, and 19.1 per cent for
developing countries. However, this threshold level marginally exceeds that of Khan
and Senhadji (2001), Schiavo and Vaona (2007), Moshiri and Sepehri (2009) and
Espinoza et al. (2010), which studies report threshold values between 10 and 12 per
cent for developing countries. The empirical results also reveal that shocks to South
African inflation have significant economic impact on inflation, openness, investment
and economic growth in the rest of the SADC region. In particular, more interestingly,
South African inflation is found to have a negative and statistically significant impact
on economic growth in the region for up to about 12 years after the shock, after
which, it becomes insignificant.
The contribution of the thesis to the literature is that, firstly, this looks into the
inflation-growth relationship in the context of Africa, in particular the SADC region; as
such an investigation or research has not been conducted before. Secondly, the
research takes advantage of panel data methodologies so as to provide more robust
estimates and confront the potential bias emanating from problems such as
endogeneity, heterogeneity and cross-country dependence that may have affected
previous empirical work on inflation-growth nexus. This is believed to provide more
informative estimates on the inflation-growth link, and therefore deepens our
knowledge of the region.
vi
TABLE OF CONTENTS
CHAPTER ONE ......................................................................................................... 1
BACKGROUND AND INTRODUCTION..................................................................... 1
1.1 INTRODUCTION .................................................................................................. 1
1.2 HISTORY AND OBJECTIVES OF SADC............................................................. 2
1.3 SADC ECONOMIC PERFORMANCE .................................................................. 4
1.4 PROBLEM STATEMENT ..................................................................................... 8
1.5 OBJECTIVE OF THE STUDY ............................................................................ 10
1.6 CONTRIBUTIONS OF THE STUDY .................................................................. 11
1.7 OUTLINE OF THE STUDY ................................................................................ 12
CHAPTER TWO ....................................................................................................... 14
INFLATION AND ECONOMIC GROWTH NEXUS IN THE SADC
A PANEL DATA INVESTIGATION ........................................................................... 14
2.1 INTRODUCTION AND MOTIVATION ................................................................ 14
2.2 LITERATURE REVIEW ...................................................................................... 16
2.3 DATA DESCRIPTION ........................................................................................ 18
2.4 METHODOLOGY ............................................................................................... 22
2.4.1
Unit Root Testing .................................................................................. 23
2.4.2
Fixed Effects Estimator ......................................................................... 24
2.4.3
Difference and System GMM Estimators .............................................. 25
2.4.4
Seeminlgy Unrelated Regression (SUR) Estimator .............................. 26
2.5 EMPIRICAL RESULTS ...................................................................................... 27
2.5.1
Regression Results from Annual Data .................................................. 27
2.5.2
Diagnostic Tests Results ...................................................................... 32
2.6 CONCLUSION ................................................................................................... 33
CHAPTER THREE ................................................................................................... 35
NON-LINEARITIES IN INFLATION-GROWTH NEXUS IN THE SADC REGION: A
PANEL SMOOTH TRANSITION REGRESSION APPROACH ................................ 35
3.1 INTRODUCTION ................................................................................................ 35
vii
3.2 LITERATURE REVIEW ...................................................................................... 36
3.3 METHODOLOGY AND DATA ............................................................................ 41
3.3.1
Panel Smooth Transition Regression Model......................................... 41
3.3.1.1 Testing for Linearity .............................................................................. 43
3.3.1.2 Testing for the Number of Transition Functions .................................... 45
3.3.2
The Data ............................................................................................... 45
3.4 EMPIRICAL RESULTS ...................................................................................... 49
3.4.1
Linearity and No Remaining Non-Linearity Results .............................. 49
3.4.2
Model Estimation Results ..................................................................... 50
3.5 CONCLUSION ................................................................................................... 53
CHAPTER FOUR ..................................................................................................... 55
EFFECTS OF SOUTH AFRICAN INFLATION ON THE SADC REGION:
A PANEL VECTOR AUTOREGRESSION APPROACH .......................................... 55
4.1 INTRODUCTION ................................................................................................ 55
4.2 LITERATURE REVIEW AND STYLIZED FACTS............................................... 57
4.2.1
Inflation and Economic Growth Trends in the SADC Region ................ 57
4.2.2
Trade Flows Within the Region............................................................. 59
4.2.3
Literature Review .................................................................................. 62
4.3 METHODOLOGY AND DATA ............................................................................ 64
4.3.1
The Data ............................................................................................... 64
4.3.2
Unit Root Testing .................................................................................. 64
4.3.3
Panel Vector Autoregression Model ..................................................... 65
4.4 EMPIRICAL RESULTS ...................................................................................... 68
4.5 CONCLUSION ................................................................................................... 72
CHAPTER FIVE ....................................................................................................... 73
CONCLUSION ......................................................................................................... 73
REFERENCES ......................................................................................................... 77
viii
LIST OF FIGURES
Figure 1: Southern African Development Community (SADC) Map ........................... 3
Figure 2: Estimated Transition Function for SADC Region ...................................... 53
Figure 3: Intraregional Trade Linkages..................................................................... 61
Figure 4: Impulse Responses to South African Inflation Rate Shock ....................... 70
ix
LIST OF TABLES
Table 1: Sub-Saharan Africa’s and SADC’s Contribution to World GDP and
Population: 2009 ........................................................................................................ 4
Table 2: Percentage Distribution of GDP at Market Prices......................................... 5
Table 3: SADC Real Growth Rates ............................................................................ 6
Table 4: Consumer Price Inflation for SADC Countries .............................................. 8
Table 5: Variable Description ................................................................................... 20
Table 6: Correlation Matrix for 11 SADC Countries .................................................. 21
Table 7: Descriptive Statistics .................................................................................. 22
Table 8: Panel Unit Root Tests ................................................................................ 24
Table 9: Dynamic Fixed Effects (FE) Estimates ....................................................... 28
Table 10: Dynamic Difference-Generalised Method of Moments Estimates ............ 28
Table 11: Dynamic System- Generalised Method of Moments Estimates ................ 29
Table 12: Dynamic Seemingly Unrelated Regression (SUR) Estimates................... 29
Table 13: Seemingly Unrelated Regressions ........................................................... 31
Table 14: Variable Description ................................................................................. 46
Table 15: Correlation Matrix for 11 SADC Countries ................................................ 47
Table 16: Descriptive Statistics ................................................................................ 48
Table 17: Panel Unit Root Tests .............................................................................. 49
Table 18: Linearity Tests .......................................................................................... 49
Table 19: Tests of No Remaining Non-Linearity....................................................... 50
Table 20: PSTR Model Estimation ........................................................................... 51
Table 21: Summary Statistics of Economic Growth and Inflation ............................. 58
Table 22: Direction of Merchandise Trade, 2008 ..................................................... 60
Table 23: Panel Unit Root Tests .............................................................................. 65
Table 24: Dynamic Results ...................................................................................... 68
Table 25: Shocks and Variance Decomposition ....................................................... 71
x
CHAPTER ONE
BACKGROUND AND INTRODUCTION
1.1.
INTRODUCTION
Central banks across the world are concerned with high levels of prices and strive for
achievement and maintenance of price stability. Therefore, the common objective of
macroeconomic policy is a low inflation rate which usually creates an environment
conducive to rapid economic growth (Fischer, 1993). Hence policy makers find it
important to understand this relationship so that sound policies can be developed.
For instance, adoption of an inflation targeting monetary policy framework by
countries such as New Zealand and United Kingdom, has been proven to work quiet
well in curbing inflation. If inflation is detrimetal to economic growth, it follows that
policy-makers should aim for low rates of inflation. This can be achieved by
increasing the interest rates which will inturn reduce investment and consumption
spending and this could cool down an overheating economy. However,
macroeconomic stability, defined as a low inflation rate is a necessary although not a
sufficient condition for sustained economic growth. This is evidenced by the fact that
most countries have grown slowly despite low inflation, for instance, this transpired in
the Franc zone during the 1980s (Fischer, 1983). Many cross-country studies
suggest the existence of a negative relationship between these two variables and the
magnitude of this relationship is envisaged to vary from region to region depending
on the level of development and other factors. This is because many developed
countries have well-established and independent central banks with a clear mandate
to keep inflation level within a particular target range.
As highlighted by (Hineline, 2003) the effects that inflation has on growth has been
questioned since the early 1990s. From the various time-series and panel data
studies, a stylized fact emerged, namely that there are substantial differences across
countries. On the one hand, some studies used linear techniques and just
investigated the nature of the inflation-growth nexus. The literature on inflationgrowth relationships is quite extensive, starting with the work of De Gregorio (1993)
and Fischer (1993) who, respectively found the existence of a negative relationship
1
between inflation and economic growth. On the other hand, other studies used nonlinear techniques and argued that there exists a threshold or optimal level of inflation
below which inflation may have no or even a positive effect on growth, and above
which inflation may be detrimental to economic growth.
Therefore, this body of
research investigated the nonlinearities in the inflation-growth relationship. Such
studies include, among others; Sarel, 1996; Bruno and Easterly, 1998; Ghosh and
Phillips, 1998; Khan and Senhadji, 2001; Moshiri and Sepehri, 2004; Mubarik, 2005;
Lee and Wong, 2005; Drukker et al., 2005; Pollin and Zhu, 2006; Li, 2006; Hineline,
2007; Schiavo and Vaona, 2007; Espinoza et al., 2010; Kan and Omay, 2010; Ibarra
and Trupkin, 2011; and Mignon and Villavicencio, 2011, who all used cross-country
data for both developing and developed countries to find that the negative
relationship between inflation and economic growth exists after certain threshold
level(s). Detailed methodological issues, data sets and findings are discussed in
Chapter three of the thesis. Therefore, this leads to the question; how low should the
inflation rate be? That is, at what level of inflation does the relationship between
inflation and economic growth become negative (Furuoka et al., 2009).
1.2 HISTORY AND OBJECTIVES OF SADC
In 1980, nine Southern African countries, namely; Angola, Botswana, Lesotho,
Malawi, Mozambique, Swaziland, Tanzania, Zambia and Zimbabwe formed the
Southern African Development Coordination Conference (SADCC) in an attempt to
decrease member countries’ external economic dependence on South Africa and to
promote regional co-operation in development projects (Ligthelm, 2006). Namibia
joined shortly after its independence in 1990 and these ten countries established the
Southern African Development Community (SADC) in August 1992 when these
countries signed the SADC Treaty. According to Oosthuizen (2006), technically the
organisation came into being on the 30 September 1993 when the Treaty entered
into force. The Republic of South Africa joined later in August 1994 after all-race
elections and Mauritius became the twelveth member in August 1995.
The
Democratic Republic of Congo and Sychelles joined in 1997 and Madagascar also
became a member in 2005. Therefore, SADC currently consists of fifteen member
states, namely; Angola, Botswana, Democratic Republic of Congo (DRC), Lesotho,
Madagascar, Malawi, Mauritius, Mozambique, Namibia, Seychelles, South Africa
2
(SA), Swaziland, Tanzania, Zambia and Zimbabwe, and its headquarters are in
Gaborone, Botswana. The member countries have differing levels of education,
health provisions and other socio-economic development. However, they have
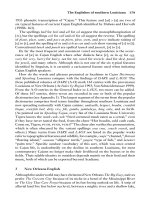
similar trade patterns and trade between themselves (Nel, 2004). Figure 1 depicts
the map of the SADC region.
The Article 5 of the SADC Treaty highlights the overall objectives of the Treaty, as
the promotion of economic growth and socio-economic development that will
eventually eradicate poverty, and promote and maintain peace, security and
democracy, through regional cooperation and integration (SADC, 2011).
Figure 1: Southern African Development Community (SADC) Map
Source: />
3
1.3 SADC ECONOMIC PERFORMANCE
Table 1: Sub-Saharan Africa’s and SADC’s Contribution to World GDP and
Population: 2009
World
Sub-Saharan
SADC
Africa
GDP in current prices (Billion US$)
57 722.09
% of World
8 93.73
-
Population (Millions)
6 726.06
% of World
-
468.83
1.55
0.81
778.19
268.56
11.57
3.99
Source: International Monetary Fund, September 2011
Table 1 depicts that both Sub-Saharan Africa (SSA) and SADC have an insignificant
contribution to the world’s GDP. Furthermore, as a share of world’s population, these
two regions constitute 11.6 per cent and 4 per cent for SSA and SADC, respectively.
In general, Table 1 shows that although this thesis uses the SADC region as a case
study, the contribution of this region towards the world GDP at large is very marginal,
hence the findings derived from this region may not necessarily be a true reflection
of the world at large. Nevertheless, it is important to understand what is happening in
the SADC region in terms of inflation and economic growth.
4
Table 2: Percentage Distribution of GDP at Market Prices (Constant: 2000=100)
Countries
2004
2005
2006
2007
Angola
5.54
6.31
7.23
8.39
Botswana
3.46
3.43
3.42
3.34
DRC
2.20
2.21
2.25
2.25
Lesotho
0.43
0.42
0.43
0.42
Madagascar
1.86
1.83
1.86
1.86
Malawi
0.80
0.77
0.80
0.81
Mauritius
2.34
2.31
2.32
2.28
Mozambique
2.65
2.71
2.83
2.85
Namibia
1.84
1.82
1.81
1.80
Seychelles
0.25
0.24
0.24
0.24
68.42
67.95
68.96
67.91
Swaziland
0.63
0.61
0.60
0.58
Tanzania
5.22
5.29
5.46
5.50
Zambia
1.74
1.73
1.77
1.77
Zimbabwe
2.65
2.37
-
-
Total SADC
100
100
100
South Africa
100
Source: International Monetary Fund, September 2011
As depicted in Table 2, South Africa is the largest contributor to GDP in the SADC
region at 67.9 per cent in 2007, followed by Angola and Tanzania at 8.4 per cent and
5.5 per cent in 2007, respectively. Botswana is the fourth largest contributor to GDP
in the region throughout the entire period. Therefore, South Africa is a giant in Africa
and dominates the SADC region. The smallest contributors are Lesotho, Seychelles,
Swaziland and Malawi at 0.42 per cent, 0.24 per cent, 0.58 per cent and 0.81 per
cent in 2007, respectively. The marginal contributions of these individual countries’
GDP towards SADC GDP may be due to the fact that these countries got their
national independence from colonial rule, from such countries as United Kingdom,
among others. Hence they may still be exploring their resources in order to
experience high and sustainable economic growth rates that may lead to higher
contributions in the future.
5
Table 3: SADC Real Growth Rates (Annual Percentage Changes)
Countries
2004
2005
2006
2007
Angola
11.2
20.6
20.7
22.6
Botswana
6.0
1.6
5.1
4.8
DRC
6.6
7.8
5.6
6.3
Lesotho
2.4
3.0
4.7
4.5
Madagascar
5.3
4.6
5.0
6.2
Malawi
5.5
2.6
2.1
9.5
Mauritius
5.5
1.5
4.9
5.8
Mozambique
7.9
8.4
8.7
7.3
Namibia
12.3
2.5
7.1
5.4
Seychelles
-2.9
6.7
6.4
9.6
South Africa
4.6
5.3
5.6
5.6
Swaziland
2.3
2.2
2.9
2.8
Tanzania
7.8
7.4
7.0
6.9
Zambia
5.4
5.3
6.2
6.2
-6.9
-2.2
-3.5
-3.7
5.7
5.7
6.6
7.4
Zimbabwe
Average SADC (Excl. Zimbabwe)
Source: International Monetary Fund, September 2011
In recent years, on average, the real economic growth rate in the region hovered
between 5.7 per cent and 7.4 per cent, from 2004 to 2007. Highest growth rates in
the region were recorded in Angola and the lowest were recorded in Zimbabwe
throughout the entire period, with Zimbabwe being the only country in the region that
registered negative growth rates in recent years. This can be attributed to the
persistent economic and humanitarian situation which led to high unemployment and
poverty in that country in recent years (IMF, 2011). Hyperinflation episodes were
also experienced in recent years in Zimbabwe as depicted in Table 4. These
episodes of hyperinflation led to the demise of the local currency (Zimbabwean
Dollar) and also led to complete dollarization during this period under consideration.
The local currency virtually disappeared from circulation, and goods and services
were priced in foreign currencies such as the US Dollar and the South African Rand.
Therefore, Zimbabwe can be thought of as a country that lost control of its own
finances due to hyperinflation episodes that were experienced in recent years, which
6
ultimately led to the collapse of the economy. Therefore, Zimbabwe is regarded as
an outlier since it may distort the true picture of the inflation and growth trends in the
region.
As it is well established by theoretical and empirical literature, high inflation episodes
are detrimental to economic growth. The negative growth rates in Zimbabwe were
further attributable to the deterioration in investors’ perception which ultimately leads
to worsening of the business climate in that country. However, for the entire region,
on average, inflation remains relatively low at below 10 per cent throughout the
entire period as depicted in Table 4. This low inflation rates are indicative of the fact
that the countries have over the years been striving towards the SADC inflation
convergence criteria that stipulate inflation rate of 5 per cent and 3 per cent by 2012
and 2018, respectively (SADC, 2011). The highest real economic growth rates in the
region during the period under consideration were recorded in Angola. The faster
economic growth in this country can be attributed to oil production as new deepwater
oilfields became operational. Furthermore, this higher growth rates are also
attributed to diamond mine output as production at kimberlite mines increased.
Manufacturing production also improved due to a better economic environment and
construction from rehabilitation of infrastructure. In addition; good weather, increase
in the cultivated area and timely availability of inputs are also highlighted as key
factors that led to higher agricultural production in Angola (IMF, 2011). In general,
higher growth rate in Angola seems to reflect a typical convergence growth pattern
from a lower base.
7
Table 4: Consumer Price Inflation for SADC Countries (Annual Percentage
Changes)
Countries
2004
2005
2006
2007
Angola
43.54
24.76
11.67
12.25
Botswana
6.95
8.61
11.56
7.08
DRC
3.99
21.32
13.20
Lesotho
5.02
3.44
6.05
8.03
Madagascar
13.81
18.51
10.77
10.30
Malawi
11.43
15.41
13.97
7.95
4.77
4.91
8.91
9.35
12.66
7.17
13.24
8.16
Namibia
4.15
2.26
5.05
6.73
Seychelles
3.84
0.88
-0.33
5.32
South Africa
1.39
3.40
4.64
7.10
Swaziland
3.45
4.77
5.30
8.1
Tanzania
0.03
8.63
6.42
7.03
17.97
18.32
9.02
10.66
282.38
302.12
1096.68
9.50
10.17
8.53
Mauritius
Mozambique
Zambia
Zimbabwe
Average SADC (Excl. Zimbabwe)
16.7
24411.03
8.91
Source: International Monetary Fund, September 2011
Several observations can be made from the stylized facts in the SADC region.
Firstly, the contribution of the region to the world’s GDP is small at 0.81 per cent. In
terms of distribution of GDP within the region, SA remains the largest contributor
throughout the years. Hence it is important to assess the effects of South Africa on
the rest of the region, focussing on inflation and economic growth in particular.
Thirdly, the member countries of the SADC seems to be converging in terms of
inflation and economic growth rates, with an exception of Zimbabwe, which has been
registering consistently high inflation rates over recent years.
1.4 PROBLEM STATEMENT
Although a significant body of research investigating the inflation-growth relationship
exists for developed as well as developing countries, none has been conducted for
8
African economies in particular. For instance, Ghosh and Phillips (1998) investigated
this relationship among all IMF member countries and found a negative and
statistically significant relationship between inflation and economic growth. Similarly,
Khan and Senhadji (2001) used a dataset for 140 countries comprising both
industrial and developing countries and they also found a negative relationship
between inflation and economic growth. Furthermore, Sepehri and Moshiri (2004)
compared the dataset for 24 OECD countries, 14 middle-income countries, 26 lowermiddle income countries and 28 low-income countries and also found a negative
relationship between the two variables2.
The particular focus of this study is the SADC region. As stipulated by the SADC
mission statement, the main mission of SADC is to promote sustainable and
equitable economic growth and socio-economic development through efficient
productive systems, deeper co-operation and integration, good governance and
durable peace and security, so that the region emerges as a competitive and
effective player in international relations and the world economy (SADC, 2011). The
importance of investigating the inflation-growth nexus in this region stems from the
notion that the member states are striving towards common goals and therefore are
likely to pursue similar macroeconomic policies. The motivation for the analysis
emanates not only due to the lack of any studies analysing inflation and economic
growth in the SADC region, but more generally, because of the fact that this
relationship may differ from the one that exists in developed countries due to the
level of economic development and prudent macroeconomic policies that are being
practiced in those regions (Sarel, 1996). The relationship may differ between
developed and developing countries because a vast majority of developed countries
have established independent central banks with a clear mandate to keep inflation
levels within a specific range through adoption of an inflation targeting framework.
However, in most developing countries, the central banks do not have a clear
inflation targeting monetary policy framework. Brazil is an exception since it has a
fairly independent central bank but has adopted an inflation targeting monetary
policy framework.
2 SADC member countries included in the sample of Low-income countries: Democratic Republic of
Congo, Madagascar, Malawi, Tanzania, Zambia and Zimbabwe; Lower-middle income: Swaziland;
Upper-middle income: Botswana, Mauritius and South Africa.
9
Furthermore, as discussed earlier, inflation is viewed to be one of the basic
indicators of macroeconomic stability. It is an indicator of the ability of governments
to manage the economy. Hence high levels of inflation may be indicative of a lack of
sound governance by the monetary authority of a country. It may even be a sign of
government that has lost control of its finances (Fischer,1993).
1.5 OBJECTIVE OF THE STUDY
The general objective of this study is to investigate the nature of the inflation-growth
relationship in the SADC context. Therefore, the study seeks to better understand
the effect of inflation on growth and whether SADC countries in particular are striving
towards common goals of achievement and maintainence of price stability. This has
important implications since theoretical models are considered to be relevant for the
role of policy on inflation. In order to achieve this main objective, the research is
decomposed into three specific objectives. Firstly, to investigate the general
relationship between inflation and economic growth using different panel data
econometric techniques which allows for several estimation problems such as
endogeneity,
heterogeneity,
and
cross-sectional
dependence.
Secondly,
to
investigate the nonlinearity of the inflation-growth nexus. In particular, the study
estimates the threshold (optimal) level of inflation which is conducive for economic
growth in the region. Thirdly, to investigate the response of a shock to inflation in
South Africa on inflation and economic growth in the rest of the SADC region. This
impulse-response analysis is in this context interesting because South Africa is the
largest economy in the region and trades extensively with the rest of the region.
On the one hand, it may be the case that most countries in the region import goods
and services from South Africa. This is likely to happen because South Africa is
better equipped in producing certain products given the state of technology, skills,
infrastructure, well-developed financial systems and good physical infrastructure.
Furthermore, South Africa is within reasonable proximity of many SADC countries;
hence these countries benefit from lower transportation costs amongst other things
when trading with South Africa, rather than countries further away. Therefore, it may
be expected that movements in South African inflation are likely to have economic
implications on inflation and economic growth in the rest of the region.
10
On the other hand, there may be no or limited economic spill-overs into the rest of
the SADC region due to the fact that if goods and services produced in South Africa
are relatively more expensive. These countries may opt to trade with the countries
other than South Africa (substutution effect) where they can get these good and
services at lower costs.
1.6 CONTRIBUTIONS OF THE STUDY
The study contributes to the body of knowledge in the field of economics by
enhancing the understanding of the inflation-growth relationship in the SADC region
in ways that have not been done before. Firstly, to the best of my knowledge, this is
the only study that looks into the inflation-growth relationship in the context of SADC.
The sample is restricted to only include countries in the SADC region since these
countries exhibit similar characteristics. Furthermore, this research takes advantage
of panel data methodologies so as to provide more robust estimates and confront the
potential bias emanating from problems such as endogeneity,
cross-country
dependence and unobserved country-specific effects that may have affected
previous empirical work on inflation-growth nexus.
Additional contributions of this study include the use of a non-linear model to
investigate the inflation-growth nexus. Some previous research determined the
threshold levels exogenously and did not take into account, the unobserved
heterogeneity at both country and time levels, for instance, Fischer (1993) and Bruno
and Easterly (1998). This study contributes to the body of knowledge by estimating
the threshold level endogenously. The smoothness of the transition from a low to a
high inflation regime is also estimated. Since non-linearities in the inflation-growth
relationship has never been researched in the SADC context before, this warrants
further investigation so as to ascertain if the same interrelationship exists as in
developed countries. The study concludes by investigating the impulse-responses
between inflation of the largest economy in the region, South Africa, and inflation and
economic growth of the other economies in the region.
11
1.7 OUTLINE OF THE STUDY
The rest of the study is structured into three papers. Chapter two contains the first
paper and sets the stage for investigating the inflation-growth nexus in the SADC
region. This analysis employs panel data econometric techniques to examine the
inflation-growth relationship in the region based on data ranging from 1980 to 2008.
The chapter uses Fixed Effects (FE), Difference and System Generalised Method of
Moments (DIF-GMM and SYS-GMM) and Seemingly Unrelated Regression (SUR)
estimators in examining the inflation-growth nexus. Overall, the results depict a
significant inverse relationship between inflation and economic growth in the SADC
region.
The second paper is presented in chapter three. This chapter examines the
nonlinearities in the inflation-growth nexus in the SADC region and estimates the
threshold level of inflation below which inflation may not have any impact, or a
positive impact on growth, or above which inflation may have a detrimental impact on
economic growth. In order to deal with the problems of endogeneity and
heterogeneity, the paper uses the Panel Smooth Transition Regression (PSTR)
method developed by González et al. (2005). The results depict the threshold level
of inflation to be 18.9 per cent, below which inflation has no impact on economic
growth and above which inflation is detrimental to economic growth in the SADC
region.
Chapter four investigates the effects of South African inflation on the rest of the
SADC region, looking specifically at the response of a shock to South African
inflation on the inflation and economic growth in the rest of the SADC countries. The
analysis is conducted using impulse-response functions derived from a Panel Vector
Autoregression (PVAR) as developed by Holtz-Eakin et al. (1988).
The PVAR
methodology is known to have the capacity to deal with the simultaneity problem,
thus avoiding a task of determining which variables are exogenous. In addition, this
methodology allows for different economic and institutional arrangements in each
country, thus; it allows for heterogeneity of cross-sectional units. The findings reveal
that South African inflation has a significant impact on inflation, openness,
investment and economic growth in the SADC region mainly due to the high trade
12
linkages in the region. In particular, most interestingly, South African inflation is
found to have a negative and statistically significant impact on economic growth in
the region for up to about 12 years after the shock, after which, the response
becomes insignificant. Chapter five discusses the conclusion of the research and
identifies areas for future research.
Although the thesis combines three different papers, they all fall under the same
theme of inflation and economic growth nexus in the SADC region. The results show
that a negative relationship exists between these two variables as is the case in
developed countries. Secondly, this research shows that the threshold level of
inflation in the SADC region is about 18.9 per cent and this is in line with the results
derived by some researchers such as Drukker et al., (2005), Mignon and
Villavicencio (2011), and Ibarra and Trupkin (2011), who found threshold levels of
19.2 per cent, 19.6 per cent and 19.1 per cent, respectively, for developing countries.
These findings are higher than the 2.5 per cent, 1 – 3 per cent, and 5 per cent found
by Ghosh and Phillips (1998), Khan and Senhadji (2001) and Moshiri and Sepehri
(2004), respectively, for developed countries. Therefore, this shows that central
banks need to put measures in place to improve economic growth by reducing
inflation when it is above or near this threshold level. As discussed earlier, these
measures may entail an adoption of a clear inflation targeting monetary policy
framework mechanism. Thirdly, the findings reveal that since South Africa is the
largest economy in the region, with extensive trade relations with the rest of the
SADC countries, its inflation has significant implications on inflation, openness,
investment and economic growth in the region.
13
CHAPTER TWO
INFLATION AND ECONOMIC GROWTH NEXUS IN THE SADC:
A PANEL DATA INVESTIGATION
2.1 INTRODUCTION AND MOTIVATION
The common objective of macroeconomic policy is a low inflation rate which usually
creates an environment conducive to rapid economic growth. Low inflation may
facilitate economic growth by encouraging capital accumulation and increasing price
flexibility. Given the fact that prices are sticky downwards, a moderate rise in the
level of prices will provide greater relative price flexibility required for an efficient
allocation of resources (Tobin, 1972). However, macroeconomic stability, defined as
a low inflation rate is a necessary, but not sufficient condition for sustained economic
growth. This is evidenced by the fact that most countries have grown slowly despite
low inflation, for instance, this transpired in the Franc zone during the 1980s
(Fischer, 1983). Many cross-country studies suggest the existence of a negative
relationship between these two variables. Furthermore, the magnitude of this
relationship is envisaged to vary from region to region depending on the level of
development and other factors.
Although a significant body of research investigating the inflation-growth relationship
exists for developed as well as developing countries, none has been conducted for
African economies in particular. For instance, Ghosh and Phillips (1998) employed a
large dataset covering all IMF member countries and found a negative and
statistically significant relationship between inflation and economic growth. Khan and
Senhadji (2001) used a large data set of 140 countries comprising both industrial
and developing countries. Due to the short time span of data from developing
countries, their analysis was conducted using an unbalanced panel. They found a
negative relationship between inflation and economic growth. Sepehri and Moshiri
(2004) compared the datasets for 24 OECD countries, 14 middle-income countries,
26 lower-middle income countries and 28 low-income countries and also found a
negative relationship between the two variables to exist for all four datasets.
14
This paper analyses the inflation-growth relationship in the SADC. The importance of
investigating the inflation-growth nexus in this region stems from the notion that the
member states are striving towards common goals and therefore are likely to pursue
similar macroeconomic policies.
The motivation for the analysis emanates not only due to the lack of studies
analysing inflation and economic growth in the SADC region, but more generally,
because of the fact that this relationship may differ from the one that exists in
developed countries due to the level of economic development and prudent
macroeconomic policies that are being practised in those regions (Sarel, 1996).
Furthermore, inflation is viewed to be one of the basic indicators of macroeconomic
stability, and can therefore be regarded as an indicator of the ability of the
government to manage the economy. High levels of inflation may be indicative of a
lack of sound governance by the monetary authority of a country, or even a sign that
government has lost control of its finances (Fischer,1993).
The contribution of this paper to the literature is twofold: Firstly, to the best of my
knowledge, this is the only study that looks into the inflation-growth relationship in
the context of SADC. The sample is restricted to only include countries in the SADC
region since these countries exhibit similar characteristics. Secondly, and more
importantly, the study takes advantage of panel data methodologies so as to provide
more robust estimates and confront the potential bias emanating from problems such
as endogeneity, cross-country dependence and unobserved country-specific effects
that may have affected the outcome of previous empirical work on inflation-growth
nexus.
In addition, these new panel data methods are able to accomodate
unbalanced panels.
The remainder of the paper is organised as follows: Section 2.2 focuses on the
relevant literature, while Section 2.3 contains the data description and section 2.4
discusses the methodology. The empirical results are presented in Section 2.5 and
Section 2.6 concludes.
15