Investigation on the spatial distribution of PM 2 5 by integraring satellite image from 2013 2015
Bạn đang xem bản rút gọn của tài liệu. Xem và tải ngay bản đầy đủ của tài liệu tại đây (1.51 MB, 61 trang )
THAI NGUYEN UNIVERSITY
UNIVERSITY OF AGRICULTURE AND FORESTRY
HA THI HONG
INVESTIGATION ON THE SPATIAL DISTRIBUTION OF PM 2.5 BY
INTEGRATING SATELLITE IMAGE FROM 2013-2015
BACHELOR THESIS
Study Mode : Full-time
Major
: Environmental Science And Management
Faculty
: International Training and Development Center
Batch
: 2012 - 2016
Thai Nguyen, December 2016
Thai Nguyen University of Agriculture and Forestry
Degree Program
Bachelor of Environmental Science and Management
Student name
HA THI HONG
Student ID
DTN 1253180048
Investigation on the spatial distribution of PM 2.5 by
Thesis title
integrating satellite image from 2013-2015
Assoc. Prof. Tang-Huang Lin
Supervisor(s)
MSc. Nguyen Van Hieu
Abstract:
Previous studies reported that human health is strongly and consistently affected by
outdoor fine mode particulate matter, the so-called PM2.5. The monitor of PM
concentration thus attracts much attention for the society. However, the observations
for a spatial distribution are limited
to the location of ground based stations.
Therefore, Satellite images with a wide coverage like MODIS, MISR and OMI have
been applied to overcome this limitation in terms of retrieved AODs.
For the application of total column AOD to PM concentration, the vertical
distribution and aerosol type should be taken into account. Association with extinction
profile of CALIPSO products and aerosol compositions from NGAI algorithm, the
AOD retrievals and PM2.5 are correlated in this study. As the result, the linear
regression between AOD from CALIPSO and PM2.5 has more uncertainty if AODtotal,
AOD1000 and AOD500 used as proxy to estimate PM2.5 concentration (R2<0.2)
compared to lower altitudes AOD200, AOD140 and AOD70. The result concluded that
AOD140 from CALIPSO can be used as a better proxy for PM2.5 concentration (R2
i
range from 0.58 to 0.79). Using NGAI algorithm classified aerosol compositions for
AERONET and validated to CALIPSO subtypes indicated that dominant aerosol type
(polluted continent) in study area is much improved AOD140 - PM2.5 relationship (R2
range between 0.86 and 0.99).
Keywords
PM2.5, AOD, CALIPSO, Aerosol types, NGAI, Aerosol
layers
Number of pages:
45
Date of submission:
03/12/2016
ii
ACKNOWLEDGEMENT
From bottom of my heart, I would like to express my deepest appreciation to
Associate Professor Tang-Huang Lin who in spite of being extraordinarily busy with
his duties, took time out to hear, guide, keep me on the correct path and complete
report during the time of conducting the research at Center for Space and Remote
Sensing Research (CSRSR) of National Central University (NCU).
I also wish to express my deep gratitude to MSc. Nguyen Van Hieu who gives
me an opportunity, guidance and support me to complete thesis. I would also like to
express my great appreciation to Mr. Wei Hung Lien and Ms. Chang Yi-Ling for their
constant support, patient guidance and suggestions related to my work. I sincerely
thank the additional members of Center for Space and Remote Sensing Research who
have contributed to my work. Last but not the least, I would like to thank all of my
family members and dear friends who always encourage and back me up unceasingly.
Thai Nguyen, December 2016
HA THI HONG
iii
TABLE OF CONTENTS
LIST OF TABLES .............................................................................................................. xi
LIST OF ABBREVIATIONS ............................................................................................xii
PART I. INTRODUCTION.................................................................................................. 1
1.1.
Research rationale ............................................................................................ 1
1.2.
Research’s questions ........................................................................................ 3
1.3.
The requirement ............................................................................................... 3
PART II. LITERATURE REVIEW .................................................................................... 4
2.1.
Ground based Measurements ........................................................................... 4
2.1.1.
Ground based Measurement - PM2.5 ........................................................... 4
2.1.2.
Ground based measurement - AERONET.................................................... 6
2.2.
Brief Description of Remote Sensing – CALIPSO.......................................... 7
2.3.
The Aerosol particles and Normalized Gradient Aerosol Index (NGAI) ...... 11
2.3.1.
The role of aerosol types............................................................................. 11
2.3.2.
Normalized Gradient Aerosol Index (NGAI) ............................................. 12
2.3.3.
AOD fraction of mixed type aerosols ......................................................... 14
2.3.4.
Study area ................................................................................................... 16
2.3.5.
Software ...................................................................................................... 16
PART III. DATA AND METHODOLOGY ...................................................................... 17
3.1. Data ..................................................................................................................... 17
3.1.1. AERONET - Ground based measurement ....................................................... 17
3.1.2. PM2.5 stations ................................................................................................. 19
iv
3.1.3. Satellite data ..................................................................................................... 20
3.2.
Methodology .................................................................................................. 22
PART IV. RESULT AND DISCUSSION ......................................................................... 26
4.1. Correlations between hourly PM2.5 and AOD in various layers ....................... 26
4.3.
Aerosol types classification and AOD Fraction Determination .................... 33
PART V. CONCLUSION AND SUGGESSION............................................................... 35
REFERENCES ................................................................................................................... 37
v
range from 0.58 to 0.79). Using NGAI algorithm classified aerosol compositions for
AERONET and validated to CALIPSO subtypes indicated that dominant aerosol type
(polluted continent) in study area is much improved AOD140 - PM2.5 relationship (R2
range between 0.86 and 0.99).
Keywords
PM2.5, AOD, CALIPSO, Aerosol types, NGAI, Aerosol
layers
Number of pages:
45
Date of submission:
03/12/2016
ii
Figure 11b: The improved correlation between AOD140 and PM2.5 in Tucheng from
2013 to 2015 ....................................................................................................................... 36
Figure 11c: The improved correlation between AOD140 and PM2.5 in Zhonghe from
2013 to 2015 ....................................................................................................................... 37
Figure 11d: The improved correlation between AOD140 and PM2.5 in Xindian from
2013 to 2015 ....................................................................................................................... 37
Figure 11e: The improved correlation between AOD140 and PM2.5 in Banqiao from
2013 to 2015 ....................................................................................................................... 38
Figure 12: The NGAI identification result without AOD fraction in Taipei_WCB .......... 39
Figure 13: The NGAI identification result with AOD fraction in Taipei_WCB ............... 40
Figure 1: Size comparison between two aerosols with diameters 2.5 and 10 µm, a
Formatted: Justified
human hair and a sand grain (credit: Environmental Protection Agency). ........................ 15
Figure 2: The orbit track of CALIPSO passes to Taiwan at 17:40pm on August 10,
2014 .................................................................................................................................... 19
Figure 3: Total Attenuated Backscattering signal measured by the CALIOP passed
Taiwan (red box) level 2 at 532 nm during the period 17:40- 17:54 UTC p ..................... 20
Figure 4: Vertical Feature Mask measured by the CALIOP passed Taiwan (red box)
level 2 during the period 17:40- 17:54 UTC ...................................................................... 21
Figure 5: Aerosol subtype classification information measured by the CALIOP passed
Taiwan (red box) level 2 during the period 17:40- 17:54 UTC ......................................... 23
Figure 6: Aerosol extinction coefficient profile from CALIPSO at 12:54:20 (LZT) on
March 27, 2013 in Taipei city ............................................................................................ 24
Figure 7: The scheme of AOD fraction determination for dual-type aerosols (type A
and B) based on NGAI values (Wei, 2016). ....................................................................... 28
vii
Formatted: Justified
Figure 8: The locations of AERONET site and PM2.5 stations selected in this study
(google map). ...................................................................................................................... 31
Figure 9: The flowchart of analysis procedure ................................................................... 33
Figure 10a: The linear regression between AOD140 – PM2.5 in Guting from 2013 to
2015 .................................................................................................................................... 35
Figure 10b: The linear regression between AOD140 – PM2.5 in Tucheng from 2013
to 2015 ................................................................................................................................ 36
Figure 11a: The improved correlation between AOD140 and PM2.5 in Guting from
2013 to 2015 ....................................................................................................................... 39
Figure 11b: The improved correlation between AOD140 and PM2.5 in Tucheng from
2013 to 2015 ....................................................................................................................... 39
Figure 11c: The improved correlation between AOD140 and PM2.5 in Zhonghe from
2013 to 2015 ....................................................................................................................... 40
Figure 11d: The improved correlation between AOD140 and PM2.5 in Xindian from
2013 to 2015 ....................................................................................................................... 40
Figure 11e: The improved correlation between AOD140 and PM2.5 in Banqiao from
2013 to 2015 ....................................................................................................................... 41
Figure 12: The NGAI identification result without AOD fraction in Taipei_WCB .......... 41
Figure 13: The NGAI identification result with AOD fraction in Taipei_WCB ............... 42
Figure 1: Size comparison between two aerosols with diameters 2.5 and 10 µm, a
human hair and a sand grain (credit: Environmental Protection Agency). .....................5
Figure 2: The orbit track of CALIPSO passed to Taiwan at 17:40pm on August 10,
2014 (Source: www-calipso.larc.nasa.gov) .....................................................................9
viii
Figure 3: Total Attenuated Backscattering signal measured by the CALIOP passed
Taiwan (red box) level 2 at 532 nm during the period 17:40- 17:54 UTC (Source:
www-calipso.larc.nasa.gov) .......................................................................................... 10
Figure 4: Vertical Feature Mask measured by the CALIOP passed Taiwan (red box)
level 2 during the period 17:40- 17:54 UTC (Source: www-calipso.larc.nasa.gov) ..... 11
Figure 5: The scheme of AOD fraction determination for dual-type aerosols (type A
and B) based on NGAI values (Lin et al., 2016) ........................................................... 15
Figure 7: The location of AERONET site and PM2.5 stations selected in this study
(Google map) ................................................................................................................. 19
Figure 8: Aerosol subtype classification information measured by the CALIOP passed
Taiwan (red box) level 2 during the period 17:40- 17:54 UTC .................................... 21
Figure 9: Aerosol extinction coefficient profile from CALIPSO at 12:54:20 (LZT) on
March 27, 2013 in Taipei city ....................................................................................... 22
Figure 10: The flowchart of analysis procedure ............................................................ 25
Figure 11a: The linear regression between AOD140 – PM2.5 in Guting from 2013 to
2015 ............................................................................................................................... 28
Figure 11b: The linear regression between AOD140 – PM2.5 in Tucheng from 2013 to
2015 ............................................................................................................................... 28
Figure 11c: The linear regression between AOD140 – PM2.5 in Zhonghe from 2013 to
2015…………………………………………………………………………………..31
Figure 11d: The linear regression between AOD140 – PM2.5 in Xindian from 2013 to
2015…………………………………………………………………………………..32
Figure 11e: The linear regression between AOD140 – PM2.5 in Banqiao from 2013 to
2015…………………………………………………………………………………..32
ix
Figure 12a: The improved correlation between AOD140 and PM2.5 in Guting from
2013 to 2015…………………………………………………………………………..34
Figure 12b: The improved correlation between AOD 140 and PM2.5 in Tucheng
from 2013 to 2015 ...................................................................................................…31
Figure 12c: The improved correlation between AOD140 and PM2.5 in Zhonghe
from 2013 to 2015 ........................................................................................................ 32
Figure 12d: The improved correlation between AOD140 and PM2.5 in Xindian
from 2013 to 2015 ........................................................................................................ 32
Figure 12e: The improved correlation between AOD140 and PM2.5 in Banqiao from
2013 to 2015…………………………………………………………………………..35
Figure 13: The NGAI identification result without AOD fraction in Taipei_WCB ..... 33
Figure 14: The NGAI identification result with AOD fraction in Taipei_WCB ......... 37
Formatted: Hyperlink, Font: Not Italic, Font
color: Auto, Do not check spelling or grammar
Formatted: Hyperlink, Font: Not Italic, Font
color: Auto, Do not check spelling or grammar
Formatted: Font color: Auto
Formatted: Justified, Space After: 0 pt
x
ACKNOWLEDGEMENT
From bottom of my heart, I would like to express my deepest appreciation to
Associate Professor Tang-Huang Lin who in spite of being extraordinarily busy with
his duties, took time out to hear, guide, keep me on the correct path and complete
report during the time of conducting the research at Center for Space and Remote
Sensing Research (CSRSR) of National Central University (NCU).
I also wish to express my deep gratitude to MSc. Nguyen Van Hieu who gives
me an opportunity, guidance and support me to complete thesis. I would also like to
express my great appreciation to Mr. Wei Hung Lien and Ms. Chang Yi-Ling for their
constant support, patient guidance and suggestions related to my work. I sincerely
thank the additional members of Center for Space and Remote Sensing Research who
have contributed to my work. Last but not the least, I would like to thank all of my
family members and dear friends who always encourage and back me up unceasingly.
Thai Nguyen, December 2016
HA THI HONG
iii
LIST OF ABBREVIATIONS
Formatted: Font: 14 pt, Bold, Font color: Auto
Formatted: Font color: Auto
Formatted: Normal, Line spacing: Double
planetary boundary layer
Aerosol Optical Depth
Total column AOD
AOD under 1000 m
AOD under 500 m
AOD under 200 m
APD under 140 m
AOD under 70 m
Particle mass with diameters less than 2.5 mm
The Normalized Gradient Aerosol Index
Light Detection and Ranging
Cloud-Aerosol Lidar and Infrared Pathfinder Satellite
Observation
AOD
Aerosol Optical Depth
Formatted: Font color: Auto
AODtotal
Total column AOD
Formatted: Font color: Auto
AOD1000
AOD under 1000 m
Formatted Table
Formatted: Font color: Auto, Subscript
Formatted: Font color: Auto
Formatted: Font color: Auto
Formatted: Font color: Auto, Subscript
Formatted: Font color: Auto
xii
AOD500
AOD under 500 m
AOD200
AOD under 200 m
AOD140
APD under 140 m
AOD70
AOD under 70 m
CALIPSO
Cloud-Aerosol Lidar and Infrared Pathfinder Satellite Observation
Lidar
Light Detection and Ranging
NGAI
Normalized Gradient Aerosol Index
PM2.5
Particle mass with diameters less than 2.5 mm
Formatted: Font color: Auto
Formatted: Font color: Auto, Subscript
Formatted: Font color: Auto
Formatted: Font color: Auto
Formatted: Font color: Auto, Subscript
Formatted: Font color: Auto
Formatted: Font color: Auto
Formatted: Font color: Auto, Subscript
Formatted: Font color: Auto
Formatted: Font color: Auto
Formatted: Font color: Auto, Subscript
Formatted: Font color: Auto
Formatted: Font color: Auto
Formatted: Font color: Auto
Formatted: Font color: Auto
Formatted: Font color: Auto
Formatted: Font color: Auto
Formatted: Font color: Auto
Formatted: Font color: Auto
xiii
PART I.
Formatted: Section start: New page, Width:
21 cm, Height: 29.7 cm, Top: (No border),
Bottom: (No border), Left: (No border), Right:
(No border), Not Different first page header
INTRODUCTION
Formatted: Font color: Auto, Pattern: Clear
1.1.
Formatted: Font: 14 pt, Bold
Research rationale
Formatted: Font: Bold, Font color: Auto
Air pollution exerts significant impacts influences on environments, visibility
Formatted: Font color: Auto
and human health. When particle matterparticulate matter (PM) concentrations become
high enough, they can pose serious health risks, especially to individuals with asthma
and other respiratory problems as well as affect transmission of solar radiation through
scattering and absorption (Nwafor et al., 2007). Airborne aerosols can also transport
fungal and viral microbial pathogens , which can lead to disease outbreaks in other
parts of the world.
Previous studiesy concluded pointed out that human health is strongly and
Formatted: Indent: First line: 1.27 cm
consistently affected by outdoor fine particle matterparticulate matter than coarse
particle matterparticulate matter (PM10), an increase of 50 µm/m3 in the concentration
Formatted: Font color: Auto, Superscript
Formatted: Font color: Auto
causes 1–8% more increase of deaths (Wallace, 2000) as well as cause serious
Formatted: Font color: Auto
Formatted: Font color: Auto
respiratory and cardiovascular diseases that lead to the premature mortality (Dockery,
Formatted: Font color: Auto
D.W., & Pope, 1994; Krewski et al., 2000; Pope et al., 2002; Künzli et al., 2005;
Formatted: Font color: Auto
Formatted: Font color: Auto
Brook et al., 2010). PM2.5 is considered as an important index of air pollutions;
Formatted: Font color: Auto
Formatted: Font color: Auto
especially it is one of the major air pollutants observed in the past decade in Taiwan
Formatted: Font color: Auto
Formatted: Font color: Auto
(Taiwan Environmental Protection Administration, 2008). PM2.5 is also well known
Formatted: Font color: Auto
Formatted: Font color: Auto
as smaller particles with aerodynamic diameters less than 2.5 mm., T the total mass
Formatted: Font color: Auto
Formatted: Font color: Auto
concentration of fine particles and is measured in ground-based measurement.
Formatted: Font color: Auto
Although theose ground-based measurements are relatively accurate, they are
representative of a limited area because aerosol sources could vary over small spatial
scales and the aerosol lifetime is less than an hour to a few days, depending on particle
1
size and chemical compositions (Schaap et al., 2008). Moreover, the large spatial and
Formatted: Font color: Auto
Formatted: Font color: Auto
temporal variability of airborne particles makes difficult to estimate the abundance at
any given locations based upon limited surface observations (Kumar et al., 2011).
Formatted: Font color: Auto
Formatted: Font color: Auto
Several studies have focused on correlating satellite AOD observations and PM2.5
concentrations by the most widely used total column AOD satellite aerosol products,
Formatted: Font color: Auto, Condensed by
0.2 pt
such as the Dark Target (DT)/Deep Blue (DB) MODIS and Multi-angle Imaging
Spectroradiometer (MISR; Diner et al., 1998; Kahn et al., 2010) aerosol products (e.g.,
Shi et al., 2011b) in order to overcome such limitations and provide information of aerosol
particles in the lower troposphere near the surface and monitoring aerosol concentration at
global/ regional scale.
Formatted: Font color: Auto
However, that needs be considered when applying satellite-based observations
in general, much less as a proxy for PM2.5 estimates. First, uncertainties exist in
satellite retrieved AOD values due to issues such as cloud contamination, inaccurate
optical models used in the retrieval process , and heterogeneous surface boundary
conditions (Toth et al., 2014). Any estimate of PM2.5 derived from satellite AOD data
Formatted: Font color: Auto
Formatted: Font color: Auto
cannot be more accurate than the AOD data themselves. Thus, relationships between
AOD and PM2.5 are likely to be highly sensor specific production. Second, AOD
derived from passive sensors is a column integrated value, and PM2.5 concentration is
a surface measurement. Under conditions where aerosol particles are concentrated
primarily within the surface/boundary layer, AOD is presumably a likelier proxy for
PM2.5 concentration. Finally, AOD is a column-integrated sum of total ambient
particle extinction, whereas PM2.5 is measured with respect to dried particles ingested
for analysis by corresponding instruments.
2
Thus, there are some essential reasons that make Lidar overcomes successfully
Formatted: Indent: First line: 1.27 cm, Line
spacing: Multiple 1.9 li
those limitation compared to other satellites: it provides its own illumination, aerosol
can be observed over the full globe night as well as day yielding a more complete
dataset for the validation of regional and global aerosol models. Lidar is able to
penetrate high optically thin cloud and profile a large fraction of the atmosphere as
well as retrievals AOD from near surface to total column which is the main key point
to solve the uncertainty of AOD - PM2.5 relationship problem. Furthermore, the
aerosol compositions also provides in occurrence of multiple aerosol layers which is
are contributed into the strength of such AOD - PM2.5 correlations (Schaap et al.,
Formatted: Font color: Auto
2008)
Indeed, the statistical regressions between AOD and in situ PM concentration
measurements can be strongly improved by both retrieved AOD near surface and
Formatted: Font color: Auto
Formatted: Indent: First line: 1.27 cm, Space
After: 0 pt, Line spacing: Multiple 1.9 li
Formatted: Font: Italic, Font color: Auto
aerosol compositions from Lidar. It is a vital role to conduct research “Investigation
Formatted: Font color: Auto
on the spatial distribution of PM 2.5 by integrating Satellite image from 2013-2015”.
Formatted: Font: Italic, Font color: Auto
1.2.
Formatted: Font: Bold, Font color: Auto
Research’s questions
Formatted: Font color: Auto
1.
Based on CALIPSO data, how AOD from full column and near surface
layers affected AOD-PM2.5 correlation and aerosol particles?
2.
Can near surface observations from CALIPSO be used as a better proxy
for PM2.5 concentration?
3.
Can aerosol classification from CALIPSO improves AOD-PM2.5
relationship in the near surface? What areis the main sources of regional air pollution
sources?
1.3.
The requirement
1.
Acquiring AOD AERONET from ground measurement, AERONET
3
Formatted: Indent: First line: 1.27 cm, Space
After: 0 pt, Line spacing: Multiple 1.9 li, Tab
stops: 2.25 cm, Left
TABLE OF CONTENTS
LIST OF TABLES .............................................................................................................. xi
LIST OF ABBREVIATIONS ............................................................................................xii
PART I. INTRODUCTION.................................................................................................. 1
1.1.
Research rationale ............................................................................................ 1
1.2.
Research’s questions ........................................................................................ 3
1.3.
The requirement ............................................................................................... 3
PART II. LITERATURE REVIEW .................................................................................... 4
2.1.
Ground based Measurements ........................................................................... 4
2.1.1.
Ground based Measurement - PM2.5 ........................................................... 4
2.1.2.
Ground based measurement - AERONET.................................................... 6
2.2.
Brief Description of Remote Sensing – CALIPSO.......................................... 7
2.3.
The Aerosol particles and Normalized Gradient Aerosol Index (NGAI) ...... 11
2.3.1.
The role of aerosol types............................................................................. 11
2.3.2.
Normalized Gradient Aerosol Index (NGAI) ............................................. 12
2.3.3.
AOD fraction of mixed type aerosols ......................................................... 14
2.3.4.
Study area ................................................................................................... 16
2.3.5.
Software ...................................................................................................... 16
PART III. DATA AND METHODOLOGY ...................................................................... 17
3.1. Data ..................................................................................................................... 17
3.1.1. AERONET - Ground based measurement ....................................................... 17
3.1.2. PM2.5 stations ................................................................................................. 19
iv
Formatted: Font color: Auto
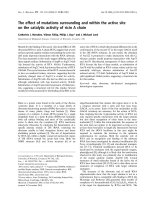
Figure 11: Size comparison between two aerosols with diameters 2.5 and 10 µm, a
human hair and a sand grain (credit: Environmental Protection Agency).
Formatted: Font: Italic, Font color: Auto
Formatted: Font color: Auto
Although ground-based measurements are generally considered to be accurate,
Formatted: Indent: First line: 1.27 cm
they are representative for only relatively small areas around point stations. Often, the
limited spatial coverage and irregular distribution of ground-based monitoring stations
largely restrict the study on space time dynamics of air pollution and its impacts on
human health and the environment. Alternatively, complex process- based air pollution
models, which estimate pollutant concentrations by considering pollutant generation,
transportation, and removal, are hampered in a lot of cases by the incomplete
information of anthropogenic emission inventories and natural sources (Koelemeijer et
Formatted: Font color: Auto
al., 2006). Thus, it is vital to access the source of air pollutants in various altitudes to
Formatted: Font color: Auto
cast doubt on the local emission or long range transport cause.
For the sake of monitoring and supervising the air quality in Taiwan, ground
PM2.5 measurement has established by Environmental Protection Administration
(EPA) Taiwan based on UK Daily Air Quality Index (DAQI) on 10/1/2014 with more
than 72 monitoring stations collects the measurements of PM10, PM2.5, SO2, NO2, O3,
5
and CO in real time. In this study, hourly averaged PM2.5 concentrations when the
satellite passeds over the study region were were downloaded from the national air
quality publishing platform ( PM2.5 value can be divided into
Formatted: No underline, Font color: Auto
Formatted: Font color: Auto
4 values with its corresponding effect to human health. When PM2.5 index is 1 or 2,
at-risk individuals should reduce strenuous physical activity and particularly outdoors.
When PM2.5 index is 3, general population should consider reducing activities and
outside. When it reaches to level 4 that mean air quality is really bad and people
Formatted: Font color: Auto
should reduce outdoor activities. The PM2.5 concentration related to air pollution
banding L, M, H and VH represent low, moderate, high and very high, respectively
(Table 1).
Table 1: PM2.5 concentration and air pollution banding
Formatted: Font: Italic, Font color: Auto
Index
1
2
3
4
Air Pollution banding
L
M
H
VH
0 - 35
36 -53
54 -70
≥71
PM2.5
concentration gm-3
Effect to human
health
Anyone experiencing
discomfort such as
sore eyes, cough or
Enjoy your usual
sore throat should
outdoor activities.
consider
reducing
activity, particularly
outdoors.
Reduce
physical
exertion, particularly
outdoors, especially if
you
experience
symptoms such as
cough or sore throat.
(Source: taqm.epa.gov.tw)
2.1.2. Ground based measurement - AERONET
Formatted: Font color: Auto
Formatted: Font: Times New Roman, 13 pt
Formatted: Font color: Auto
The ground-based AERONET ( network of Sun-
Formatted: Indent: First line: 1.27 cm
Formatted: No underline, Font color: Auto
sky radiometers (Holben , B. N., et al., 2001) produces measurements of solar direct-
Formatted: Font color: Auto
Formatted: Font color: Auto
beam transmission and sky radiance that are inverted to yield aerosol column size
distributions and complex refractive indices at four wavelengths: 440, 670, 870, and
6
Formatted: Font color: Auto
1020 nm (Dubovik & King, 2000) have demonstrated the use of AERONET-retrieved
Formatted: Font color: Auto
Formatted: Font color: Auto
complex refractive index to derive information about both aerosol black carbon
content and water uptake. AERONET provides columnar aerosol optical depths over
both land and ocean but is restricted to point observations (Alam et al., 2010). The
Formatted: Font color: Auto
Formatted: Font color: Auto
AOD observations are obtained from the AERONET program, which is a federation of
ground-based remote sensing aerosol networks to measure aerosol optical properties
(Holben et al., 1998). AERONET measurements can enable more accurate retrieval of
Formatted: Font color: Auto
Formatted: Font color: Auto
aerosol properties without surface reflectance information as it’s observe from direct
solar measurements. AOD is a unit less optical representation of the column loading of
atmospheric aerosols. The AERONET data provides AOD in the form of all points,
daily averages, and monthly averages. The usefulness of AERONET retrieved the
abundant of aerosol optical depth (AOD), as indicator of aerosol composition,
including black carbon, organic matter, and mineral dust (Schuster G.,et al., 2005) to
Formatted: Font color: Auto
Formatted: Font color: Auto
validate with aerosol classification retrieved from AOD CALIPSO.
2.2.
Brief Description of Remote Sensing – CALIPSO
Formatted: Font: Bold, Font color: Auto
Formatted: Font color: Auto
The Cloud-Aerosol Lidar and Infrared Pathfinder Satellite Observations
Formatted: Indent: First line: 1.27 cm
(CALIPSO) mission was developed as part of the National Aeronautics and Space
Administration (NASA) Earth System Science Pathfinder (ESSP) program in
collaboration with Centre National d’E´tudes Spatiales (CNES), the French space
agency, with the goal of filling existing gaps in our ability to observe the global
distribution and properties of aerosols and clouds (Winker, 2003).
Formatted: Font color: Auto
Formatted: Font color: Auto
Lidar is the only technique giving high resolution profiles of aerosols, generates
vertically resolved distributions of aerosol types and their respective optical
7
characteristics which have significant contributions to the top-of-atmosphere radiation
(Omar et al., 2009) and it is able to observe aerosol above bright surfaces, such as
Formatted: Font color: Auto
Formatted: Font color: Auto
deserts and snow, and above bright clouds. Because Lidar provides its own
illumination, aerosol can be observed over the full globe night as well as day yielding
a more complete dataset for the validation of regional and global aerosol models.
Furthermore, Lidar is able to penetrate high optically thin cloud and profile a large
fraction of the atmosphere. There are also limitations in current cloud ice–water phase
retrievals from passive satellite sensors. CALIPSO provides a vertically resolved
measurement of ice–water phase through measurements of the depolarization of the
Lidar backscatter signal. So the side-scattering Lidar is very suitable to detect aerosol
spatial distribution in the boundary layer from the surface. Three types of profiles are
provided in the level 2 products: total backscatter (parallel plus perpendicular) at
Formatted: Font color: Auto
532nm and 1064nm and the 532nm perpendicular backscatter. Vertical structure of the
Formatted: Font color: Auto
atmosphere most aerosols are present in the lowest 1 to 2 km of the atmosphere,
particularly in the mixing layer. However, it is not uncommon that substantial aerosolloaded air masses are present above the mixing layer. These aerosols are decoupled
from the ground and usually originate from sources far away. They are, therefore,
likely to have different (optical) properties than aerosols at ground level. Thus, in-situ
Comment [A1]: Xem lại
Formatted: Font color: Auto
measurements of aerosol properties at ground level are not always representative of
aerosol particles aloft and the total aerosol column above the measurement site. To be
able to recognize such cases, the vertical structure of the atmosphere needs to be
known, and particularly about the presence of aerosol layers and clouds. Lidar (Light
Detection and Ranging) instruments are well suited to detect aerosol layers, even
above the mixing layer (Schaap et al., 2009).
8
Formatted: Font color: Auto
The orbit track locations of CALIPSO passes passed to Taiwan one day at
Formatted: Font color: Auto, Expanded by 0.4
pt
particular time (Figure 2).
Formatted: Font color: Auto
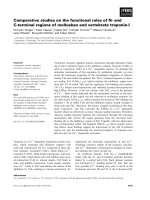
Figure 22: The orbit track of CALIPSO passeds to Taiwan at 17:40pm on August 10,
2014 (Source: www-calipso.larc.nasa.gov)
As shown in figure 3, the signal strength has been color coded such that blues
correspond to molecular scattering and weak aerosol scattering; aerosols generally
Formatted: Font: Italic, Font color: Auto
Formatted: Font color: Auto
Formatted: Indent: First line: 1.27 cm
Formatted: Font color: Auto
show up as yellow/red/orange. Stronger cloud signals are plotted in gray scales, while
weaker cloud returns are similar in strength to strong aerosol returns and coded in
yellows and reds. At higher altitudes, the horizontal atmospheric structure is more
homogeneous, at lower altitudes, observation of profile is more likely heterogeneous
due to local effects (Held et al., 2012). Engel-Cox , et al., (2004) and He, et al., (2006)
pointed out that aerosol vertical profiles derived from Lidar observations could
Formatted: Font color: Auto
Formatted: Font color: Auto
Formatted: Font color: Auto
Formatted: Font color: Auto
Formatted: Font color: Auto
Formatted: Font color: Auto
9
improve the correlation between columnar AOD and surface measurements of PM or
extinction (Ffigure 3).
Formatted: Font color: Auto
Formatted: Font color: Auto
Clouds
Aerosols
Figure 33: Total Attenuated Backscattering signal measured by the CALIOP passed
Taiwan (red box) level 2 at 532 nm during the period 17:40- 17:54 UTC (Source:
www-calipso.larc.nasa.gov)
Lidar (Light Detection and Ranging) instruments are well suited to detect
aerosol layers, even above the mixing layer which is important parameter for
Formatted: Font: Italic, Font color: Auto
Formatted: Font color: Auto
Formatted: Indent: First line: 1.27 cm
Formatted: Font color: Auto, Expanded by 0.3
pt
understanding the transport process in the troposphere, air pollution, weather and
climate change (Wang & Wang, 2014). In this study, Lidar provides information
Formatted: Font color: Auto, Expanded by 0.3
pt
on the vertical structure of the aerosol profile, atmospheric layering and the
Formatted: Font color: Auto, Expanded by 0.3
pt
presence of clouds up to an altitude of 15 km. The backscatter Lidar operates at a
single wavelength (532 nm) has its ability to estimate aerosol optical properties,
in additionally to the qualitative vertical aerosol, layer location (both vertically
Formatted: Font color: Auto, Expanded by 0.3
pt
and horizontally) and cloud profile (Schaap et al., 2008) (Figure 4).
Formatted: Font color: Auto, Expanded by 0.3
pt
Formatted: Font color: Auto
10
3.1.3. Satellite data ..................................................................................................... 20
3.2.
Methodology .................................................................................................. 22
PART IV. RESULT AND DISCUSSION ......................................................................... 26
4.1. Correlations between hourly PM2.5 and AOD in various layers ....................... 26
4.3.
Aerosol types classification and AOD Fraction Determination .................... 33
PART V. CONCLUSION AND SUGGESSION............................................................... 35
REFERENCES ................................................................................................................... 37
v