APC313 Financial Market
Bạn đang xem bản rút gọn của tài liệu. Xem và tải ngay bản đầy đủ của tài liệu tại đây (921.54 KB, 32 trang )
Financial Markets APC313
Nguyen Thi Kieu Anh - ID. 149078874/1
1
ASSIGNMENT COVER SHEET
UNIVERSITY OF SUNDERLAND
BA (HONS) BANKING AND FINANCE
Student ID: 149078874/1
Student Name: Nguyen Thi Kieu Anh
Module Code: APC 313
Module Name / Title: Financial Markets
Centre / College: Banking Academy of Viet Nam
Due Date: 16 Jan 2015
Hand in Date: 16 Jan 2015
Assignment Title: Individual assignment
Students Signature: (you must sign this declaring that it is all your own work and all sources
of information have been referenced)
Financial Markets APC313
Nguyen Thi Kieu Anh - ID. 149078874/1
Financial Markets
APC313
Prepared by: Nguyen Thi Kieu Anh
Student ID: 149078874/1
Submission Date: 16th January 2015
Number of Words: 5,994
2
Financial Markets APC313
Nguyen Thi Kieu Anh - ID. 149078874/1
TABLE OF CONTENTS
INTRODUCTION ..................................................................................................................... 4
Question 1 .............................................................................................................................. 5
1.1 Explain each of following terms: asymmetric information, moral hazard, and
quantitative easing (QE) and give example related to financial markets........................... 5
1.1.1 Asymmetric information ....................................................................................... 5
1.1.2 Moral hazard ......................................................................................................... 5
1.1.3 Quantitative Easing (QE) ...................................................................................... 6
1.2 Discuss why there is a need to regulate financial markets........................................... 7
Question 2 .............................................................................................................................. 9
2.1 Distinguish between the spot and the forward foreign exchange rates ........................ 9
2.2 How are these rates related and determined in the foreign exchange markets .......... 10
2.2.1 Purchasing Power Parity (PPP) ........................................................................... 10
2.2.2 Fisher Effect ........................................................................................................ 11
2.2.3 Interest Rate Parity (IRP) .................................................................................... 11
Question 3 ............................................................................................................................ 12
3.1 Explain the operations and activities of London Stock Exchange (LSE) market ...... 12
3.1.1 Operations ........................................................................................................... 12
3.1.2 Activities ............................................................................................................. 12
3.2 With reference to the relevant theoretical and empirical literature and data, critically
evaluate the efficiency of this stock exchange market..................................................... 14
3.2.1 Theory of Efficiency Market Hypothesis (EMH) ............................................... 14
3.2.2 Literature review of EMH research in LSE ........................................................ 15
3.2.3 Evaluate the efficiency of London stock exchange market ................................ 16
3.3 Explain recent upward surges in the FTSE 100 share price index ............................ 20
Question 4 ............................................................................................................................ 21
4.1 Explain the operation and activities and the need for money market ........................ 21
4.1.1 Explain the operation and activities of money market........................................ 21
4.1.2 Why is there a need for such a market ................................................................ 22
4.2 Explain how a central bank might use the money market to conduct monetary policy
in order to target the rate of inflation ............................................................................... 22
CONCLUSION ........................................................................................................................ 24
REFERENCES ........................................................................................................................ 25
APPENDICES ......................................................................................................................... 29
3
Financial Markets APC313
Nguyen Thi Kieu Anh - ID. 149078874/1
INTRODUCTION
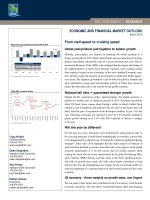
This research learns about many aspects of financial markets. Firstly, the research gives an
overview about terms ‘asymmetric information’, ‘moral hazard’, ‘quantitative easing (QE)’
and identifies the need for regulating financial markets. Secondly is distinguishing between
spot and forward foreign exchange rates and explain how these rates are determined in
foreign exchange markets. Next is presenting a brief description of the operations and
activities of London Stock Exchange (LSE). Besides, this research reviews studies about
efficiency of LSE market, thereby evaluating LSE efficient based on recent data from FTSE
100 Index and three companies listed in FTSE 100, and explaining recent upward surges in
FTSE 100. Finally, the research shows the basic understanding of the operations and
activities of money market, the need for such a market and explains how a central bank might
use the money market to conduct monetary policy in order to target the rate of inflation.
4
Financial Markets APC313
Nguyen Thi Kieu Anh - ID. 149078874/1
Question 1
1.1 Explain each of following terms: asymmetric information, moral hazard, and
quantitative easing (QE) and give example related to financial markets
1.1.1 Asymmetric information
According to Howells and Bain (2007, p.94), asymmetric information is the situation
where one party to a financial transaction has better information than the other relevant to
the transaction. In particulars, the issuers of financial instruments will have better
understand of those instruments, know exactly how mobilizing funds will be used, level
of risk and return involved than the buyers. The presence of asymmetric information
derived from conflict of interest, in which some issuers of financial instruments furnish
false or misleading information hurting the public to keep its own interests or gaining
higher profit. Asymmetric information results in two problems: adverse selection, which
occurs before the transaction (ex ante), and moral hazard, which occurs after the
transaction (ex post) (Mishkin and Eakins, 2012, p.25). In general, asymmetric
information implies information inefficiency of financial markets and source of market
failure.
The collapse of the Enron Corporation1 in 2001 is considered as a typical example of
asymmetric information. The existence of inequality information between management
and shareholders is pointed out by Butler and Park (2005, p.2) that Enron managers and
accountants deceived shareholders into believing the company was in much better
financial shape than it actually was, having information about company debt and revenue
that the general public did not have. This action makes inflation of company stock value
beyond its actual worth in order to increase management income and maintain
management control. As a result shareholders suffered a loss of $11 billion after this
scandal was revealed (White, 2011, p.30).
1.1.2 Moral hazard
Moral hazard means the borrower’s ability to apply the funds to different uses than those
agreed upon with the lender, who is hindered by his lack of information and control over
the borrower (Bebczuk, 2003, p.7). Moral hazard occurs after the transaction and refers to
immoral of funds’ users and drawbacks of regulation like government safety nets. For
instance, there are no high risk-taking incentives for private enterprises because no one
will rescue them from bankruptcy. In contrast, banks use the money mobilized from their
1
Enron was the seventh-largest U.S public company involved natural gas trading.
5
Financial Markets APC313
Nguyen Thi Kieu Anh - ID. 149078874/1
clients to engage in risky activities without fear of illiquidity risk because they always
believe that national government and central bank acting as “lender of last resort” would
always bail them out the collapse to keep confidence of public in the banking industry
(too-big-to-fail problem).
Moral hazard happens in case of Bernard L. Madoff. Bernard Madoff was chairman of
Bernard L. Madoff Investment Securities LLC (BLMIS) - one of the top market makers
on Wall Street and former non-executive Chairman of the NASDAQ stock exchange and
many related committees (Boyko, 2009, p.34). Since early 1990s, based on his own
reputation in Wall Street and the belief of investors that 10% interest was being added to
their account each year; Madoff attracted and defrauded a lot of investors (estimated up to
$64.8 billion) with Ponzi scheme - pay returns to investors from inflow of money of
subsequent investors rather than from profit (Amir, 2009). It was not until 2008 that
Madoff was arrested and sentenced to 150 years’ imprisonment for money laundering,
perjury, false filings with the SEC and fraud (CNN, 2014).
1.1.3 Quantitative Easing (QE)
QE is an extraordinary monetary tool used by central banks to stimulate the economy in
the period of recession. Normally, in response to economic difficulties, central bank will
stimulate more lending and spending by reducing interest rates. However, in case of
central bank has cut interest rates as far as they can go (zero bound) but the economy still
has not recovered, the central bank may pump money into the economy via so called
Quantitative Easing (Plumer, 2012).
Central bank creates new money electronically and pumps money into economy
indirectly by using money market to buy financial assets from private sector business,
including commercial banks, insurance companies, pension funds and non-financial
firms. Most of the assets purchased are low risk or risk free bonds (Bank of England UK,
2010). As commercial banks mobilize fund at a low interest, it will make low interest
loan. Central bank also injects money directly for enterprises by buying corporate bonds
having low levels of risk. It allows business to expand operations cheaply with aim of
lowering product prices and creating more jobs, whereby stimulus of spending on goods
and services. Therefore, in theory, QE is possible to achieve two objectives, namely boost
economic growth and reduce unemployment rate. On the other hand, it also has following
drawbacks: (1) Money creation of central bank lead to risk of inflation; (2) Attempting to
6
Financial Markets APC313
Nguyen Thi Kieu Anh - ID. 149078874/1
maintain low interest rate devalue the currency whereas aim of monetary policy is to
stabilize currency value; (3) Low interest rate of deposit along with high inflation cause
depositors to invest into foreign countries. Thus, QE only succeed when positive side
excels more than negative side.
In March 2009, Quantitative easing was first announced in UK at the same time as a last
cut in rates sharply to 0.5%. Under the agreement of the Treasury, the Bank of England
purchased £200 billion of assets, mainly UK government bond (gilts) from financial firms
such as banks, insurance companies and pension funds (called as ‘asset purchase
scheme’) with aim of boosting nominal spending and thereby helping achieve the 2%
inflation target (BBC, 2014a). QE operation had several effects in UK such as: (1) when
the bank bought assets, this increased their prices and depressed gilt yields by around 100
basis points (Joyce et al, 2011, p.211); (2) Owing to the return of gilts falls, it encouraged
the sellers of assets to invest higher-yielding assets like company shares and bonds. Along
with the bank of England also bought smaller corporate bonds, it helped businesses
reduce the cost of borrowing, in turn led to increase spending in the economy. According
to Joyce et al. (2011), net equity and corporate issuance by UK private non-financial
corporations were particularly strong in 2009, reversing the negative net issuance
observed over 2003–08; (3) Kapetanios et al. (2012, p.2) estimated that QE is likely to
have raised real GDP by as much as 1.5% to 2.0% and boosted annual CPI inflation by
between 0.75% to 1.5 percentage points, this would be equivalent to a 150 to 300 basispoint cut in bank rate. However, QE affected adversely savers especially pensioner’
income, for instance the annuity rates2 had fallen by 25% (Altmann, 2012).
1.2 Discuss why there is a need to regulate financial markets
According to Mishkin and Eakins (2012, p.30), the government regulates financial
markets for two main reasons: to increase the information available to investors
(efficiency), to ensure the soundness of the financial system (stability). Indeed, after the
failure of financial markets over the years, it is concluded that there are two features of
financial system that motivate for the entry of regulation: information asymmetry and
systemic risk.
As mentioned above, asymmetric information results in adverse selection and moral
hazard problem. Due to nature of financial markets, all financial products and services are
2
Rates of return on savings made for retirement
7
Financial Markets APC313
Nguyen Thi Kieu Anh - ID. 149078874/1
very complicated and difficult to compare. In unregulated market, the sellers have enough
information about the quality of securities while investors are not fully informed; risky
firms therefore have incentives to market poor quality securities. Since investors cannot
evaluate the quality of securities in advance of purchase, good firms cannot sell high
quality securities at high prices although investors are always willing to pay high prices
for it. The presence of the lemons problem or adverse selection causes securities markets
no longer effective channels to raise funds towards good firms as well as keep investors
out of financial markets (Mishkin and Eakins, 2012, p.141). Additionally, after
mobilizing funds from investors, borrowers may use it in a risky way or commit fraud as
case of Madoff in part 1.1.2 above. Such thing makes investors suffer losses when the
venture fails. It lessens confidence of public in financial markets as a result. In order to
gain public confidence and make financial markets become more efficiency, it is
extremely necessary for government to impose some regulations to protect participants of
financial markets from fraud and manipulation. For example, in US, The SEC was created
by the Securities Exchange Act, 1934, which was passed in the aftermath of the Wall
Street Crash in 1929 and the following great depression of 1931-3. The SEC requires
companies issuing securities to disclose certain information about sales, assets, and
earnings to the public and risk involved in investing. Besides, people who sell and trade
securities - brokers, dealers and exchanges must treat investors fairly and honestly,
putting investors’ interests first (Howells, 2010, p.209).
In intermediation financial markets like banks, the need for keeping customer confidence
is important more than ever. Banks operates mainly based on deposits from individuals
and institutions to make loan. If depositors doubts about the health of bank holding their
money, they may rush to withdraw cash from the bank. A “bank run” occurs leading to
risk of illiquid and collapse of the bank. The collapse of one bank causes a loss of
confidence in banking in general, creates bad debts for other banks and widespread
collapse (financial panics) (Howells and Bain, 2007, p.362). This is called “systemic risk”
or “risk of contagion”. Therefore, to defend the economy against financial panics,
government also need to provide proper financial regulations like restriction to entry and
limits on competition to reduce competitive level in banking system; capital requirement,
reserve requirement and deposit insurance and to protect and keep customer confidence.
8
Financial Markets APC313
Nguyen Thi Kieu Anh - ID. 149078874/1
Question 2
2.1 Distinguish between the spot and the forward foreign exchange rates
Spot rates are current market price (or rate of return) - the price available for deals to be
done now. The spot exchange rate is quoted as a spread - the difference in price at which
market makers are prepared to buy (“bid”) and sell (“ask”) (Howells, 2010, p.127)
A UK Company, for example, must pay 50 million US dollars to a US Company today,
20 November 2014.
11/20/2014 at 8:00 AM
Spot (GBP/USD)
Bid
Ask
1.5642
1.5645
Table 1: Spot rate (ukforex, 2014)
The ‘bid’ price is the price at which the currency dealer buys GBP in return of USD. The
‘ask’ price is the price at which the currency dealer sells GBP in return of USD.
The UK Company has GBP and wants to buy 50 million USD to pay debts, so it must pay
the ‘bid’ price. Thus, UK Company has to pay
= £31.965 million.
Forward rates are prices now for currencies to be delivered at some specified future
time. The forward rate may be the same as the spot rate, but usually it is higher (at a
premium to) or lower (at a discount to) than the spot rate (Howells, 2010, p.128).
For example, if the current GBP/USD spot is 1.5642/45 and the three-month forward rate
is 1.5639/41, it means USD is trading at a discount to GBP in European terms, then we
could say that the market expect GBP to appreciate against USD. It takes fewer GBP to
buy USD forward as a result.
There are some differences between spot and forward foreign exchange rate listed below:
Spot rate
Maturity
date
Objective
Value
Immediately (+2 days settlement
Forward rate
At a specified date in the future
basis)
Just make settlement
Make both settlement and hedging
- Have explicit value
- Do not have explicit value
- Outright exchange
- No money actually change hands
- Interest is not included in the
agreed-upon transaction
until some agreed upon future date
- Can take advantage of favorable
exchange rate at a future date
9
Financial Markets APC313
Nguyen Thi Kieu Anh - ID. 149078874/1
Do not provide protection against
Plan more safety since market
unfavorable movements in
participants know in advance what
Risk
exchange rates between pricing a
their foreign exchange will cost;
prevention
contract and the need to buy/sell
Hedging strategies are used to reduce
the foreign currency
exchange rate risk like locking in a
specific exchange rate
Table 2: The differences between spot and forward rate (Carbaugh, 2008, p.358)
To sum up, the biggest difference to distinguish between spot rate and forward rate is
hedging. By using forward rate, the trader can be protected from currency fluctuations
depend upon the terms of the contract.
2.2 How are these rates related and determined in the foreign exchange markets
In order to clarify how spot rate and forward rate related and determined in the foreign
exchange markets, it is necessary to understand the different theories of exchange rate
determination: Law of one price (LOP), Purchasing Power Parity (PPP), Fisher Effect and
Interest Rate Parity (IRP).
2.2.1 Purchasing Power Parity (PPP)
PPP is the idea that the exchange rate adjusts to keep purchasing power constant among
currencies or make good changes in inflation rates (Machiraju, 2002, p.76).
There are two versions of PPP: Absolute PPP and Relative PPP
Absolute PPP is based on the “law of one price”, where in the absence of transactions
costs, competitive arbitrage and official trade barriers, identical goods will have the same
price in different markets. The LOP has formula:
Pi = S × Pi* (1)
Where: Pi and Pi* are the domestic and foreign currency prices of commodity i (a good or
service) respectively and S is spot rate (Lafrance and Schembri, 2002, p.29).
As for PPP, P represents the total price of the basket of goods and services, where LOP is
applied to the aggregate economy:
P = P* × S
or
S=
(2)
Spot exchange rates in equilibrium are a reflection of differences in price levels in
different countries (Howells, 2010, p.147).
Relative PPP states that changes in exchange rate between two countries are explained
by differences in their inflation rates (Howells, 2010, p.147).
10
Financial Markets APC313
Nguyen Thi Kieu Anh - ID. 149078874/1
3
(3)
The spot rate of one currency with respect of another will change in reaction to the
differential in inflation rates between two countries (Madura, 2013, p.260)
2.2.2 Fisher Effect
Fisher Effect states that changes in short-term interest rates occur principally because of
changes in the expected rate of inflation (Howells and Bain, 2007, p.204)
rr = rn - Ie (4)4
International Fisher Effect (IFE) is derived from the PPP theory combines with the
Fisher effect5. It says that the difference in the nominal interest rates in two countries
determines the movement in the exchange rate between those two currencies (Howells,
2010, p.149).
S =
≈
-
(5)6
The spot rate of one currency with respect to another will change in accordance with
differential in interest rates between the two countries (Madura, 2013, p.260).
2.2.3 Interest Rate Parity (IRP)
IRP says that the interest rate differential between two countries is equal to the
differential between the forward exchange rate and the spot exchange rate (Investopedia,
2014).
F=S×
(6)7
The forward rate of one currency will contain a premium (or discount) that is
determined by the differential in interest rates between the two countries (Madura,
2013, p.260).
3
S0 is the spot exchange rate at the beginning of the time period; S 1 is the spot exchange rate at the end of the
time period; IF is the expected annualized inflation rate for foreign country; I D is the expected annualized
inflation rate for domestic country
4
rr: the real rate of interest; rn: nominal rate of interest; Ie: expected rate of inflation
5
PPP = Exchange rates depend on prices; Fisher effect = Interest rates depend on prices
International Fisher Effect = Exchange rates depend on interest rate
6
S represents the % change in the exchange rate; represents domestic country's interest rate; represents
foreign country's interest rate
7
F: Forward rate; S: Spot rate; :Interest rate of foreign country; : Interest rate of domestic country
11
Financial Markets APC313
Nguyen Thi Kieu Anh - ID. 149078874/1
Question 3
3.1 Explain the operations and activities of London Stock Exchange (LSE) market
London Stock Exchange (LSE), official founded in 1801, is the oldest and fourth-largest
stock exchange in the world and the largest in Europe (2011 figures). As one of the most
international stock exchange in the world, with around 3,000 companies from over 70
countries listed, it is a prime location for companies and investors to consider investment
(World Stock Exchanges, 2012).
3.1.1 Operations
LSE is organized market as it has physical location and listed securities are bought and
sold on a trading floor.
LSE has three core business areas:
Capital formation (Capital Markets): to raise capital (Main Market, the Alternative
Investment Market - AIM…)
Risk management (Post Trade Services): to provide a highly active and efficient
market for trading in a wide range of securities (Monte Titoli, CC&G)
Intellectual property:
-
Information Services: to supply real-time data and other financial information
to the global financial community (Regulatory News Service - RNS,
Proquote, FTSE Indices…)
-
Technology Services: to increase the capabilities of trading services
(MillenniumIT…) (LSEG, 2014, p.153).
Trading system: the two main types are order-driven system (SETS - Stock Exchange
Electronic Trading System and SETSqx - Stock Exchange Electronic Trading Service quotes and crosses) and quote driven system (SEAQ - Stock Exchange Automated
Quotation).
Trading mechanism: There are 3 main order types including market orders, limit orders,
and stop orders. It is carried out through brokers, market makers and specialists.
3.1.2 Activities
LSE has two main activities: primary market and secondary market
Primary market enables companies to raise capital efficiently depending on their
individual financing needs (equity or debt) (LSEG, 2014, p.24).
In order to be listed in LSE, companies must meet LSE’s requirements as follows:
12
Financial Markets APC313
Nguyen Thi Kieu Anh - ID. 149078874/1
LSE - Premium
1 Market capitalization
Minimum free float
2 Minimum number of shareholders
Minimum market cap of publicly held shares
£700,000
25%
×
3 Three year track record requirement
4 Working capital for next 12 months
Three years’ financial information
5
£175,000
≤ 6 months
≤ 18 moths
×
IFRS
or equivalent
Controlling shareholder requirements
×
subject to current consultation
Lock-up
×
Audit committee
Corporate governance disclosure
Age of audited
accounts in prospectus
6
and ≤ 9 months before listing
but common underwriting
requirement
against UK Corporate
Governance Code
Table 3: Summary of LSE premium’s listing requirement (Freshfields, 2014, p.2)
After meeting all listing requirements, firms begin to issue shares for the first time called
an initial public offering (IPO). Through IPOs, shares of companies are listed in the
stock exchange (Banerjee, 2008, p.22). New shares issue of quoted company called
seasoned equity offering (SEO).
Secondary market creates liquidity and determines the price of securities selling in the
primary market. Financial instruments in secondary market are traded among investors
through markets and trading platforms such as cash equities & ETFs (traded on LSE,
Turquoise…), derivatives (LSE Derivative, IDEM), fixed income (MTS, MOT…) and
commodities, power and specialist products (IDEM, IDEX, AGREX) (LSEG, 2014, p.7).
In order-driven markets, trading is done through an electronic order book. Brokers
acting on behalf of investors carry out placing purchase and sell orders based on formal
rules adopted by LSE. Orders are automatically ‘matched’ by the system and then
proceed to the settlement. Remainder of orders, where not fully matched, may be then left
on the system until completed (CFA, 2013, p.23). In quote-driven market, market
makers (financial institutions) input their prices to a central market system (e.g. SEAQ)
13
Financial Markets APC313
Nguyen Thi Kieu Anh - ID. 149078874/1
which market participants have access to view. Broker-dealer can then identify the market
maker that gives their client the most favorable price, and can call the market maker to
strike a deal (CFA, 2013, p.24).
In October 2012, LSE shorten the standard securities settlement cycle from T+3 to T+2.
This means that the cash and securities will be exchanged within two days of the trade
(LSEG, 2014, p.26). The trading day opened at 8:00 a.m. and closed at 4:30 p.m. in all
days of the week except for Saturday, Sunday and holidays. Opening session takes place
between 7:50 a.m. and 8:00:30 a.m. and closing session is 4:30 p.m. and 4:37 p.m. (Ellul
et al, 2005, p.26).
3.2 With reference to the relevant theoretical and empirical literature and data,
critically evaluate the efficiency of this stock exchange market
3.2.1 Theory of Efficiency Market Hypothesis (EMH)
According to Fama (1970, p.388), an efficient market is the one in which prices reflect all
available information. Efficient Market Hypothesis (EMH) is divided into three forms
namely weak form, semi-strong form, and the strong form based on the definition of the
available information set.
Weak form of the EMH states that all information contained in the past price movements
is fully reflected in current market prices. If weak form efficiency exists, then past history
of prices cannot be used for predicting future stock price movements, that is, technical
analysis is useless to earn abnormal return. Semi-strong form of EMH suggests that
current market prices reflect not only past prices but all other publicly available
information as well like announcement of dividends, annual earnings...If a market is
semi-strong form efficient, stock price will either response immediately with announced
news or no response at all because announced news is not necessary information.
Therefore, it is impossible for investors to achieve excess return by using fundamental
and technical analysis. Thirdly, strong form efficient market assumes that current prices
fully reflect all publicly and privately information. It means that in strong form efficient,
information spreads so fast that even corporate insiders cannot take advantage of insider
information to make abnormal profit (Brigham and Daves, 2013, pp. 189-191).
These three forms market efficient are tested in different methods. Weak form efficiency
is tested by statistical tests for independence, for example, autocorrelation tests (if
security returns are not significant correlated over time, the market is weak form efficient)
14
Financial Markets APC313
Nguyen Thi Kieu Anh - ID. 149078874/1
and run tests (if series of stock prices change or return change randomly and independent
over time, the market is weak form efficient). Semi-strong efficiency is tested by
assessing how security returns adjust to particular announcements, so-called event study.
If stock prices immediately reflected to information from the announcements, the market
is semi-strong efficient. For strong form efficiency, it is recognized by evidence of insider
trading profits. If corporate insiders earn superior return than other investors, the market
is not strong form efficient. However, it cannot be properly tested because the insider
information used is not publicly available (Madura, 2013, pp.300-301).
3.2.2 Literature review of EMH research in LSE
There are many studies conducted to test the efficiency of London Stock Exchange, some
of them are showed below:
Kendall (1953) tested for weak form market efficiency by finding serial correlation
coefficients for the first difference of weekly observations of 22 UK stock and
commodity price series. The result shows that stock prices follow a random walk. Kendall
concluded that investors could not make money by watching price movements. It means
market is weak form efficient (Praetz, 1973, pp.203-204). Nevertheless, a different result
is showed by Al-Loughani, N. and Chappel, D. (1997), they tested the validity of the
weak form on FTSE 30 share index, London Stock Exchange for the period 30 June 1983
to 16 November 1989 by using Dickey-Fuller tests, Lagrange multiplier test, BDS
statistic, and GARCH-M model. The result of the empirical tests shows that the weak
form efficiency is absolutely not valid for the FTSE 30 index because the series were not
consistent with any random walk (Sanusi, 2012, p.7).
Marsh (1979) tested for semi-strong form market efficiency by assessing the impact of
right issue announcement on the market price of all companies that had right issues
between July 1962 and December 1975 on LSE. The researcher concluded that UK
market is semi-strong form efficient as the right issues by companies do not have any
significant impact on post right issue announcement prices (Sanusi, 2012, p.10).
Gregory, Matatko and Tonks (1997) detected information from director’s trading. They
rejected strong form efficient when identifying excess returns in the months after the
director’s trades (insider trading) in United Kingdom financial markets (Friederich et al.,
2000, p.2).
15
Financial Markets APC313
Nguyen Thi Kieu Anh - ID. 149078874/1
3.2.3 Evaluate the efficiency of London stock exchange market
In order to evaluate efficiency of London Stock Exchange, the researcher uses historical
data collected from the FTSE 100 Index and three different listed companies in LSE
including Tesco PLC, Petrofac Ltd and Royal Bank of Scotland Group PLC.
Tesco PLC (LSE: TSCO) is Britain’s leading grocery and general merchandise
retailer and the third largest in the world. It was listed on the London Stock
Exchange in 1947 and is a constituent of the FTSE 100 Index. The company had a
market capitalization of approximately £15.27 billion as of 2 December 2014
(Shareprices, 2014).
Petrofac Ltd (LSE: PFC) is a leading provider of oilfield services to the
international oil and gas industry. In 2005, Group is admitted to the Official List of
the London Stock with market capitalization of approximately $1.3 billion and then
enters the FTSE 100 after 3 years (Petrofac, 2014).
Royal Bank of Scotland Group PLC (LSE: RBS) is a UK-centred bank
headquartered in Edinburgh, Scotland. It is in the top five of all companies listed on
the London Stock Exchange with market capitalization of approximately £24.98
billion. In 2009, the company was extremely proud to be voted ‘Best Listed
Structured Products’ provider and ‘Best Financial Innovation of the year’ in the
highly prestigious 2009 Shares Awards organized by Shares Magazine (RBS, 2014).
Based on data of closed prices collected of FTSE 100 and these three companies from 2
June 2014 to 28 November 2014, the researcher does two tests: weak and semi-strong
form efficiency.
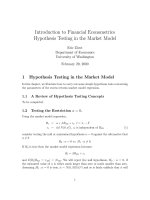
a. Test for weak form efficiency
The researcher uses random walk model to assess weak form efficient market.
16
Financial Markets APC313
Nguyen Thi Kieu Anh - ID. 149078874/1
LSE: TSCO
0.06
LSE: PFC
0.1
0.04
0.05
0.02
0
2-Jun-14
-0.02
17
2-Jul-14
2-Aug-14
2-Sep-14
2-Oct-14
0
2-Jun-14
-0.05
2-Nov-14
-0.04
-0.1
-0.06
-0.15
-0.08
2-Jul-14
2-Aug-14
2-Sep-14
2-Oct-14
2-Nov-14
-0.2
-0.1
-0.12
-0.25
-0.14
-0.3
Chart 1: Rate of return of TSCO (2 Jun 2014 - 28 Nov 2014) (Yahoo Finance, 2014b)
Chart 2: Rate of return of PFC (2 Jun 2014 - 28 Nov 2014) (Yahoo Finance, 2014c)
LSE: RBS
0.12
0.1
0.08
0.06
0.04
0.02
0
2-Jun-14
-0.02
2-Jul-14
2-Aug-14
2-Sep-14
2-Oct-14
2-Nov-14
-0.04
-0.06
Chart 3: Rate of return of RBS (2 Jun 2014 - 28 Nov 2014) (Yahoo Finance, 2014d)
Financial Markets APC313
Nguyen Thi Kieu Anh - ID. 149078874/1
As can be seen from charts above, the direction of changes in the return of three
companies is not repetitive. In other words, the stock prices of three companies change
randomly and independent over time. Three companies’ prices follow random walk
model so traders cannot use the past prices to predict future price movements. It can be
concluded that LSE is weak form efficient market.
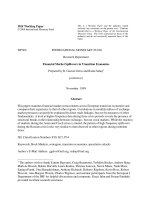
b. Test for semi-strong form efficient
In order to test for semi-strong form efficient, the researcher uses event study. According
to analysis in part 3.2.1, if stock prices immediately reflected to information from the
announcements, the market is semi-strong efficient.
Tesco PLC (LSE: TSCO)
4.00%
2.00%
0.00%
-2.00%
-4.00%
-6.00%
-8.00%
-10.00%
-12.00%
-14.00%
1/Sep
2/Sep
3/Sep
4/Sep
5/Sep
8/Sep
9/Sep
10/Sep
11/Sep
12/Sep
15/Sep
16/Sep
17/Sep
18/Sep
19/Sep
22/Sep
23/Sep
24/Sep
25/Sep
26/Sep
29/Sep
30/Sep
FTSE Index
TSCO
Chart 4: Rate of return of TSCO compared with FTSE 100 Index (1 Sep 2014 - 30 Sep 2014)
(Yahoo Finance, 2014b)
On 22 September 2014, Tesco announced that the company may have overstated its halfyear profit by 260 million pounds (US$407 million). After its announcements, the BBC
has learned one of eight Tesco executives suspended by the company over the £260
million profit misstatement has left the company (BBC, 2014b). The news must be a great
shock to investors of TSCO as it is easy to recognize that on the announcement day (22
September 2014) stock price of Tesco fell dramatically compared with the previous price
(approximately 11.59%). It continues to plunge by 4.19% on the following day of
announcement. This shows that stock prices of Tesco reflect immediately the new
information.
18
Financial Markets APC313
Nguyen Thi Kieu Anh - ID. 149078874/1
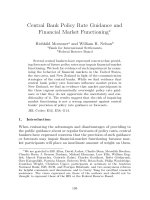
Petrofac Ltd (LSE: PFC)
5.00%
-5.00%
-10.00%
3/Nov
4/Nov
5/Nov
6/Nov
7/Nov
10/Nov
11/Nov
12/Nov
13/Nov
14/Nov
17/Nov
18/Nov
19/Nov
20/Nov
21/Nov
24/Nov
25/Nov
26/Nov
27/Nov
28/Nov
0.00%
-15.00%
-20.00%
-25.00%
-30.00%
FTSE Index
PFC
Chart 5: Rate of return of PFC compared with FTSE 100 Index (3 Nov 2014 - 28 Nov 2014)
(Yahoo Finance, 2014c)
On 24 November 2014, Petrofac reported that profit for 2015 will fall 25% as slowing
demand in China and abundant US output cuts oil price (The Guardian, 2014a). Daniel
Sugarman, market strategist at ETX Capital, said: “The firm has painted a grim picture
for 2015, warning of an expected profits decline of around 25%” (BBC, 2014c).
According to semi-strong form efficient, the stock prices of company will decrease
immediately owing to the bad news. Indeed, the news has hit Petrofac’s share hard. At
close Petrofac shares were down 26.45% as can be seen in the chart above.
Royal Bank of Scotland Group PLC (LSE: RBS)
12.00%
10.00%
8.00%
6.00%
4.00%
2.00%
-2.00%
-4.00%
1/Jul
2/Jul
3/Jul
4/Jul
7/Jul
8/Jul
9/Jul
10/Jul
11/Jul
14/Jul
15/Jul
16/Jul
17/Jul
18/Jul
21/Jul
22/Jul
23/Jul
24/Jul
25/Jul
28/Jul
29/Jul
30/Jul
31/Jul
0.00%
-6.00%
FTSE 100
RBS
Chart 6: Rate of return of RBS compared with FTSE 100 Index (1 Jul 2014 - 30 Jul 2014)
(Yahoo Finance, 2014d)
On 25 July 2014, Royal Bank of Scotland has released its first-half results early and
revealed that pre-tax profits will almost double to £2.6 billion due to a strong
19
Financial Markets APC313
Nguyen Thi Kieu Anh - ID. 149078874/1
performance by its ‘bad bank’ division (Tovey, 2014). This news would be a good and
unexpected for investors of RBS. After this news, the stock price surge dramatically
estimated about 10.77% compared with the previous price. It means that the news was
incorporated in company’s share prices.
From the result of three companies, it can be said that LSE is semi-strong form efficient
market. In conclusion, from tests above and some studies about efficiency of LSE market,
the researcher find out that market is assessed to be efficient or inefficient, in part depend
on periods, stocks and methods used.
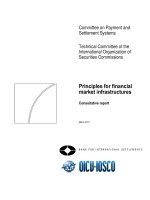
3.3 Explain recent upward surges in the FTSE 100 share price index
The FTSE 100 is a market-capitalization weighted index of UK-listed blue chip
companies. The index is part of the FTSE UK Series and is designed to measure the
performance of the 100 largest companies traded on the London Stock Exchange that pass
screening for size and liquidity (FTSE, 2014). The index began on January 3, 1984 with a
base value of 1000. The constituents of FTSE 100 index all traded on the London Stock
Exchange’s SETS trading system and are determined quarterly; the largest companies in
FTSE 250 index are promoted to the FTSE 100 index if their market capitalization would
place them in the top 90 forms of the FTSE 100 index. The free-float market
capitalization method is used for its computation (Kevin, 2010, p.116).
7000
6800
6600
6400
6200
6000
5800
2/Jun/14 2/Jul/14 2/Aug/14 2/Sep/14 2/Oct/14 2/Nov/14
Chart 7: Share prices of FTSE 100 Index in 2014 (Yahoo Finance, 2014a)
As can be seen in the chart above, FTSE 100 Index has an upward trend in the last
months of the year 2014, specifically from the end of October to the end of November.
Such upward trend can be explained by macroeconomic factors as follows:
On 31 October 2014, the FTSE has extended early gains to trade up 72.1 points at 6,535.7
after the Bank of Japan announced new stimulus measures (increasing its asset buying
20
Financial Markets APC313
Nguyen Thi Kieu Anh - ID. 149078874/1
programme to 80 trillion yen ($726bn; £454bn) a year, up from the previous rate of 60-70
trillion yen) to boost the country’s economic recovery. And the FTSE 100 index closed
1% stronger, up 82.9 points at 6,546.5 (Thisismoney, 2014). On 5 November 2014,
Europe’s leading stock markets have rallied as traders welcomed the Republican victory
in the US midterm elections. Accordingly, London’s benchmark FTSE 100 index rose
1.32 percent to end at 6,539.14 points (The Australian Business Review, 2014). Besides,
according to The Guardian (2014b), FTSE 100 hits nine weak high as central bank - the
People’s Bank of China reduced its one year lending rate by 40 basis points and its
deposit rate by 25 basis points and futher QE hints from the European Central Bank.
Recording its fifth week of rises, the FTSE 100 finished 71.86 points higher at 6,750.76
on 21 November 2014.
Question 4
4.1 Explain the operation and activities and the need for money market
4.1.1 Explain the operation and activities of money market
According to Mishkin and Eakins (2012, p.20), money market is a financial market in
which only short-term debt instruments (generally those with original maturity of less
than one year) are traded.
Operations
Money market provides a place to invest (warehouse) surplus funds and to borrow large
sums over a short period of time - most under 120 days, at slightly higher interest rates
compared to banks, but without losing liquidity and fear of default. The only condition
limiting the number of key participants in this market to only a few is that the
transactions have to be high volume and large denominations (wholesale market) upwards of $100 million in the UK (Mishkin and Eakins, 2012, p.255).
Trading method: Money market transactions are usually arranged over the phone and
completed electronically instead of taking place in a particular location (Mishkin and
Eakins, 2012, p.255).
Instruments: Two groups of instruments are issued and traded in money market, namely
discount instruments which have their return expressed as a rate of discount (e.g.
treasury bills, commercial bills…) and yield instruments which have their return
expressed as a conventional rate of interest (e.g. bank deposits, CDs - certificates of
deposit, REPO - repurchase agreements…) (Howells, 2010, p.24).
Key participants: are financial institutions such as governments, central banks,
21
Financial Markets APC313
Nguyen Thi Kieu Anh - ID. 149078874/1
commercial banks, large businesses, investment companies (brokerage firms), finance
companies, insurance companies, pension funds…
Activities
Money market operate on primary market and secondary market
Primary market refers to the initial issuance of a financial instrument in order to
mobilize short term capital. When an institution issues and sells a financial instrument, it
usually involves an investment bank which has responsibility for finding buyers for the
newly issued instrument. Secondary market is where purchaser of financial instrument
sells it to another investor to seek profit before the maturity date. The well-developed
secondary market for money market instruments (e.g. purchasers of money market
instruments sell them quickly in secondary market whenever they need for cash) makes
money market become more attractive (Ozyasar, 2014).
4.1.2 Why is there a need for such a market
In an unregulated world, money markets are not needed. The banking industry should
handle the needs for short-term loans and accept short-term deposits. Banks have an
information advantage on the credit-worthiness of participants (Garcia, 2011). Whereas
money markets must evaluate each borrower every time a new security is offered.
Moreover, short-term securities offered for sale are neither as liquid nor as safe as
deposits placed in banks (Mishkin and Eakins, 2012, p.255).
Nevertheless, in fact money markets are really necessary as it complements the banking
industry. Although banks are better able to deal with the asymmetric information between
savers and borrowers, it is subject to more regulations and governmental costs than
money markets. Therefore, in situations where asymmetric information is not severe,
money markets have a distinct cost advantage over banks in providing short-term funds
(Mishkin and Eakins, 2012, p.255). For example, reserve requirements create additional
expense for banks that money markets do not have. Besides, regulations on the level of
interest rates offered by banks could lead to a significant growth in money markets. When
interest rates rose, depositors moved their money from banks to money markets to earn a
higher interest rate (Garcia, 2011).
4.2 Explain how a central bank might use the money market to conduct monetary policy
in order to target the rate of inflation
No central bank can avoid some involvement in the conduct of monetary policy. This is
22
Financial Markets APC313
Nguyen Thi Kieu Anh - ID. 149078874/1
because the conduct of monetary policy must involve the setting of short-term interest
rates, and this is done by the central bank through using its role in the money markets
(Howells and Bain, 2007, p.53). In the situation when the amount of money spent grows
more quickly than the volume of output produced, inflation is the result. In this case,
changes in interest rates are used to control inflation (Bank of England, 2014).
The central bank sets interest rate at which it lends to financial institutions. These interest
rate immediately impact on the whole range of interest rates set by commercial banks,
building societies and other institutions for their own savers and borrowers. Lowering or
raising interest rate affects behaviours of individuals and firms in the economy. A
reduction in interest rates makes saving less attractive and borrowing more attractive,
which stimulates spending and ultimately to increase the rate of inflation. In contrast, a
rise in interest rates will increase demand for saving and reduce demand for making loans
and borrowing leading to fall in consumers’ spending and ultimately to lower the rate of
inflation. However, there are time lags before changes in interest rates affect spending
and saving decisions, and longer still before they affect consumer prices. For this reason,
central banks often operated with some intermediate targets such as inflation forecasts
(Bank of England, 2014). The central bank forecasts the future path on inflation and
compares it with the target inflation rate (the rate the government believes is appropriate
for the economy). The discrepancy between the forecast and the target determines how
much monetary policy has to be adjusted to achieve ultimate target (Jahan, 2014).
For example, in September 1994 the Bank of England reduced the inflationary pressures
by raising the official bank rate from 5.25% at the start of September 1994 to 6.75% for
nearly all of 1995. It raised the London Interbank Offered Rate (LIBOR) via interbank
transactions. After that, commercial banks increased the interest rate offered for their own
savers and borrowers. With high interest rate, people tended to save more, reduced
demand for making loans and borrowing which led to fall in spending and ultimately
inflation rate was beginning to fall by the end of 1995 (Anderton, 2003, p.617).
23
Financial Markets APC313
Nguyen Thi Kieu Anh - ID. 149078874/1
CONCLUSION
Based on collecting information from the variety of sources such as books, journals and
reliable websites as well as analysis of the writer, the writer hopes that this research can be a
helpful resource to help learners understand some aspect of “Financial Markets’ module.
24
Financial Markets APC313
Nguyen Thi Kieu Anh - ID. 149078874/1
REFERENCES
1. Altmann (2012) Annuities theft. Available at:
(Accessed: 18 November
2014).
2. Amir, E. (2009) Q&A on the Madoff Case. Available at:
(Accessed: 17 November 2014).
3. Anderton, A.G (2003) Economics. 3rd edn. Ormskirk: Causeway Press.
4. Banerjee, B. (2008) Fundamentals of Financial Management. New Delhi: PHI Learning
Private Limited.
5. Bank of England (2014) How Monetary Policy Works. Available at:
(Accessed: 01 December
2014).
6. Bank of England UK (2010) Quantitative Easing - How It Works. Available at:
/>4lt07WW (Accessed: 18 November 2014).
7. BBC (2014a) Economy tracker: Interest rates. Available at:
(Accessed: 18 November 2014).
8. BBC (2014b) Tesco executive under suspension leaves company. Available at:
(Accessed: 03 December 2014).
9. BBC (2014c) Petrofac shares sink on profit warning. Available at:
(Accessed: 03 December 2014).
10. Bebczuk, R.N. (2003) An introduction to asymmetric information problems in financial
markets. United Kingdom: Cambrige University Press.
11. Boyko, S. (2009) We're all screwed!. Cender Falls, Iowa: W&A pub.
12. Brigham, E. and Daves, P. (2013) Intermediate Financial Management. 11th edn. USA:
South-Western Cengage Learning, pp. 189-191.
13. Butler, R. and Park, Y. (2005) Safety practices, firm culture, and workplace injuries.
Kalamazoo, MI: W.E. Upjohn Institute for Employment Research.
14. Carbaugh, R. (2008) International Economics. 13th edn. Cambridge, Mass: Winthrop
Publishers.
15. CFA (2013) Chapter 2: Financial Markets. Available at:
/>(Accessed: 28 November 2014).
16. CNN (2014) Bernard Madoff Fast Facts. Available at:
(Accessed: 17 November
2014).
17. Ellul, A., Shin, H. S. and Tonks, I. (2005). 'Opening and Closing the Market: Evidence
from the London Stock Exchange', Journal of Financial and Quantitative Analysis,
Cambridge University Press, 40 (04), pp.1-35.
18. Fama, E.F. (1970) 'Efficient capital markets: A review of theory and empirical work', The
Journal of Finance, 25(2), pp.383-417.
25